Some new studies suggest that the yield curve inversion might not be quite as ominous as some of us have been assuming.
The yield spread is the gap between a long-term interest rate Rt (such as the ten-year Treasury rate) and a short-term rate rt (such as the 3-month Tbill rate). The spread Rt – rt is usually positive, reflecting a preference of lenders for short-term liquidity. But when the spread as recently becomes small or turns negative, that is often a harbinger of slower economic growth or even a recession.
 |
One way of describing the determinants of the yield spread comes from reasoning as follows. Suppose that instead of buying the 10-year bond and earning return Rt each year, you purchased a 3-month bill paying rt. Then 3 months from now you buy a new bill paying rt+1, 3 months after that you buy a bill paying rt+2, and so on until n = 40 the number of quarters spanned by a 10-year bond. Let Xt,n denote your average return from the latter strategy:
rt+2 + … + rt+n-1).
If Xt,n turns out to be bigger than Rt, then to a first approximation, you’d be better off with the Tbills than the bond. If Xt,n < Rt, the bond is better. We don’t know at date t which of these will be the case, but investors have some expectation, denoted Et(Xt,n), of what Xt,n will be. The expectations hypothesis of the term structure of interest rates holds that the long-term bond will be priced such that Rt = Et(Xt,n).
Although it’s an attractive theory, the expectations hypothesis is certainly not a perfect description of long-term yields. We can define the term premium Tt to be the amount by which the long yield Rt differs from the quantity predicted by the expectations hypothesis:
Tt = Rt – Et(Xt,n).
It then follows as a matter of definition that the yield spread can be decomposed into an expectations component and the term premium:
Rt – rt = [Et(Xt,n) – rt] + Tt.
We might then ask, to what extent is the observed correlation between the yield spread (Rt – rt) and subsequent GDP growth coming from the expectations component (Et(Xt,n) – rt) and to what extent from the term premium (Tt).
The problem is that we don’t have any direct observations on the subjective beliefs of bond-holders, and therefore don’t get to observe Et(Xt,n) directly. One way to get around this is to posit that, whatever investors believe, they form their opinions rationally. From this assumption it would follow that any components of Rt – Xt,n that were predictable at time t would be interpreted as part of the term premium. My 2002 paper published in the Journal of Money, Credit and Banking (coauthored with Professor Dong Heon Kim whom I am visiting this week at Korea University) uses this fact to estimate separately the contribution of the term premium to the predictability of GDP growth. We found that it makes a similar, though smaller, contribution as the expectations component. A later paper by Professors Carlo Favero, Iryna Kaminska, and Ulf Soderstrom, all of the University of Bocconi, reached a similar conclusion.
A more structured approach was suggested in a research paper by Andrew Ang of Columbia University, Monika Piazzesi of the University of Chicago, and Min Wei of the Federal Reserve Board that appeared in the Journal of Econometrics last March. One can try to calculate forecasts of future short rates on the basis of the most recent GDP growth, short rate, and yield spread as a function of those three variables, and then calculate what the current yield on any maturity should be (again as a function of these 3 variables) if the expectations hypothesis were true. This predicted relation for the yield can be compared with what appears to be the actual empirical relation, with the deviation between the predicted and actual then fit to a particular parametric function that is interpreted as the term premium. Using this decomposition, Ang and coauthors found that it seemed to be the expectations component rather than the term premium that helps to forecast GDP.
A
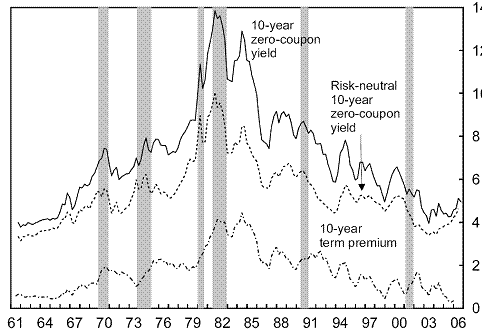
new study on this question has just been completed by Glenn Rudebusch and Eric Swanson, two very accomplished and widely respected researchers at the Federal Reserve Bank of San Francisco, and former Fed star Brian Sack, now at Macroeconomic Advisers. Their paper reviews these and a number of other approaches to measuring the term premium, and comes out in favor of an approach developed by Don Kim and Jonathan Wright (two other excellent Fed researchers familiar to Econbrowser readers). The Kim-Wright model is similar in spirit to the Ang-Piazzesi-Wei approach, positing that the interest rate at any maturity could be described as a linear function of three unobserved factors. The expectations component is again inferred by extrapolating the behavior of these factors forward, and any deviation between the actual pricing relation and that predicted by the expectations hypothesis is again interpreted to be the term premium.
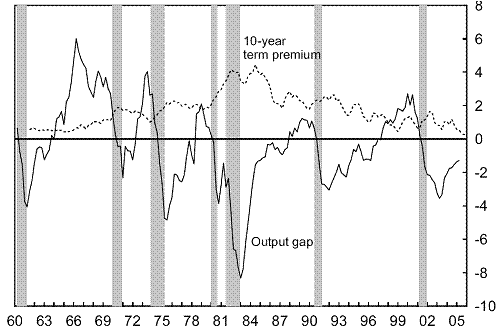 |
The figure above, taken from Rudebusch and coauthors’ paper, plots the Kim-Wright term premium over the last half century, along with the deviation of output from the level believed by the Congressional Budget Office to be associated with full employment. This measure of the term premium appears to be countercyclical, rising when output is low. This is the opposite of the relation found by myself and other previous researchers, and suggests that it is only the expectations component that accounts for the anticipatory procyclical behavior of the yield spread.
 |
The Kim-Wright measure of the term premium has declined substantially over the last four years. In terms of the statistical procedure, this reflects the fact that a reasonable forecast of future short rates has increased over this period, while the long rate has declined. Possible explanations for this decline in the term premium offered by Kim and Wright include reduced variability of inflation and output, greater interest in U.S. securities from foreigners, and modest business capital spending. To the extent that the decline in the yield spread does represent a fall in the term premium, and if indeed a fall in the term premium itself does not signal an economic slowdown, it means that the current negative yield spread does not have quite as bearish a connotation as the historical correlation between the yield spread and output might otherwise suggest.
Notwithstanding, it is clear that recent week-to-week moves in the yield spread do not represent fluctuations in the term premium, but instead have been dominated by news about the real economic outlook, with prospects for slower economic growth translating into lower expectations for future short rates and a lower yield spread. Insofar as that’s the case, the recent pitch into negative territory must still be regarded as worrisome.
But just how worrisome? Slower than normal growth still looks to me like a safe bet. On the other hand, the negative growth characteristic of a recession is a little less likely than I regarded it before studying the latest research.
Technorati Tags: macroeconomics,
Federal Reserve,
yield curve,
interest rates,
term premium
Of late, I’ve been pondering why an inverted yield curve is onerous. Your discussion today was most illuminating.
I must add that I’ve come to regard your blog as my favorite little corner of rationality about economics (a new found hobby of mine). I also love the math! – seriously.
JBD, an inverted yield curve is ominous because:
Banks receive funds from depositors.
Banks pays those depositors interest on their savings accounts, checking accounts, and CDs.
An inverted yield curve means that the interest payments to depositors (short-term rates) are relatively high.
The bank takes those deposits and makes loans against them, for cars, homes, business expansion, etc.
An inverted yield curve means that the interest rates (medium/long-term) that banks can charge for use of depositors’ money is relatively low.
So, banks see high costs (paid to depositors) and low returns (from loans). Thus, banks slow down on their lending. Thus, consumption and business activity slows, as credit is not as readily available. That’s why an inverted yield curve is ominous, as it portends (actually, causes) a slow down in economic activity.
jg, don’t you know that banks don’t need quaint things like the term spread to make money anymore? Our Modern And Innovative Banks ™ nowadays have moved on to originating and hocking junk debt, proprietary trading, prime brokering for hedge funds, and other “exotic” forms of finance. Get with the program, man.
This is the bubble economy. The rules are different!
Thank you for posting more on the yield curve. Much appreciated.
“…the negative growth characteristic of a recession is a little less likely than I regarded it before studying the latest research.”
Do you mean to say that you now think recession is less likely than you thought it to be prior to reading these papers, or that there is some characteristic of recession which you call the “negative growth characteristic”, which you now see as less likely, in the case of recession? The math and the text all seemed clear, but that bit is beyond my meager comprehension.
The problem is that we don’t have any direct observations on the subjective beliefs of bond-holders, and therefore don’t get to observe Et(Xt,n) directly. One way to get around this is to posit that, whatever investors believe, they form their opinions rationally.
Using this decomposition, Ang and coauthors found that it seemed to be the expectations component rather than the term premium that helps to forecast GDP.
This is the opposite of the relation found by myself and other previous researchers, and suggests that it is only the expectations component that accounts for the anticipatory procyclical behavior of the yield spread.
Thanks Professor. You have confirmed my understanding of economics as a behavioral science.
Sorry to be unclear, kharris. I was trying to remind readers that any recession usually involves negative, not just slow growth. The papers make me lower the probability that we will experience an actual recession. Nonetheless, I still am expecting slow growth.
I have always been a proponent of using the term structure as a precursor of recession and find the work you presented very interesting. The inverted curve is not a talisman. As such, one must always look at the underlying forces that make the curve work as a precursor — the supply and demand for credit. In past years, the curve inverted when all rates were rising and the Fed had to raise rates faster in order to slow the growth of credit. One recent exception was the bull inversion that occurred in 1998. No recession ensued. This time around we have the Fed driving the funds rate to neutral and the markey rallying the long end in anticipation of a slowdown while the credit creation process, directly and through intermediaries, is rumbling along nicely. All said, slower growth is the Fed’s plan, but tying this curve to a coming recession is a bit of a stretch.
It seems to me that this inversion is atypical in that long-term rates are being depressed by Asian & oil-state central banks buying US treasuries. Ironically, by lending to the US so cheaply, foreign central banks are stimulating the US economy in the short term.
Yet another example of the inadequacy of math constructs to deal with the infinite wrinkles of economics.
Algernon,
This has been going on since Alexander Hamilton was Secretary of the Treasury.
AK, ha, ha! I stand corrected, and ‘believe!’
Biting in on steve’s closer:
“All said, slower growth is the Fed’s plan, but tying this curve to a coming recession is a bit of a stretch.”
And do we need to stretch this out? We do!
I agree that the Fed did/does want to pare the housing growth back and would like to do this without initiating a recession, but has the credit issuance been restrained? Or has this recession just been delayed somewhat and at some cost?
Those other components (ex-housing) that are recipients of this exodus from US housing investment do not seem to be say, Ford or GM with their US plant closures.
That is, unless you want to examine the financials and ponder the flight to corporate junk bonds, and the true meaning of Junk. [Rumored to be less junky than tbills by the diversifying PBoC.]
Where is that real investment (ok, think hardware, tangible goods –not CDOs et al and preposterous paper shuffling purporting to cover risks arising from non-paper-shuffling activities) in goods/services that stretches us past this (neva coming here) recession?
Hamilton’s Yield Curve Study
I’m not doing another “News of the World” post for a while but I just wanted to mention this very interesting post by James Hamilton (EconBrowser). It’s a careful discussion of the connection between the yield curve, the term st…
Dick,
The Dutch bankers who lent Hamilton money couldn’t print up Yuan & Yen at will. The Asians are massively monetizing our debt to keep their currenies cheap. Can you actually point to a similar historical event of this scale?
All these talks are very soothing — but I am still worried. I remember hearing the similar talks about 6 years ago and we all know what happened that time (and look at the chart: the yield curve was only mildly inverted that time). Historically, the Fed had only one success in pulling out a soft landing, which is the 1995 episode, and they might just be lucky that time: the positively technological shocks arrived about that time.
Professor,
Thank you very much for the nice summary. I find it most useful.
Great summary and review of the literature.
The yield curve and the term premium
Sees slower growth ahead, but less chance of a full-blown recession
Thanks for the summary, its worth noting that the past two recessions didn’t exist if housing and autos are taken out.
At what short term rate does Japan and China shorten their duration? Seems like there is a ton of money making a huge bet that LTRs will fall. If the Fed brings STR up a bit more will that finally compell them to shorten their duration and normalize the curve?
Is this the central issue or am I missing something?