The March employment figures have almost universally been hailed as evidence of a strong labor market, given how the announced value exceeded expectations, and the fact that previous months values were revised upward (WSJ1, WSJ2, Reuters, Bloomberg; contrarian opinion at Big Picture, Capital Spectator). (Jim Hamilton has already discussed how likely these figures are to be revised, in light of other complementary data.) Without disagreeing, I think it behooves us to consider other ways of looking at the data.
First, consider other measures of employment. In Figure 1, log payroll employment (blue), log civilian employment (green) and log civilian employment smoothed and adjusted to match the payroll definition (red) are shown over the past seven years.
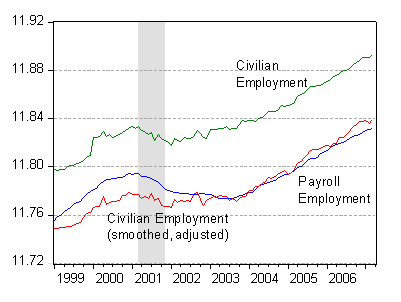
Figure 1: Log payroll employment (blue), civilian employment (green), and civilian employment smoothed/adjusted to conform to payroll employment definitions (red); gray shading denotes NBER-defined recession dates. Sources: St. Louis Fed FRED II, BLS, NBER and author’s calculations.
From a distance, all employment indicators seem to be growing at a healthy pace. However, a comparison against the last expansion’s experience is illuminating. In relation to the NBER-defined trough in economic activity, employment is five percent lower than it was in a comparable point in the previous expansion, itself remarked upon for its lagging job creation.
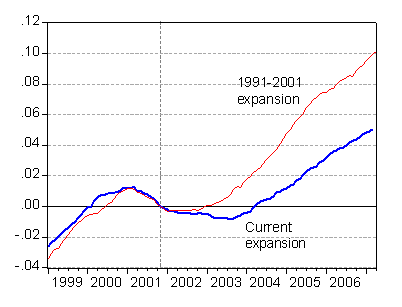
Figure 2: Payroll employment, current expansion (blue), and 1991-2001 expansion (red), all normalied to value of unity at NBER defined cyclical trough. Dashed line defines NBER defined trough, at 2001m11 and 1991m03. Sources: St. Louis Fed FRED II, NBER and author’s calculations.
Now, it might be argued that with accelerated productivity growth, and/or lower labor force participation rates, the cumulative increase of employment should be lower relative to the last expansion. Without disagreeing with this assertion, I think a look at employment growth rates is not necessarily reassuring.
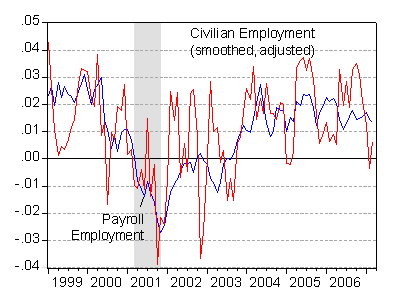
Figure 3: Three month annualized growth rates of payroll employment (blue) and civilian employment smoothed/adjusted to conform to payroll employment definitions (red); gray shading denotes NBER-defined recession dates. Sources: St. Louis Fed FRED II, BLS, NBER and author’s calculations.
Employment growth (3 month log differences, annualized), measured using the payroll employment series (blue) or the civilian employment smoothed/adjusted series (red), is clearly decelerating. While over the last six months, the decline using the smoothed/adjusted series is more pronounced than that using payroll employment, given the higher volatility of the former series, one would not like to read too much into the difference. What is true is the trend over the past two years is the same: downward.
To formalize this, I take a cue from this Deutsche Bank report:
“Labor is last to go. Weakening profits against the backdrop of rapidly decelerating capex will eventually hurt hiring because profit margins will come under pressure. This is what happens in every cycle, only the timing and size of the adjustments vary. In the late 1990s, it took several years before slowing profits led to
slowing employment, because capex remained strong as many companies imprudently over-expanded their capital infrastructure, e.g. telecom. When capex peaked in Q4 2000, it did not take long for the unemployment rate to rise and for payrolls to decline. The former began rising in Q1 2001 (from only 3.9%), while payrolls turned
negative the following quarter. At that point the economy was already in trouble, forcing the Fed to ease aggressively. Often the labor market is the last sector to falter, and if the Fed waits to see this before acting, downward momentum could be substantial at that
point.” (J.A. Lavorgne, US Economics and Strategy Weekly, Mar. 30)
Hence, I estimate a regression of the q/q change in quarterly payroll employment growth on one lag of the change in real equipment and software investment and three lags of real GDP over the 19671-07q1 period. This leads to the following regression result:
dnt = 0.0002 + 0.045(dequipt-1)
+ 0.197(dyt-1) + 0.173(dyt-2) + 0.126(dyt-3) + ut
Adj.R2 = 0.53, SER=0.0035, n=157
Where dn is the first difference in log payroll employment, dequip is the first difference in log real equipment investment, and dy is the first difference in log real GDP. All coefficients except the constant are statistically significant at the 10% MSL, using Newey-West standard errors for inference.
Assuming 2% annualized GDP growth in the first two quarters of 2007, and 07q1 real equipment and software growth equal to -2.5% y/y (equal to Deutsche Bank’s 07q1 forecast for capex ex-aircraft new orders), one obtains the following estimate for 07q1 quarterly payroll growth.
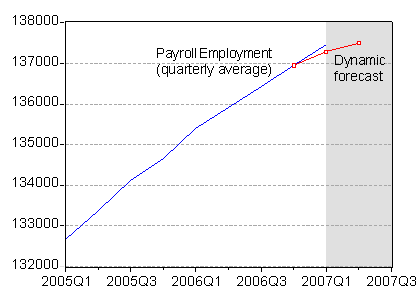
Figure 4: Payroll employment, quarterly average of monthly data (blue) and dynamic forecast beginning in 07q1 (red squares); gray shading forecast period. Sources: St. Louis Fed FRED II and author’s calculations.
This graph explains why the consensus estimates for March job creation surrounded 135,000. Using the regression estimates, something on the order of 70,000 is to be expected in the next three months (of course, contingent upon the continued shrinkage in equipment investment and 2% annualized GDP growth).
[Late addition: 1:05pm Pacific, 4/10]
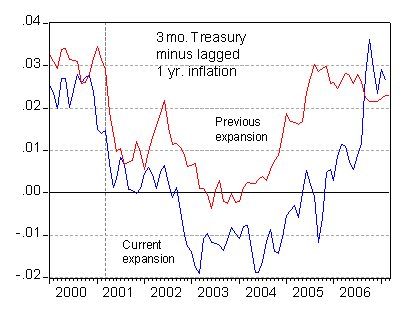
Figure 5: Three month T-bill rate, secondary market minus 12-month log difference of CPI in the current (blue) and previous expansion (red); gray dashed line denotes NBER-defined trough dates. Sources: St. Louis Fed FRED II, NBER and author’s calculations.
Technorati Tags: nonfarm payroll employment,
civilian employment, expansion, and recession
Or…this employment forecast for the next three months will be spot on if we can just forecast investment and annualised GDP.
I’m still somewhat suspicious that the March payrolls were artificially boosted (and jobless claims reduced) due to the earlier time change throwing off the seasonal adjustments. If this indeed occurred we should see jobless claims “rebound” upward after the dip in March.
This article seems to support this possibility (indirectly):
Gasoline use up 2.8% since early time change
Thanks for clarifying this daylight savings theory, super-anon.
The thing that makes me most suspicious in the payroll report is the slight rebound we saw in residential construction jobs after a consistent downward trend which is almost certain to continue going forward (given the dramatic decline in housing starts).
To me it suggests there’s some abberation in the March payroll data.
That said, I don’t think we’re at a point where businesses (outside of housing) want or need to reduce their payrolls. But I think the spillover from housing might force them to later this year.
The more I think about it the more I’m reaching the conclusion that the bounce in the employment data will show up more as weak productivity then as strong growth.
Out of curiosity, is there data for the number of retirements? That wave of baby-boomer retirements we all keep hearing about should exert more downward force on unemployment. I’m just wondering if unemployment, today, means the same thing it did twenty years ago.
Menzie-
I don’t think it behooves one to look at the data in other ways unless the robustness of the job market annoys you. I take monthly figures with a grain of salt because subsequent revisions often change the picture, but the trend has been to full employment and a strong economy (and a rapidly shrinking debt in absolute terms and relative to GDP). I take any evidence of slowing to be a natural response to the relentless Fed tightening (perhaps overtightening).
Just a few years ago, we heard much talk of the jobless recovery. I don’t hear much of that anymore.
Rich Berger: I am a naturally skeptical person. If somebody told me that the job market was unnaturally weak, I’d also want to take a closer look at the data. That is — or should be, in my opinion, in the nature of a social scientist. I’ll say that email spam or people talking loudly in public on their cell phones annoys me — but not any particular announcement regarding macro data. For me, that is just “news”.
By the way, while there is little talk of a jobless recovery, please do look at Figure 2. Hardly evidence of a rip-roaring explosion in job growth since the last trough.
c thomson: Not quite; there’s still parameter uncertainty.
spenser: Your supposition would be consistent with the stylized fact that productivity growth dips in the late phase of a business cycle — and of course the view that we are in the late stages of a business cycle upswing.
“I think it behooves us to consider other ways of looking at the data.”
This morning I posted at AngryBear another way of looking at the data. Empirically, not only are the March payroll numbers average at best, but also the recent numbers aggregate below the long term average. Detailed charts are included.
Fine analysis and thoughtful forecast, Professor.
Thanks!
JDH:
Thanks for clarifying this daylight savings theory, super-anon.
You made me laugh out loud. Thanks!
How has the relationship you regress changed over time, say run over ten-year windows? Do you know it off the top of your head, or should I go dig up the data?
When comparing 2007 to the Clinton years, don’t forget the various financial crisis that occured during the ’90s. Mexico, Russia, and the huge Asian financial crisis were ALL addressed by Alan Greenspan by printing more money.
The 1997 crisis in particular created a special set of conditions. Because the economies of Korea, Indonesia, etc. so much as imploded, commodity prices dropped significantly. I can remember buying gas for 89 cents a gallon in 1998.
So Greenspan had the ability to print money like crazy, but global economic conditions were such that inflation was non-existant. Economically speaking, this was the perfect storm, and in my opinion this loose monetary policy in a historically low inflation environment was unprecedented.
You combine that with Newt Gingrich and the Republican Congress’ inital zeal for getting spending under control, which was the direct cause of the budget surplus, and you have a set of conditions that were really unique.
This is a significantly different situation than today. Global economic growth is strong thanks to Chinese and Indian reform. Commodity prices are through the roof. Bernake has raised interest rates, and may raise them further. This, despite slowing economic growth in the US.
Even without Iraq, federal spending is out of control, and has been for 6 years.
The only saving grace is that taxes are low, but the likelihood is that they will increase significantly in the near future.
And yet, unemployment is only 4.4%. It’s quite remarkable, if you really think about it.
With everything that’s going on in the world, with gas at $2.80 a gallon, with commodity prices at levels not seen since the 1970s, with a slowing economy, why on earth would you expect unemployment to be trending lower? But it is, which goes to show how resilient this economy is, and how much of a benefit globalization has been.
wcw: I’ve tried estimating the relationship over non-overlapping 10 year periods. The adjusted R-squared never drops much below the reported one, while sometimes the coefficient on lagged equipment investment does drop in significance below the 10% MSL.
Buzzcut: I agree that the times are different. However, I think that monetary policy has been considerably more expansionary than in the previous expansion; I’ve added Figure 5 to show the three month T-bill rate minus lagged CPI inflation to show this. And there’s been a lot more fiscal stimulus this time around.
unemployment isn’t trending lower, just the hedonics of it are. The actual or real unemployment is trending higher. Just like during the 2nd half of 2000. Getting the picture yet?
Menzie,
You will get no argument from me that fiscal stimulus is much greater this time around. No doubt that during the 1990s, fiscal stimulus was in the other direction: taxes were very high, and government spending was, if not decreasing outright, then experiencing a decrease in the rate of growth.
However, to say that the unemployment rate after, say, 1997 was better than the unemployment rate today is really simplistic. Why not compare today to the 1970s. Or the 1990s to the 1960s? It’s arbitrary.
I repeat that, under the circumstances that we’re in, a 4.4% unemployment rate and a 2 to 3% inflation rate is quite remarkable.
I think that 10 years from now, we’ll look back on these years as a special time. Taxes will be much higher at that time, and as a result economic growth probably won’t be as strong (barring another Asian financial crisis).
buzzcut: I agree that it’s simplistic to examine economic performance along just one dimension — that’s why this post from last September presented lots of series so you can see how anemic this expansion has been, with the exception of corporate profits. And despite the much ballyhooed GDP growth rates, we’re not doing much better than the last expansion, as shown in Figure 1 of this post from January. All of this against a backdrop of massive monetary as well as fiscal policy.
By the way, you’ve not seen me mention the unemployment rate as an indicator. As has been pointed out elsewhere (e.g., Angry Bear), that is a function of the participation rate and demographics.
It just seems to me that you’re trying to score some cheap political points.
Just in terms of the media, the economy now is not being hyped as “good”, and certainly not in the way that it was during Clinton’s second term.
So the economy isn’t as strong as then. So what? Who said that it was?
Clinton also didn’t have terrorism as an issue (well he did, but he and everyone else ignored it). He had the dinky little Bosnain war, not the Iraq occupation.
As I said, where we are right now in terms of employment, growth, and inflation is quite remarkable. I know that it is being driven by fiscal and monetary policy, and I know that it can’t sustain itself in the long term. Spending has to come down. Taxes will increase significantly. The dollar will lose value eventuallty (won’t it?).
So let’s sit back and ENJOY OURSELVES for once, because the economy is good and the future may not be.
Buzzcut: I won’t accuse you of trying to score cheap political points if you don’t accuse me of trying to score cheap political points. I’m trying to be a social scientist. If you find something remiss with my econometric analysis, then that seems a productive thing to mention. Similarly, if you find that I have made an error in transforming the data, or characterizing historical correlations, well that too is worthy of mention.
Regarding your “times are good” characterization, you will, I think, be unamused by the following article from Bloomberg (April 11th):
As well as today’s WSJ article (sub.req.):
Menzie, in the course of human history, 4.4% unemployment, 3% growth, and 2.5% inflation are indicative of an economy to be very, very happy with. That is an objective fact. You can go through comparisons with the ’90s, or whatever, but it doesn’t change the fact that the economy is “good”.
Why aren’t those people polled happy with this economy? That is actually the more interesting question.
The fact that business investment is slowing is yet more evidence to my assertion that, moving forward, the economy will be weaker. But it doesn’t tell us how the economy is now.
Buzzcut: OK. By the way, you should take a look at this post. It’s a cautionary note about how data gets revised over time…