The selloff in the stock market last week was attributed by some to inflation worries — namely that persistent inflation means a reduction in the Fed Funds rate is less likely than the market had until recently believed.
Not being an inflation-follower, I was a little mystified by all this. Mystified, first, by the fact that market participants had believed a reduction in the Fed Funds rate was in the works; in this respect I am sympathetic to Ritholtz’s view expressed here. Puzzled, second, by the worries about accelerating inflation, notwithstanding the most recent raft of positive (for growth) indicators.
On this second point, take a look here:
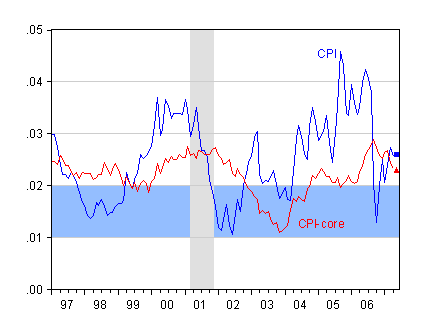
Figure 1: Twelve month inflation rates for CPI-urban all (blue) and core (red), seasonally adjusted, calculated as log-differences. Blue square and red triangle denote implied inflation rates using Bloomberg consensus for May month-on-month inflation. “Comfort zone” highlighted in blue, NBER-defined recession dates highlighted gray. Sources: St. Louis Fed FREDII, Bloomberg, and NBER.
Although both inflation series are above the “comfort zone”, headline inflation is clearly on the downtrend. On the other hand, core CPI inflation exhibits a less pronounced trend. In addition, May’s implied twelve-month change in the CPI expected by the market (or at least those participants surveyed by Bloomberg) does not suggest a rapid move toward the comfort zone. Maybe it’s just that the market expected inflation to come down faster over the next few months.
What about inflation in the rest of the world? In the other major economies of the world — the Euro area, and Japan — inflation does not appear to be a big worry (Figure 2) Two caveats: First, core CPI inflation is rising in the Euro area, and in April was close to the headline harmonized index of consumer prices twelve month inflation rate). Second, to the extent that strong growth is projected in the Euro area into the future (and that one believes in a Phillips curve — more on that in a later post), the inflation is likely to be rising rather than falling. That would necessitate further interest rate increases that would hit at equity valuations. So that much makes sense. Still, I’m not certain the Euro area is where the action is. Rather, I think the worries are centered in some of the BRICs.
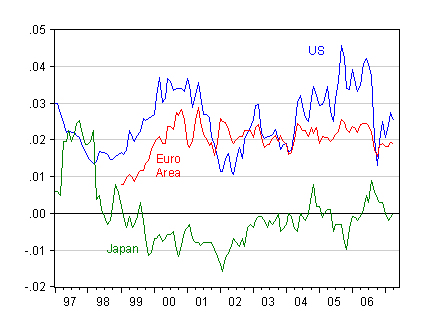
Figure 2: Twelve month inflation rates for US (blue), Euro area (red), and Japan (green), calculated as log-differences. Sources: IMF, International Financial Statistics, and author’s calculations.
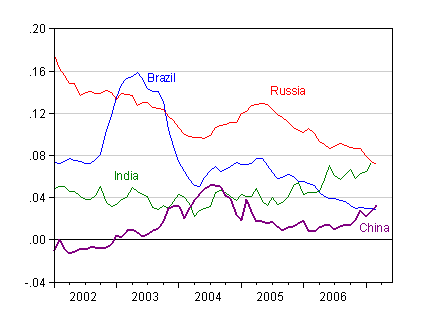
Figure 3: Twelve month inflation rates for Brazil (blue), Russia (red), India (green), and China (purple), calculated as log-differences. Sources: IMF, International Financial Statistics, and author’s calculations.
This point was highlighted by Dave Schuler in The Glitterning Eye, discussing the NYT article on rising hog prices in China. In Figure 3, measured inflation in China (and India) are rising, although admittedly from relatively low levels (China had inflation rates in excess of 25% in the mid-1990s, and Russia had a bout of hyperinflation as recently as 1999).
Why should inflation in China matter for US inflation? In a free-floating rate world, it shouldn’t directly matter. But to the extent that China manages its exchange rate relative to the US dollar, the price movements in tradables there get translated to the United States via imported goods. Now, it would be a mistake to overstate this effect. Indeed Kamin, Marazzi and Schindler (RIE, May 2006) pointed out in 2004 that the effect of decreasing prices from Chinese goods reduced import price inflation by less than one-fourth of a percentage point for industrial countries (working paper version here).
To the extent that Chinese prices start to rise, on top of the slow appreciation of the RMB (in a case of “be careful what you wish for”), this inflation-mitigating effect originating from China disappears.
So, I guess that this little excursion has clarified some of my questions. Of course, the first puzzle remains (although I’m willing to entertain the idea of wishful thinking).
By the way, after writing this post up, Jim H. pointed out to me that Dave Altig at MacroBlog shares some of my mystification. Glad to be in good company…
[Late Addition: 6/11 6:40pm Pacific]
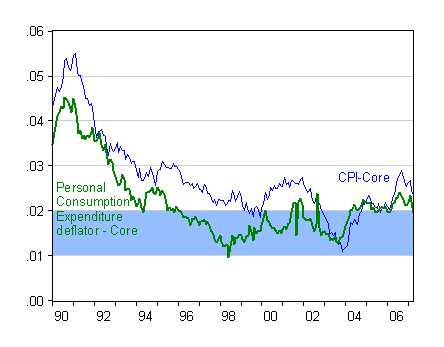
Figure 4: Twelve month inflation rates for core CPI all (blue) and core personal consumption expenditure deflator (dark green), seasonally adjusted, calculated as log-differences. “Comfort zone” highlighted in blue. Sources: St. Louis Fed FREDII.
Technorati Tags: inflation,
core inflation,
imports,
China,
BRICs.
In relation to China and inflation there was a good article in the WSJ on 6/9/07 about Robert Mundell speaking before the Asia Society.
Meanwhile, the largest portion of the increase in reserves is driven not by the trade surplus but by inward investment. “If you create money in an equilibrium situation,” he says, “the additional money makes disequilibrium, and people spend more and that involves more imports, and potentially inflation. But if you print money to fill an excess demand for money, there is no inflation that comes from that.”
By sterilizing, the central bank prevents the supply from rising fast enough to satisfy the demand, perpetuating the imbalance….
Today, the money supply in China (M2) is growing at 17%, compared to GDP growth of about 11%, yet inflation remains very low. This fact is obscured by a lot of blather about the Chinese economy “overheating.” Yet the hallmark of overheating, as Mr. Mundell observes, is an excess of demand leading to bottlenecks in many markets. If anything, China still suffers from weak domestic demand. And while there are a few isolated bottlenecks in the economy, in general there are plenty of inputs available to increase production.
Does anybody really believe that the Fed has a “confort zone” of 2%? How long have we been above that confort zone? From the graph, core CPI has been above the confort zone every year except ’02 through ’04, going back 10 years!
Clearly, 3% is the confort zone.
What I take away from this analysis is that I should assume a 3% inflation rate when doing straighline projections of my retirement savings!
Buzzcut, if the Fed was comfortable with 3% inflation, they wouldn’t have given us 0.6% real GDP growth for 2007:Q1.
JDH,
I disagree. The collapse in housing worries the hell out of the Fed. THey did not engineer a 0.6% GDP growth. It was housing that did it. The interest rates are not in restrictive territory although I will grant you they are not as stimulative as in 03-05. If the housing had not collapsed on itself, the Fed would have raised beyond where they stopped. I do think they are comfortable with 3%. we have been at or above the 1-2% on the core for 3 years+. what central bank can remain above their target for 3 years and still claim contained inflation. Our own friendly inflationary Fed.
js, the Fed has been holding tight at 5.25%, even though they correctly foresaw that economic growth would slow considerably and housing would face serious problems. There is one and only one explanation for that behavior– the Fed is not comfortable with 3% inflation.
Four years ago, the Fed was reportedly worried about deflation. I think they are trying to steer a very precise course using very imprecise tools.
JDH, I know what you’re saying, but look at the graph!
If they’re not comfortable with 3% inflation, then it is a recent conversion. What is the mean inflation rate from ’97 to ’07? Just using my calibrated eyecromiter, I’d say something well over 2%.
Buzzcut and js,
Just because inflation has run a 3% historically does not mean that the FED is uncomfortable above 2%. If they are spurred to action at 2% then it is not surprising that it would not be manifest until inflation reaches 3%. Remember that turning the economy is like turning an ocean liner. It doesn’t turn on the spot. You have to guide it in. I believe that what we are seeing right now from the FED is their reaction to inflation over 2%.
Consider what Rich wrote, imprecise tools (Rich you are more kind than I would have been!)
Now as a caveat, that doesn’t mean that what they are doing is the right thing. It does not make sense to me that attacking growth is the healthy way to manage an economy.
The CPI-U index was 206.686 in April, 2007. It was 201.8 back in October, 2006. That’s a year’s worth of inflation (2.4%) in just the last 6 months.
Unless we have NO inflation for the next 6 months, the year over year comparisons MIGHT get fairly ugly soon.
I therefore submit that your year over year inflation trend chart MIGHT not be doing the current inflationary picture much justice. Time will tell.
One more thought.
Although both inflation series are above the “comfort zone”, headline inflation is clearly on the downtrend.
When you’ve got a year’s worth of inflation (2.4%) in just the last 6 months, I would argue that the headline inflation is NOT “clearly on the downtrend”. It might be, but it is certainly not crystal clear. Last fall we saw a rather spectacular commodity selloff.
Will we get another spectacular commodity selloff this fall? Heaven help the housing market if we don’t.
DickF: While Mundell’s characterization might have been appropriate for earlier years (e.g., 2004), I’m not certain that it’s relevant for the present situation. According to the World Bank’s quarterly update (pdf), in 2006, reserve accumulation was $247 billion, the current account surplus was $250 billion, capital inflows a net -$3 billion.
Buzzcut and js: As I teach in my macro courses, monetary policy has long and variable lags. So if the Fed has a comfort zone of 1-2%, and targets a future inflation rate, it will necessarily take time to get to “revert” to the target. In addition, if one uses the core personal consumption expenditure deflator (a chain weighted index), instead of the CPI (which is a fixed base-year weights, or Laspeyres, index), one finds that the 12-month inflation rate is just at the top of the “comfort zone”. I’ve plotted this in Figure 4, added to the post.
Stagflationary Mark: I note that you’re using the not-seasonally-adjusted CPI-U series, instead of the seasonally-adjusted. The ratio (not logged) of the April to October seasonally adjusted CPI levels is 1.0208. But I take your point — in order to hit 2.4% will require very slow inflation in the next six months.
Menzie,
Thanks for the comments. Last week I was questioning why the markets should be anticipating a rise in interest rates from the Fed when the economy had softened and the only source of pricing pressure was from the energy sector.
It never occurred to me that the talk about higher rates might mean “higher than the lower rates that were expected.”
Menzie Chinn,
That’s a good point on the seasonally adjusted data. It does make six month comparisons a bit more suspect. I tend to just throw the lastest CPI-U figure into my spreadsheet and look at the big picture. Lately, the little picture (the last six months) has taken over a bit though.
For what it is worth, I owned physical gold and silver from 2004 to 2006. (The Fed literally forced me to buy hard assets, as it intended.) I’m now sitting mostly in TIPS, I-Bonds, and short-term treasuries. One could argue I’m not the stagflationist I once was, although there’s still plenty of it left in me.
Oil is back to the same price it was in parts of 2005. Gold, silver, and copper have been fairly flat for the past year. Lately though, all of these have been on a relatively upward path again in spite of a US housing slowdown.
Where does oil head next? China and India have passed the USA in automobile fatalities, for what that’s worth. We seem to send them our money. Should the trend continue without something breaking (housing perhaps), one has to wonder if and when oil production will peak.
India’s crowded roads: Death in the fast lane
Last year around 95,000 people died on the roads here, ranking India currently second only to China in terms of annual fatalities.
I have nothing against China and India wanting our standard of living. I’m just not sure the planet has the natural resources to provide it. If we don’t, that could be very inflationary long-term.
On the other hand, at least some of this feels like the inflationary effects of easy credit. What inflation giveth, deflation might once again taketh away.
Since I brought up the 6 month data vs. the 12 month data, curiosity prompted me to do some more digging.
I went back through the CPI-U index. Here’s a list of the periods when inflation (not seasonally adjusted) was running higher than the last 6 months (1.024212091).
March 2005 to September 2005: 1.029015544
April 2005 to October 2005: 1.027333677
Here’s hoping the next 6 months aren’t like 2005.
Before then you have to go all the way back to 1990 and 1991 (almost every month in 1990).
That’s sort of a red flag perhaps, since it was actually during a consumer recession. Go figure.
Stagflationary Mark,
You seem to have an understanding of the relation of gold to inflation/deflation. An analysis of the gold signal (a proprietary algorithm using a 10 year weighted average), which preceeds most inflation indicators by about 6 months, indicates that inflation will remain virtually flat for the remainder of the year.
Of course all of this depends on how bad the FED gods screw up the economy, but right now, thanks to the effect of the tax cuts, they are not doing too bad.
Mark — be very careful using 6 month NSA cpi
because there is a very strong seasonal pattern to the core cpi in a low inflation environment. Firms tend to raise prices once a years so over half the annual increase in the nsa core cpi occurs in the first quarter. This can significantly distort 6 month comparisons.
there is a second bump in the third quarter and many years nsa prices actually fall in the 4th Q.
I realize that monetary policy is a blunt tool and the lag is long. It just seems to me that, if they were really targeting 1 to 2%, Figure 1 would have a mean of 1.5%, not 2.25%.
I think that what Figure 1 is telling us is that the Fed give lip service to the 1 to 2% range, but that it fears deflation more than inflation. It is biased to the high side of that 1 to 2% range.
Buzzcut,
The monetary tools are so blunt that they are almost ineffective. Most of what they do has no effect until it effects fiscal events and by then you often have congress doing things to counter their actions.
If it were not for the tax cuts you would probably be seeing the FED “fighting” 4% – 6% inflation. Don’t get too hung up on the percentages.
DickF:
I believed that when gold and silver started to turn parabolic in 2006 we were either entering a period of hyperinflation or we were entering a period of hard asset euphoria. Since real interest rates were approaching reasonable again (and I’d been selling some precious metals for that reason anyway), I opted for the latter explanation and sold all the rest of it.
In my opinion, the only reason one would want to hold gold or silver during a deflation would be the fear of a great inflation to follow it. There are some who argue that gold will do well during a deflation, but I’m not one of them (especially if there seems to be no end in sight).
My thinking on TIPS (which hasn’t worked out as I expected, at least yet) is that real returns tend to fall when times turn tough (times don’t seem to want to turn tough). It isn’t necessarily an inflation/deflation argument. I’m just trying to ride out any potential inflationary/deflationary storm. I looked into Japan’s deflation as sort of a worst case example, and figured even TIPS will do okay if the same repeats here (Japan’s CPI only dropped about 0.5% per year even as their stock markets and housing markets crumbled). It won’t be fun, but I could be doing worse.
True deflationists have been feeling the pain for years. The combination of a rising stock market and rising long bonds is brutal to those betting on the opposite. I have a hard time being a true deflationist, especially since paper dollars are so easy to print.
spencer:
Let’s not forget the last 6 months included the Christmas season though. That has tended to be increasingly deflationary each year. While the next 6 months may not have the inflationary “price raises” you accurately suggest it also won’t have Christmas. In my opinion, the next 6 months is therefore roughly a wash.
If oil rises, gold will more than likely follow. I have a spreadsheet that tracks the relationship. If both oil and gold rise, it will be hard to be a deflationist this year. Inflation expectations are almost as important as the inflation itself. It is also possible that the long bond is predicting the lack of deflation in the next 6 months. It is getting a bit scared perhaps.
Hey, just my 2 cents adjusted for inflation. Thanks for replying! 🙂
Stagflationary Mark,
I do not recommend investing in gold at all, even in an inflation, unless you want to be a short term speculator. Over the long haul you will simply breakeven with gold.
The price of gold is almost totally controlled by what the FED does, and from one day to the next that is an unknown. There will be moments when gold gives a positive return but investing in a productive company will almost always beat gold without the risk.
The analysis of the Fed inflation series(es) is a little silly, given the increases in what I pay for under-counted but very significant areas of expenditure like hotels and health care. I think inflation concerns “on the street” reflect this kind of reality; rather than purely whatever sanitized series the goverment bureaus deign to publish.
Also beware: the recent increase in long rates will have large effects in the cost of all kinds of things financed all throughout the economy.
The next round of inflation won’t be driven by Phillip’s curve effects. It will be driven by global development and war/defense buildup debt from the US.
DickF,
The price of gold is almost totally controlled by what the FED does, and from one day to the next that is an unknown.
When the Fed pushed short-term interest rates down to 1% and left them there, it was VERY clear what the FED’s policy was. They wanted me to go out and buy something. I did.
As interest rates rose I quietly started to exit.
As the price of gold and silver turned parabolic the exit door was wide open. There was no mad dash by anyone to use it.
I’m 42 years old. I grew up middle class and retired off of investing at the age of 35. I survived the dotcom bubble relatively unscathed even though I was 80% in the market (didn’t want dotcom stocks). I generally agree with what you say. I’m a cheapskate though. Um, value investor. It was the only time in my life I’ve invested in precious metals. It might very well be the last time. Heck, even Warren Buffett bought silver once (but he claims he bought too early and sold too early).
You are right though. It was speculating. Absolutely. I looked at the 600 year silver chart. It is not a pretty picture. Downhill is the trend (as modern mining equipment extracts it at an ever increasing pace). However, the Fed gave us an incredible incentive to buy hard assets a few years ago (since they were so scared of deflation). Adjusted for inflation, silver was down a good 95% from its peak 25 years prior. I felt my downside was rather limited, especially in that environment.
I expected to simply “breakeven”, especially compared to short-term treasuries yielding less than the inflation rate. I was rewarded far in excess of that though. Go figure. I put a third of my portfolio in the metals. I did not bet the farm though, so to speak.
In fact, breaking even is plenty for me these days. I live modestly. I simply don’t wish to lose what I already have. Inflation is the #1 risk to that. That is why this particular subject is so important to me.
Regarding China, Mundell said, “And while there are a few isolated bottlenecks in the economy, in general there are plenty of inputs available to increase production.”
Mundell is wrong. China is running out of cheap labour. If not, why are wages rising 15-20% per year? Why can’t factories in Shenzhen find staff? Sure there is plenty of surplus labor in rural areas, but how many 50 or 60 year old peasant farmers are willing or qualified to work in the factories? Not many. Export prices from China are up 5.8% yoy so far this year.
China / India have been the disinflationary factors that have offset inflation in other areas such as services, healthcare, education, etc. But that tailwind is quickly becoming a headwind. Negative real interest rates in China and bottlenecks in labor are quickly pushing prices higher, and Bernanke knows it.
China wage inflation:
http://in.today.reuters.com/news/newsArticle.aspx?type=worldNews&storyID=2007-06-13T085607Z_01_NOOTR_RTRMDNC_0_India-302839-1.xml
India wage inflation:
http://www.shortnews.com/start.cfm?id=62926
HK Vol, China’s industrial production growth unexpectedly accelerated in May:
http://www.bloomberg.com/apps/news?pid=newsarchive&sid=aZCo1sUEExaY
HK Vol,
You are free to vote against China and Mundell. I am with them and right now China is doing me a whole lot of good. (For those interested chech out FXI).