From Macroeconomic Advisers, May 14:
Monthly GDP Index: March 2008
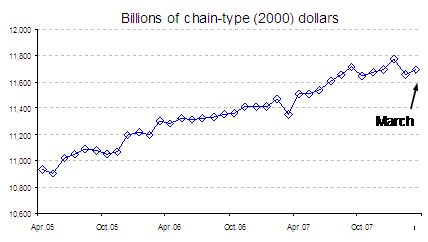
Monthly GDP rose 0.3% in March. This followed a 1.0% decline in February that was revised up from a 1.2% decline in last month’s report. The moderate increase in monthly GDP in March can largely be accounted for by positive contributions from personal consumption expenditures and domestic spending on capital goods. A large positive contribution from net exports was essentially offset by a large negative contribution from inventory investment. The level of monthly GDP in March was 0.5% below the first-quarter average at an annual rate. Our latest tracking forecast of 2.6% growth of GDP in Q2 assumes average monthly increases of 0.4% per month from April to June.
Here’s the time series plot:

Figure 1: Monthly GDP in Ch.2000$, SAAR. Source: Macroeconomic Advisers, May 14, 2008.
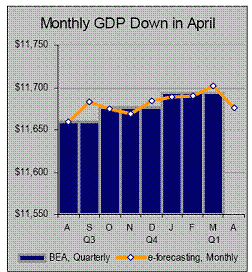
e-forecasting’s estimates provide a slightly different time profile for GDP. Although it’s not necessarily a more encouraging one, as it shows a drop in April.

Figure 2: Monthly GDP in Ch.2000$, SAAR. Source: e-forecasting.com, May 15, 2008.
From e-forecasting.com:
April Report-
April GDP Dives Down
Volume V, Issue 5B, May 15th, 2008
According to e-forecasting’s Preliminary Estimate of U.S. Monthly GDP, the nation’s output of goods and services declined in April.
Following an increase of 1.2 percent in March, the real-time monthly GDP, expressed at seasonally adjusted annual rates in chained 2000 prices, fell 2.6 percent in April to $11,675.4 billion.
Looking at the annual growth rate of monthly GDP’s three-month moving average from three months ago, the economy’s output in April increased by 0.3 percent. This growth rate is the monthly equivalent
to the publicized GDP quarterly growth rate from the preceding quarter. In reality, the growth rate of the three months ending in the last month of the quarter is identical to the quarterly growth rate.
The six-month smoothed annual growth rate of the U.S monthly real GDP, which historically has signaled the recession phases of the business cycle, recorded a positive reading of 0.6 percent in April,
after posting a positive growth rate of 1.4 percent in March. This compares to a long-term annual average growth rate of 3.3 percent during 1959-2006.
On a year-over-year basis, real monthly GDP rose by 1.8 percent in April 2008 from the same month of last year. This follows an increase of 2.2 percent in March.
How can the two have such drastically different numbers for February and March?
The e-forecasting.com numbers were generated this morning and include today’s released production statistics, yesterday’s price data and revisions of productivity. It seems that the MA series refers to numbers that are under revision.
Professor, thanks for sharing this. The Internet sure is democratizing things; it is great to be able to monitor the data that the NBER BCDC uses for its recession start/stop determinations.
Real manufacturing and trade sales peaked in October; establishment payroll peaked in December; industrial production peaked in January; real disposable personal income peaked in February.
MA GDP data peaked in January and ef GDP data peaked in March; we’ll see if these hold.
It sure is looking and feeling like a recession.
FWIW: there have been nine recessions since 1950. At recession inception, the S&P 500 P/E ratio has averaged 13.2/median 12.2.
Today, it stands at 22.1.
Maybe things are different today, and the S&P 500 rates a high P/E as we have the onset of a recession.
I am betting that things are not different (via shorting SSO) today. We’ll see!
jg,
My best thinking is
MORE LIKELY THAN NOT: “Two bubbles!! We’d better let only one deflate at a time!”
The two are here (first chart):
“Real Dow & Real Homes & Personal Saving & Debt
Burden” at
http://homepage.mac.com/ttsmyf/RD_RJShomes_PSav.html
(And last chart shows current real homes.)
**** The manipulable one is stock prices! ****
Stock market price manipulation would be ‘dirty’ — but, of what we can already see, what do we know that is ‘dirty’?
(I figure that our info-providers ‘edit’ using
importantly: “What is intellectual honesty’s cash
flow?”.)
DIRTY(1)
Real asset price histories, of compelling structure,
http://homepage.mac.com/ttsmyf/RD_RJShomes_PSav.html
are kept well-away from public attention. Deception by omission.
DIRTY(2)
The timing of the only three Fed Chair warnings of
overpriced stocks during 90+ years
http://homepage.mac.com/ttsmyf/3warnsRD.html
very strongly supports irrationality/herd behavior as the origin of the dominant historical volatility (of 3.5 decade periodicity). BUT: “What is intellectual honesty’s cash flow?” Easy call: deception by omission.
So, the CLEANEST functioning these asset markets can be doing is being ‘clean’ except for keeping the dominant long-term historical price realities
well-away from public attention! REFLECT: and how
clean is that?
MAYBE DIRTY
Now consider likelihood of stock market functioning being less clean than the preceding “‘clean’ except for” -> because of stock market price manipulation.
I provide the next following just to give the context for “IN PARTICULAR, …” below — you don’t have to believe this next following.
From SAM report, “Move Over, Adam Smith: The Visible Hand of Uncle Sam”, 8/2005, 39 pages, 119 footnotes, at
http://www.sprott.com/pdf/TheVisibleHand.pdf
“This report examines information indicating that the U.S. government has surreptitiously intervened in the American stock market. … Given the available information, we do not believe there can be any doubt that the U.S. government has intervened to support the stock market.”
IN PARTICULAR, Heller (1989) (H. Robert Heller, who three months earlier was a Federal Reserve Board Governor!!!), writing a column in The Wall Street Journal, “suggested that the central bank be empowered to stabilize plunging stock markets by purchasing stock index futures contracts.”, WHICH IMPLIES the existence of an intervention MEANS to negate LARGE-scale momentum, which surely allows the existence of an intervention MEANS to do stock market price manipulation in general.
Soooooooooo, let’s see:
big dirty that we can see already
motive
means
Does this mean that the advance release of quarterly GDP is estimated on the basis of two months? Or does it take Macroeconomic Advisors longer than the BEA to compile data for the third month?
I looked more closely at the announcement for the start of the last recession.
http://www.nber.org/cycles/november2001/
The committee tracks four variables, and based on the last six recessions, on average/median, these four variable lead recession start by as many as 3-4 mos. and lag recession start by as many as 2 mos.
Real mfg. and trade sales leads recession start by 3-4 mos. Industrial production leads recession start by 2 mos. Payroll employment lags recession start by 0-2 mos. Real disposable personal income lags recession start by 1-2 mos.
Thus, using my layman’s eye of where things have peaked for these four variables (Oct.-Feb.) and the historic lead/lags that the committee has used, it appears to me that the start date for the recession will be deemed as January. Add nine mos. for announcement (Mar. 2001 recession was announced Nov. 26), and I predict an announcement in September.
If things accelerate downhill — a real possibility given the plummeting consumer confidence and industrial production — the announcement could come in by 1-2 mos., I would guess.