The March trade release was taken as good news. Here’s some reasons to wonder a bit more about how good the news was.
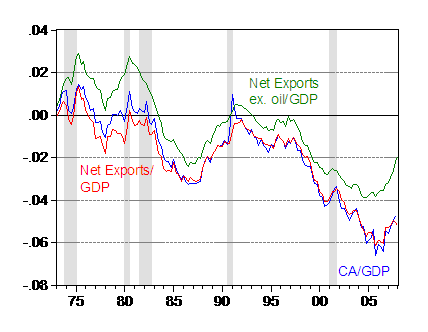
Figure 1: Current account balance (blue), net exports (red), and net exports ex-oil (green), as a ratio of GDP. NBER defined recessions shaded gray. Source: BEA GDP release of 30 April 2008, and NBER.
Commenting on Figure 1 which was included in this post, reader GK remarks:
I actually consider the first chart to be positive. Look at much the trade deficit ex-oil has improved.
Almost all of our CA deficit is due to two things – oil and China. Of this:
1) Once China’s currency creeps up to fair-market rates, and their domestic economy becomes large enough, or deficit with them will shrink.
2) It appears that Oil deficit dollars have peaked. Rising costs per barrel are being met with a corresponding fall in consumption. So the dollar imports of oil have hit a ceiling.
It seems that in the next decade, we will eliminate the ex-oil deficit, and the oil deficit may be a bit smaller than it is today. So the total will once again be under 2% of GDP.
On (1), I wonder if Chinese revaluation unaccompanied by rest-of-developing-Asia currency appreciation will effect the desired adjustment in the US trade balance. To a first approximation, the overall US current account deficit is driven by national savings minus investment, and I think these variables will only be affected by exchange rates if the exchange rate changes are broadly based. See this post for additional discussion, as well as my 2005 Council on Foreign Relations report [pdf].
Definitely, the trade balance is important. Consider the effect of net exports on overall GDP growth.
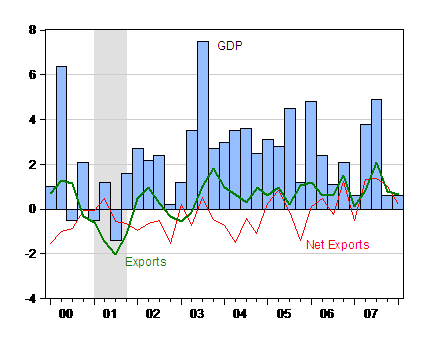
Figure 2: GDP q/q growth, SAAR (blue bars), and contributions from exports (red line) and net exports (green line). NBER-defined recessions shaded gray. Source: BEA GDP release of 30 April 2008, and NBER.
In 2007Q3 in particular, GDP growth was strongly driven by net export growth. However, starting in 2007Q4, net export growth tailed off considerably. Indeed, without the support of net exports, 2007Q4 GDP growth would have been negative, in a mechanical, accounting sense.
The fact that in 2008Q4 exports accounted for more than 100% of GDP growth implies that real import growth is such that it is subtracting from total growth.
This brings me to GK’s point (2): “…so the dollar value of imports of oil have hit a ceiling.”
Figure 3 depicts nominal (blue) and real (red) monthly imports of petroleum and petroleum products, in millions of dollars.
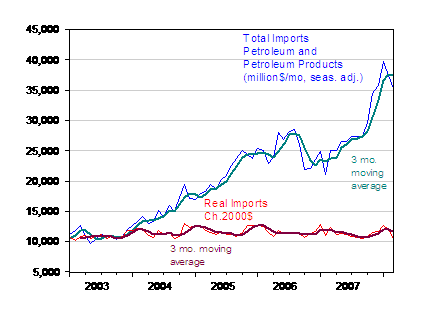
Figure 3: Nominal petroleum and petroleum product imports (blue), 3 month moving average (teal), real imports in Ch.2000$ (red), and 3 month moving average (purple), all in millions per month, seasonally adjusted. Source: BEA/Census, March trade release, 9 May 2008, and author’s calculations.
As is clear, both nominal and real series have peaked and are declining. However, the 3 month moving averages are essentially flat. In terms of real magnitudes, the cyclical factors should be resulting in a downward trend. However, working in the opposite direction is the fact that US domestic production accounts for an ever small share of US consumption.
One point that I want to make at this juncture is that, as recounted in this post citing Bertaut et al. (2008), using standard estimates of trade elasticities, and plausible trends for home and foreign growth, and the current value of the dollar, the US current account balance will resume its downward march in 2009 (see this post for a discussion). This means that given the current constellation of policies and the current value of the dollar, we should not take too much solace from the improvement in the trade balance.
As an aside, the March trade balance coming in above expectations means that GDP in 2008Q1 will tend to be revised upward. That’s because the advance release is a conditional estimate of GDP, and incorporated a guess about the March deficit [1]:
Lehman Brothers Holdings Inc. economists said the smaller- than-forecast trade gap will probably lift the estimate for first-quarter growth by as much as 1 percentage point.
“The data suggest a boost to the first quarter, but do little to alter our overall view of U.S. growth,” Drew Matus, a Lehman economist in New York, wrote in a note to clients.
On the other hand, this Forbes article presents some slightly less pronounced effects:
Stephen Gallagher at Societe Generale said “the narrower deficit for Q1 that was assumed by the Bureau of Economic Analysis in their advance Q1 GDP gives room for upside revisions. Indeed, our calculations suggest trade revisions will add 0.2% to the growth rate.”
Ian Shepherdson of High Frequency Economics thinks the impact will be even greater. ‘The trade contribution to first quarter growth will be revised up by about 0.5% points, lifting the GDP growth number to 1.1% from 0.6%, other things equal,’ he said.
But, decreasing imports reflects in part declining economic activity, so this release could be construed as news that should revise downward expectations regarding 2008Q2 growth.
The last observation I’d like to make echoes that made by Brad Setser: namely that upward pressure on the deficit will continue because of rising oil prices (see also Calculated Risk.
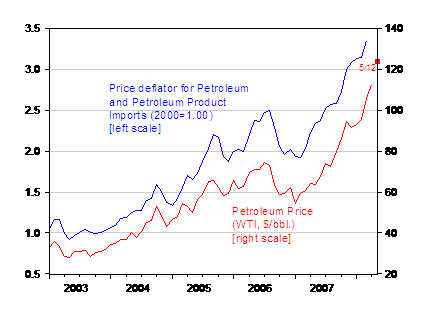
Figure 4: Price deflator for petroleum and petroleum products imports, 2000=1.0 (blue), and price per barrel of West Texas Intermediate. May 12 observation (red square). Sources: BEA/Census, March trade release, 9 May 2008, St. Louis Fed FREDII, Bloomberg accessed May 12, and author’s calculations.
Figure 4 makes clear that the petroleum and petroleum products deflator (remember, we also import gasoline and other distillates, not just barrels of oil) tracks the price of oil (here I use WTI as a proxy for world oil prices). The key point is that April oil prices were 6% higher (log terms) than March prices. This means that unless real oil imports are 6% lower, the overall oil deficit will increase. (This could happen — the average decline over the last three months has been a bit over 3% in log terms.) Looking even further forward, the May 12th price of nearly $124 per barrel suggests little respite from these high prices in the near future.
Parting shot. Goods exports look like they’re slowing — actually they’re declining.
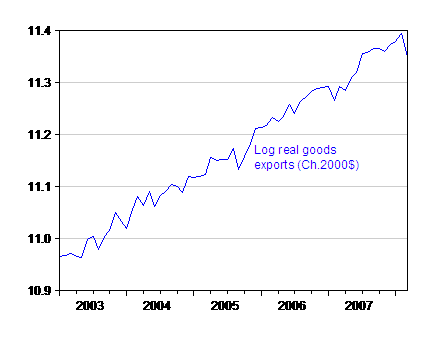
Figure 5: Real exports of goods (blue), in millions per month, seasonally adjusted. Source: BEA/Census, March trade release, 9 May 2008.
So from my perspective, we are not out of the woods yet.
Technorati Tags: current account,
net exports,
sustainability, oil imports,
oil pries.
I’m not sure I’ve ever seen economics news about the U.S. — in my lifetime, literally — that hasn’t been picked apart and made dismal. I’m getting to the point that it feels pointless to even pay attention to anything economic, it’s forever bad, dismal and dismaying. Seriously, _is_ there any point at this point? It seems nothing the U.S. can do will improve its situation for anything more than a few months, and that it is in terminal economic decline. Why not just accept that as the premise and view all things from that vantage?
Aha! I knew I had noticed something, however imperfect.
I maintain that a sharp increase (such as 6% in a month) causes an immediate rise in the trade deficit, but over time, demand destruction reduces unit demand to the extent that dollar imports of oil stay within a ceiling to some degree.
Looking at the first chart, the oil deficit seems to have not risen much from 2005 to today, despite oil prices more than doubling during that time. Slow growth only began in late 2007, so cannot account for the plateau from 2005.
At a minimum, we can admit that $120+ oil is not cause quite the catastrophe that people thought it could. Remember when everyone was scared at $70 back in 2006? Who would have bet on $120+ in 2008 still contributing to only a mild recession (which may be almost over) at best?
Menzie — at this stage, i am fairly confident that fear of appreciating against china constrains the willingness of many Asian economies to allow their currencies to appreciate, so I don’t worry too much about china appreciating and the rest of asia depreciating. The ongoing expansion of China’s exports to europe also suggests — at least to me — that the exchange rate does impact the trade balance, and ultimately (in complex ways) the savings and investment balance.
GK, once again you are not getting it. This recession has JUST BEGUN. You need to go by credit tightening and the inablity to raise more debt to GDP.
The 2nd half of 2008 will be the height of the recession.
Sandman,
I don’t agree, and the data does not support your theory.
The recession began in Dec/Jan and might be concluding in July or so (6-7 month recession). The markets, as well as the ECRI index, strongly point in this direction.
Thank you Menzie for excellent graphs and article.
Is the “Log real goods exports” label on Figure 5 correct? The units seem linear scale.
KevinM: Thanks for the compliment. Yes, they’re correct. The original units are in millions of Ch.2000$ per month, so logging results in units of e.g., 11. In other words, I did not plot the actual series on a log-scale. I logged the real exports, then plotted.
bsetser: I hope you’re right. If all of the East Asian exchange rates appreciated in real terms against the USD, that would certainly impact the US trade balance. Although, at the moment, with the oil exporting countries providing the bulk of reserve accumulation (that’s correct isn’t it?), then East Asia has lost some of its primary importance.
What will drive future U.S. trade deficits? Stated another way, what will keep up U.S. borrowing? One way I can see is if the U.S. federal government steps in to keep up the borrowing (rescuing homeowners and financial institutions, trying to keep up U.S. aggregate demand). Another is if U.S. consumers respond to the decline in their real incomes caused by sharp oil price increases by borrowing to keep up consumption.
The old drivers (appreciation in U.S. equities and in U.S. housing that made everyone feel richer) appear to have run their course.
I am pessimistic that exports can help much. Too much weight is being put on the euro area to take up the slack in declining U.S. demand. It seems to me this will hit Germany rather hard at some point.
Sandman, ’08 is just 17% into our six year (downleg) Greater Depression.
Menzie — China hasn’t released data for april, but it added $120b (adjusted for valuation) to its reported reserves in q1, and most analysts think another $40-100b was squirreled away in the state banks/ the CIC. Given that China’s trade balance is flat y/y even with a big oil shock, China is clearly accumulating a fairly significant sum of foreign assets on the back of its current account surplus — and there is quite a bit of evidence of ongoing inflows. I think it is more accurate to say that reserve growth is now concentrated in China and the oil exporters, and if oil is less than say $100 a barrel, i would put money that China will add more to its foreign assets than the oil exporters put together. at $125, well, the oil exporters win!
Can people offer any pointers good recent studies on short-term and long-term elasticities for oil prices?
I’m looking at a slightly old EERE chart:
http://www1.eere.energy.gov/office_eere/pdfs/figure2_oil_use.pdf
that describes oil use in transportation, and wishing for data about elasticities in various categories. I’ve Googled, but haven’t yet framed a search precise enough.
John Mashey: I won’t vouch for the elasticity estimates, but a survey of estimates is contained in Dermot Gately and Hillard G Huntington (2002), “The asymmetric effects of changes in price and income on energy and oil demand,” The Energy Journal 23.
Menzie Chinn: many thanks! The paper itself looks quite useful, as does the Huntington connection at Stanford. In case anyone else is interested, I found the article free online:
http://www.stanford.edu/group/EMF/publications/doc/OP50.pdf