From the minutes of the most recent meeting of the Federal Open Market Committee:
Total PCE inflation was projected to moderate from its current elevated level to between 1-1/2 percent and 2 percent in 2010, although participants stressed that this expected moderation was dependent on food and energy prices flattening out and critically on inflation expectations remaining reasonably well anchored.
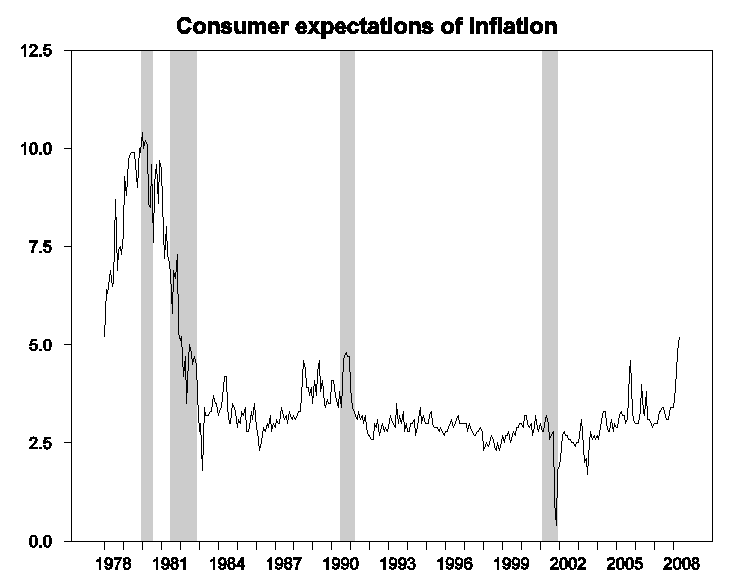
Elsewhere in the news, the latest Michigan/Reuters survey reports that the median U.S. consumer is expecting prices to rise by 5.2% over the next year. That’s the highest reported 12-month expected inflation rate since 1982.
 |
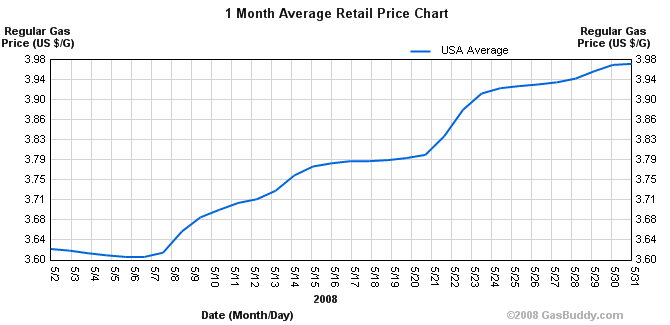
And here’s what U.S. retail gasoline prices have done in the 30 days since the FOMC meeting quoted above:
 |
Technorati Tags: macroeconomics,
Federal Reserve,
economics,
inflation
I suggest you have a chart comparing expected inflation and actual inflation. You will find that overwhelmingly expected inflation is some form of dampened function of trailing inflation.
The last observation in your chart is about the only time that expected inflation exceeded trailing inflation. Given that crude oil prices are still rising and that the seasonal adjustment dampened the last observation of trailing inflation the expectation that inflation will be higher seems fairly realistic but does not really
add any new info.
“..expected inflation exceeded trailing inflation…”
Only in these economic times can we expect to expect inflation!
So, does this portend a repeat of 1980-82?
pedantry mode: on
http://en.wikipedia.org/wiki/Anchors_Aweigh
The BLS methodologies have been tweaked, subverted and perverted so many times that it is impossible to really determine what the BLS work product output actually measures,
but one thing is for certain and that is that the cost of survival is rising far more rapidly than incomes.
Something wicked this way commeth.
Professor, what is your outlook for prices over these next 12-24 months?
Professor,
I recommend reading John Taylor’s latest thoughts, presented at a BOJ speech, especially pages 9-15.
http://www.stanford.edu/~johntayl/Mayekawa%20Lecture%20-%20Taylor.pdf
A nice counterpoint to the “inflation will moderate in the coming quarters” mantra out of the Fed.
Who knows whether the FRB actually wants to limit inflation enough to take the necessary steps, but does anybody doubt that they have the power to do it?
Jim-
Why would I rely on consumers to predict inflation? I think the average consumer is easily swayed by anecdotal evidence, rather than looking at the whole array of prices. Furthermore, it looks like there were comparable spikes in the late 80’s and about 1-2 years ago.
…Caused you to place the x-axis high enough to make the price changes seem artificially large?
James, in response to a silly comment made in response to this post re-printed at Seeking Alpha, I want to say that I appreciate your work and am grateful to get the insights of you and Menzie at such an agreeable price. Posting at Seeking Alpha is all too often an exercise in pearls/swine, alas.
jg, I haven’t tried to put together a formal estimate on this.
Thanks, Charles. It seems what they were criticizing was the lame title, which was something the editors at Seeking Alpha invented on their own.
Silas Barta, as you could verify from clicking on the link provided, I made no decision about placement of the x-axis, but simply copied and pasted exactly as presented from the original source, which in turn creates these figures with fully automated algorithms. Notwithstanding, a 10% increase in the space of one month hardly seems inconsequential by any standard.
“…(no) formal estimate…” Aw, Professor, shooting from the hip/lip is fine; lots of folks around here do that (ha, ha).
While it is common in the blogosphere to heap scorn upon the CPI, it is far less common to actually check the facts and read up on it. Few real economists, particularly those who have studied the issues, have any substantive criticisms; almost all criticisms come from the ignorant and the undereducated, or those with financial products to hawk. The CPI is complex because the world is complex; new goods, substitution between products, aging of dwellings, and so on. It changes because the world changes, or because our understanding of price index methods improves – just like the measurement instruments in physics are far better than those of twenty years ago.
There is a real danger to undermining trust in official statistics. Once that is done, all bets are off and we are left with fact-free analysis.
I like your words randy.
If CPI is an accurate measure, and it currently shows inflation a bit higher than the target but not unusually high, then what is the source of the inflation expectations in the professor’s chart?
1) Media meddling?
2) Election year political meddling?
I don’t like those reasons because they are too easy to throw around, and use neither logic nor economic principles.
I think people see the cost of gas going up everyday (frequent transactions) as negative, while they also see the price of housing going down everyday(rare transactions) as negative. Food is going up (frequent transactions), a negative, and sweatsocks from China (infrequent transactions)are holding steady. Anything involving China has to be negative.
I would like to see CPI items plotted by frequency and size of transaction plus price movement along with the professor’s expectation chart.
I wonder if people tend to set expectations by overweighing frequently purchased items or larger items?
Expectations lag. Most people don’t admit things are bad until they’re _really_ bad.
eightnine2718281828mu5 : You beat me to it.