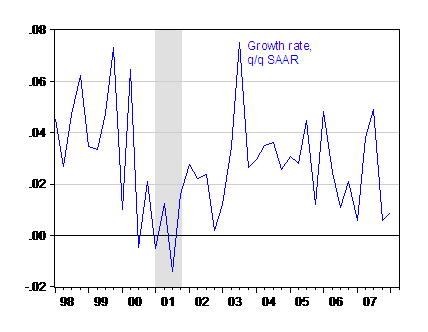
There’s been relief in many circles that GDP in 2008Q1 was revised upward. I too take this as good news, to the extent that the economy seems to be growing more rapidly — and output more balanced — than previously thought. Figure 1 depicts the q/q SAAR growth rate, using the May 2008 preliminary release.

Figure 1: Real GDP (Ch.2000$, SAAR), annualized quarter-on-quarter growth rates, from May 2008 release. NBER defined recession highlighted gray. Source: BEA via FRED II, NBER, and author’s calculations.
Several commentators have interpreted this upward revision as a sign that we are safe from recession (Fundmastery Blog, NewsBusters, Samurai Trader, and Business Law Prof Blog). I particularly like this line from Carpe Diem:
Bottom Line: With GDP growth of almost 1% in the first quarter, there is almost 0 probability that the NBER could determine that the U.S. economy was in recession in 2008, at least not during the first quarter.
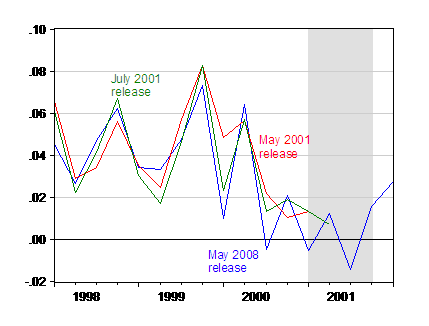
I’d like to remind readers that GDP is a series subject to a lot of revisions (and in any case, NBER looks at a lot of other series). To that end, I depict below what we thought GDP was doing at the end of May 2001 [1], [2].

Figure 2: Real GDP (Ch.2000$, SAAR), annualized quarter-on-quarter growth rates from May 2008 release (blue), from May 2001 release (red), from July 2001 release (green). NBER defined recession highlighted gray. Source: BEA via FRED II, ALFRED, NBER, and author’s calculations.
Note that even at the end of July 2001, we still thought 2001Q1 growth was positive, and thought the same of 2001Q2 as well… So I’m more in agreement with Jeff Frankel than with Carpe Diem.
The reason why many suspected a QI turning point in the first place is employment, which is virtually as important an indicator to the NBER BCDC as is GDP. Jobs have been lost each month since January. Total hours worked is my personal favorite, because in addition to employment it captures the length of the workweek, which firms tend to cut before they lay off workers. …
One final remark about the 2008Q1 preliminary release: note that a big boost to GDP came from the switch of the import contribution to growth from -0.44 ppts to 0.46 ppts, as imports declined. Conditional upon all other information about the other spending components in the current quarter, this means growth is higher, mechanically. But decreasing imports can be a harbinger of either expenditure switching or slowing overall economic growth.
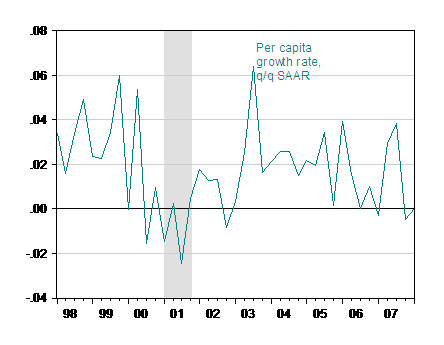
[Late addition: 1PM Pacific] Here is another take on where the economy is going — that is output adjusted by population (total, including armed forces overseas):

Figure 3: Real GDP (Ch.2000$, SAAR) per capita, annualized quarter-on-quarter growth rates, from May 2008 release. NBER defined recession highlighted gray. Source: BEA via FRED II and Census via FRED II, NBER, and author’s calculations.
Those are large revisions, ca. 2 points of GDP in 2 quarters.
Ironically, smoothing the data, one might well not end up with negative growth at all.
It is very nice to show current versions and stop in July. For those who do not know further readings and their revisions it seems that there is a strong indication of the possibility of current inflation. However, it would be very helpful to present revisions to other Q in 2001 which demonstrate opposite corrections. If to apply them in the same way one could obtain much higher value for 2008Q1, not lower.
Nice review, Professor, of the how things looked backed in the spring and summer of 2001.
The GDP data is confusing to me, with the moves in exports and inventory, etc.
Looking at the series that the NBER BCDC tracks makes things much clearer to me: one be one, they have peaked over Oct. ’07-Mar. ’08. I expect that the series will continue moving down, as the huge household debt overhang slowly strangles consumption.
Professor, any comments on the BED Q3 07 release of one week ago?
jg: Yes, the other indicators that BCDC looks at do appear to have peaked already. On the BED 2007Q3 release, all I’ll say is that it’s indeed troubling that the nonfarm payroll employment series indicates a 212 thousand net increase in jobs over the same time period the BED (which is thought to be more accurate) indicates a decline in private sector employment by 235 thousand. I don’t think the difference can be accounted for by government employment, but I might be wrong.
Correction:
in my post “inflation” is actually “recession”
No comments on the 1q08 deflator?
There’s are lots of tin-foil hats out there that try to conjure up BLS conspiracies. However, on the opposite side of the spectrum, mainstream economists regularly analyze economic releases without questioning glaring discrepancies.
Does the CPI data series have integrity after numerous methodological changes? No matter, one should still run regressions on the series. How does Birth/Death job creation now compare to previous slowdowns? Doesn’t matter — the issue can be safely ignored.
Menzie, it would be great if at least the economics profession gave us a rationale for why, despite their flaws, the analysis of these numbers still has significance. Until then, one suspects that this is the thinking: “we either work with the data we have, or we don’t work; therefore the conclusions are the best we can come up with, so let’s not question them.”
The United States Dollar’s Quantum Valuation Pattern
Relative to other leading economic nations, America’s governments, corporations, and citizens have borrowed proportionally more. Under this primary GNP growth through debt pushing on the proverbial string parameter and to a correlative and accompanying measure – under the conditions of inappropriately low interest rates and imprudent lending terms which fueled that borrowing – the US dollar has fallen – in a relatively precise fractal manner – against a basket summation of other leading currencies. While the dollar has fallen nearly 50 percent against basket currencies in the last 12/30/24/18 :: x/2.5x/2x/1.5x months, it has fallen to less than 15 percent below its lows from 1987 to 1994. The world requires inflation of all currencies for growth in order to service debt and population growth. in spite of the 2 percent US interbank lending rates and US treasury rates which directly foster malinvestment speculation in stocks and commodities, the latter of which is killing the pay check to pay check surviving middle class, a necessary saturation curve mathematical fractal correction of the US dollar to the summation basket fiats is now and will occur.
I agree, Professor, troubling indeed, that big a swing in employment.
Using the Nov. ’07 and Aug. ’07 CES to get the most up-to-date reads on government employment in Sep. ’07 and Jun. ’07 shows a growth in government jobs of 46K in Q3 ’07.
http://www.bls.gov/news.release/archives/empsit_12072007.pdf
http://www.bls.gov/news.release/archives/empsit_09072007.pdf
46K increase in government jobs per CES, 235K decrease in private sector jobs per BED = 189K decrease per BED/CES vs. 212K increase per CES, an overestimation of 401K. Troubling indeed, I agree, Professor.
I maintain that recession began in December, and barring a further Oil spike, will end in June or July. 6-7 months total, and it is almost over at this point.