Messages from the August Trade Release and the September Import/Export Price release.
First, the trade deficit as a share of GDP is shrinking…as long as one excludes oil.
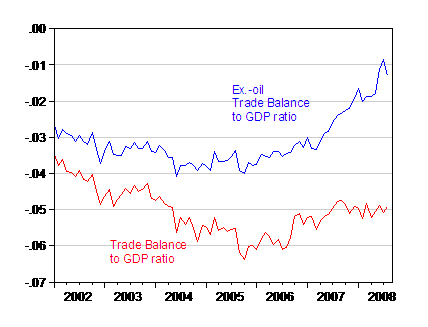
Figure 1: Trade balance to GDP ratio (red) and trade balance to GDP ratio ex.-oil imports (blue). Source: BEA/Census, Macroeconomic Advisers and author’s calculations.
Presumably, the total deficit will decline as oil prices fall. That is, as long as exports continue to grow sufficiently rapidly.
Second, what matters to GDP growth is the trends in real exports and real imports.
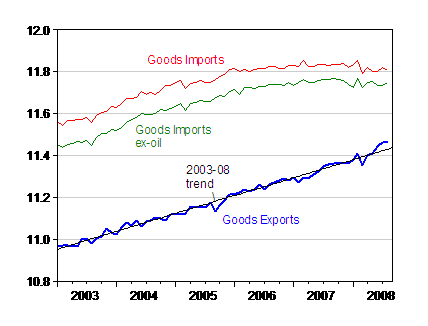
Figure 2: Log real goods exports (blue), log real goods imports (red) and log real goods imports ex.-oil (green). Source: BEA/Census.
Real (goods) imports do continue to shrink, both including and excluding oil. On the other hand, real exports — while above 2003-08 trend — are no longer growing. Of course, it could be that export growth will resume (and in addition recall here that service exports are not included). The IMF’s prognosis for Europe and to a lesser extent the emerging markets does not provide much basis for believing in a resurgence in real export growth such as has occurred in the past year and half [1], [2].
Finally, note that import and export prices are falling into September. In particular, the sharp decline in both goods and goods ex-oil import prices will mean less inflationary pressure being imported from abroad (if people were still worrying about that).
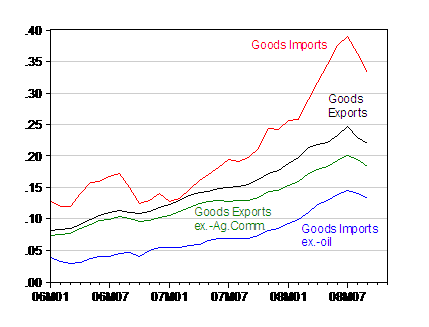
Figure 3: Log price index for goods exports (black), goods exports ex.-agricultural commodities (green), goods imports (red) and goods imports ex.-oil (blue). Source: BLS.
Furthermore, the net barter terms of trade (the ratio of export to import prices) has sharply reversed course, a phenomenon primarily driven by declining oil prices.
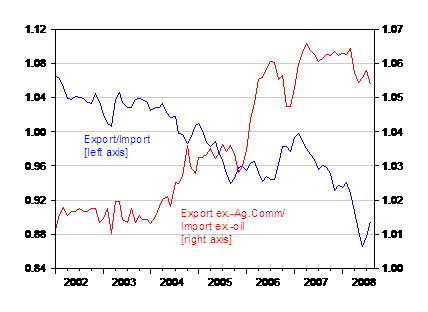
Figure 4: Ratio of price index for goods exports to goods imports (blue, left axis), goods exports ex.-agricultural commodities to goods imports ex.-oil (red, right axis). Source: BLS and author’s calculations.
This is good news, in so far as it means that each unit of exports gets more units of imports. (The deterioration is continuing if one measures import prices excluding oil.)
Technorati Tags: exports, imports,
trade balance, terms of trade,
and GDP.
The Export boom is over for now. October will be a fullscale crash in them.
A dumb question, but how exactly do you define the xOil trade balance? Just wondering because the measure I looked at, Non-Petrol Trade Balance, worsened from -18.4 to -23.5 (Nominal $ Billions).
Sam: Actually an excellent question. In August, the non-oil balance deteriorated — what I was referring to was the trend as shown in Figure 1. I should have been more explicit. I should also note that I have been just dropping out oil imports and not adjusting for oil exports, which are minor for the US.
In June the real Trade balance improved from
Apr…-40149
may…-40926
june..-38992
this implies that in the third quarter real GDP
will again be a significant positive even if it is not as large as it was in the second quarter.
Quick question Menzie, I’m sure you’ve been asked this before, but are you using the monthly series of the trade balance? And if so, how do you adjust that to percent of GDP since GDP is a quarterly series?
Al: You’ll see in the notes to the figure that I’ve used the Macroeconomic Advisers’ monthly estimate of GDP.