All eyes have been on the housing market as the trigger for the financial crisis, but we’re all aware that there are other potential “triggers” for additional distress: auto loans and credit cards. In addition, spreads are not everything — levels of real interest rates matter as well.
Let’s start with credit spreads. Here are some pictures, courtesy of Deutsche Bank.
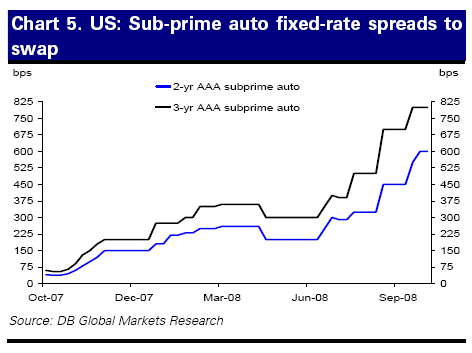
Chart 5 from Mayer, Hooper, Slok and Wall, “From financial crisis to
economic crisis?” Global Economic Perspectives (October 15, 2008).
Chart 6 from Mayer, Hooper, Slok and Wall, “From financial crisis to
economic crisis?” Global Economic Perspectives (October 15, 2008).
These graphs remind us (or at least me, since readers are probably well aware of this already) that subprime is not just in housing [0]. And that perceived risk is rising in these markets as well. While these markets need not follow the path of housing subprime, it strikes me the that a sharp downturn will tend to widen these spreads, holding all else constant.
At this juncture, I want to switch gears. At a presentation I gave recently, one audience member asked what constituted lax monetary policy. I think that’s a relatively easy question to answer when market conditions are normal (so that the interest rates that firms borrow at are linked in a stable fashion to the the policy rate): it’s when the the policy rate is less than that indicated by some real-time data based Taylor rule. (Admittedly, if one believes monetary policy should target asset prices, then it’s all a lot less clear (e.g., [1]).)
But conditions are not, by any means, normal. And it turns out that many interest rates — on variable rate mortgages, HELOCs, etc., are linked to dollar Libor [2]. That prompted me to see what real Libor looked like. Here’s the picture.
Figure 1: Three month dollar Libor minus lagged 12 month inflation (calculated using headline CPI). 12 month inflation for Sep (Oct) assumed to be 5.2%(5%). Source: IMF International Financial Statistics, Economagic, Bloomberg, and BLS via St. Louis Fed FRED II.
Updated graph incorporating September CPI release and Libor for 16 October. (10/16 6:30am Pacific)
Figure 1 (rev): Three month dollar Libor minus lagged 12 month inflation (calculated using headline CPI). 12 month inflation for Oct assumed to be 5%. Source: IMF International Financial Statistics, Economagic, Bloomberg, and BLS via St. Louis Fed FRED II.
This is a These are pretty sobering pictures. Despite the repeated cuts in the policy rate, the (real) interest rate relevant for a lot of the economy is about the same as that in December 2007 January 2008 [thx to GNP for correction] (with the usual caveats that the ex post lagged 12 month interest rate is probably a poor proxy for the future expected 3 month inflation rate).
For more on Libor, see Odd Numbers and Mish. Also Calculated Risk‘s compendium of credit indicators.
For a post soon to come, emerging market spreads…
[Update 10/17 4:10pm Pacific]
Figure 2: Three month dollar Libor minus lagged 12 month inflation (calculated using headline CPI). 12 month inflation for Oct assumed to be 5%. NBER-defined recession dates shaded gray. Source: IMF International Financial Statistics, Economagic, Bloomberg, BLS via St. Louis Fed FRED II, and NBER.
Technorati Tags: recession, credit spreads,
subprime, credit cards, Libor, real interest rate, monetary policy,
and auto loans.
Menzie
Could you please clarify what lag length you are using in figure 1, and also why use a lag?
thanks
I’m confused.
08M07 indicates July 2008, correct? And so figure 1 is current to October 2008 with guesses as to what inflation might be.
Yet the current inflation-adjusted LIBOR rate is a whopping negative -2%? How does that square with the real interest rate (LIBOR in this case) being the same as it was in December 2007?
I would be inclined to use a lower guess for September and October headline CPI y/y inflation rates simply because commodity prices are falling off a cliff. 2% or 3%.
As presented, I’m not sure why the picture is a “pretty sobering picture”. Strikes me that declining nominal LIBOR rates are cause for measured optimism.
GWG: Define π t = [(Pt/Pt-12)-1]x100. Then the calculation is Libor t – π t. The desired calculation (i.e., of ex ante real interest rates), would be Libor t – π e t, where π e t is the expected inflation for the next three months based on time t information.
I do this because expected inflation over the next three months is unobserved. Hence, I am assuming the inflation rate expected over the next three months equals the observed inflation rate over the previous 12 months.
GNP: I’ve just revised the graph — see Figure 1 (rev), to accommodate the CPI release. Instead of the assumed 5.2%, y/y inflation came in at 5%, pushing up the real rate in September.
I agree declining Libor is a very good thing. But thus far the 3 month (as opposed to overnight) dollar Libor has declined only 32 bps vis a vis that on October 10.
I’m not certain I understand your last point, though. Take your assumption of 3% y/y inflation (pretty hard to get, I think), or assume expected three month annualized inflation is 3% in October. This means ex ante real interest rates are even higher. If one is hoping for stimulus from lower interest rates, this is not good. That’s what I mean by sobering.
Menzie: Thank you for the clarifications.
I agree with you that ex ante real rates may be even higher as agents anticipate lower inflation going forward. Not sure that has much significance for 3-month loans though I can see that influencing longer-term consumer and business loans.
Back to the important source of confusion for me: If I look straight up from 07M12 in Fig.1 (rev), I get a real 3-month LIBOR rate of +0.5%. The negative real rate of -1.8% (or thereabouts) strikes me as much lower. What am I missing? Is that not significantly different?
Moreover, if an estimated real 3-month LIBOR rate of -1.8% is insufficiently low, how low should it to go? (Assuming monetary policy can actually fine tune these things.)
GNP: You’ve taught me a lesson — look at the data series instead of the graph, and relying upon my aging eyes (well, they’ve never been great) to tell me what a vertical line is. You’re right, 07M12 real Libor is positive — I was reading 08M01 real interest rates. Then real Libor is higher than that observation (I’ll make a fix in the text).
I agree -1.8% real Libor in September is stimulative. What I’m concerned about is the October 16 observation which is -0.5% if I use 5% inflation, and +1.5% if I use your guess of 3%.
Menzie Chen: Happy to be of service. Lord knows the cognitive mistakes I make when working on the fly.
In passing, I wonder if yield curves that integrate the LIBOR interest rate would be more useful indicators of capital market conditions?
I found a slightly longer chart of the 3-month LIBOR rate but apparently cannot post it. The Last Reported Rate is: 4.05250%.
http://www.moneycafe.com/library/ratecharts/ratecharts12.gif
Source and notes: http://www.moneycafe.com/library/3mlibor.htm
Real 3-month LIBOR rates were negative between 2002 and 2004.
GNP: I’ve added the longer term graph; same calculations as in Figure 1. One caveat I would add is that right now, transactions at the three month horizon are probably pretty thin, so in a sense, the observations might not be comparable over time. Somebody else (with more time) might want to get the overnight rate and adjust by some measure of short horizon expected inflation.