…probably confirms one’s priors.

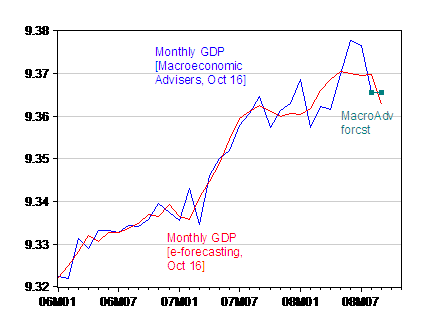
Figure 1: Log monthly log GDP (Ch.2000$), Macroeconomic Advisers release of 16 October (blue), MA forecast (teal square), and e-forecasting release of 16 October (maroon). Source: Macroeconomic Advisers [xls], and e-forecasting release of 16 Oct.
agreed
I agree also, but I wonder how much new information is really contained in the monthly GDP estimates. I assume that MA and e-forecasting just use data on consumption spending and other variables that have already been released to come up with a monthly GDP estimate.
GWG: The way I think about it is that the two GDP indicators constitutes weighted averages of the individual indicators. The weights are selected to track actual GDP reported by BEA. So in this sense, if you’re interested in where GDP is going, these indices save you the trouble of collecting the data in real time and running the regressions yourself.
I don’t know how to read this graph. Can someone tell me what US GDP is expected to be according to this graph?
I second Joe H.’s question. Help, please?
Joe H. and Rover: Look at each series, and note the corresponding number on the vertical axis. Then take the anti-log (in base e) of that number. That gives you the number (in billions of Ch2000$, SAAR). Alternatively, click on links in the notes to the figure, and you’ll be able to download the relevant spreadsheet or announcement.
GWG Wrote: I agree also, but I wonder how much new information is really contained in the monthly GDP estimates. I assume that MA and e-forecasting just use data on consumption spending and other variables that have already been released to come up with a monthly GDP estimate.
—————–
GDP is measured by two approaches that in theory have to produce identical numbers. The expenditure approach calculates GDP as the sum of the components such as consumption, investment and so on. The second approach measures GDP based on the supply side of the economy, that is the income generated by the production. e-forecasting is using the supply side approach in the monthly calculations of US GDP. Yesterday’s preliminary estimate by e-forecasting used revised and more complete data on production, productivity and income than the flash estimate published two weeks ago.
Aruoba, Diebold and Scotti (2008) “Real-Time Measurement of Business Conditions” (http://www.econ.umd.edu/~aruoba/research/paper13/paper13.html) describe a high-frequency measure of GDP that they are currently estimating at a weekly frequency. Borogan Aruoba provides updated estimates on his web site at http://www.econ.umd.edu/~aruoba/ADS_current.htm. The latest updates as I write this are October 4th. They show a drop in GDP that is already very nearly equal to the peak-to-trough drop experienced in the 2001 recession.
Don’t know when Borogan is planning to do another update. Dean Croushore, acting director of Philadelphia FRB’s Real-Time Data Research Center says that they will start hosting and posting regular updates of this indicator in the next month or so.
GDP, using expenditure income and production approach, needs special attention. it must be equal what ever the apptoachs used
monthly GDP estimates
I appriciate this because the data used to estimate GDP per month is too difficult to grasp