In today’s Economix post, Casey Mulligan argues that the greater than predicted unemployment numbers should not be ascribed to the negative effect of the stimulus, but rather to bigger than anticipated negative shocks.
We cannot blame the Obama administration for failing to predict June’s 9.5 percent unemployment rate. That result just shows the size of the shocks hitting the economy: Even the best forecasters can miss the unemployment rate by almost two percentage points, even when forecasting fewer than six months ahead.
That makes sense, and is in line with my previous post. But he then argues that since we’ve seen little stimulus effect so far, we should cancel the stimulus, since it’d be costly on a per-job basis (and in any case, he believes the effect on GDP to be small [1]). These are interesting assertions meriting further analysis.
Stock-Flow Mismatch
We’re all free to use whatever multipliers we want (although I like to look at ranges, in order to safeguard against prejudices) in making our arguments. But one thing we shouldn’t do is confuse stocks and flows. Professor Mulligan writes:
“The Obama administration had said that the stimulus bill would “save or create” 3.5 million jobs while adding $787 billion to the federal budget. Admittedly, some of this money went to taxpayers and to some worthwhile public works, but it also created additional economic burdens in the process of collecting the taxes and issuing the debt to pay for it. To an order of magnitude, the promise of those 3.5 million jobs cost a quarter of a million dollars per job promised.”
Note that $787 is spent over several years (a flow). 3.5 million jobs is a stock. But wouldn’t we want to incorporate how long those jobs would be around? That suggests we should use job-years instead of jobs, to make the numerator and denominator comparable. The Administration estimated the number at 6.8 million [2]. That works out to a cost per job-year of $116 thousand.
From my perspective, I view the appeal to the number of jobs created and saved alone as an inadequate approach. Rather, I think the concept of focusing on output makes more sense, as it incorporates indirectly how much income goes along with that employment. And GDP incorporates the returns to land and capital, as well. Furthermore, to the extent that economic activity is above what would obtain without the stimulus, then asset prices (think houses, plant and equipment, etc.) are above what they otherwise would be. Focusing on jobs, even job-years, or even output, omits these factors. On the other side, of course, one accumulates debt, and in the absence of slack, induces crowding out. Those potential effects should also be acknowledged (and are incorporated in the simulations conducted by CBO, IMF, etc.)
Sectoral Stimulus Mismatch
I do wonder about Professor Mulligan’s assertions that the effect of stimulus spending will be limited due to absence of slack resources in targeted sectors. In particular, he has argued that stimulus spending directed to health care will have little multiplier impact since unemployment in that sector is low. However, the most recent Employment Situation reveals for June 2009, unemployment in health services was 5.2 percent, compared to 3.1 percent in June 2008. As an aside, while Professor Mulligan didn’t mention education services, I’ll observe that a lot of spending in the stimulus bill went either directly or indirectly (via transfers to the states) in support of education. Unemployment rates in June 2009 were 9.8 percent, compared to 4.8 in June 2008…I think some slack exists even in these sectors doing relatively well.
Construction Crowding Out
By the way, Professor Mulligan argues that the presence of offsetting cycles in residential and nonresidential construction suggests that the spending now occurring in nonresidential construction will result in crowding out of residential spending. This is a quite interesting approach to the question of crowding out, although not, in my opinion, the natural way. It seems to me one would want to examine the cross correlation of private and public construction. It turns out that the Census Bureau reports these numbers here. The resulting graph is below:
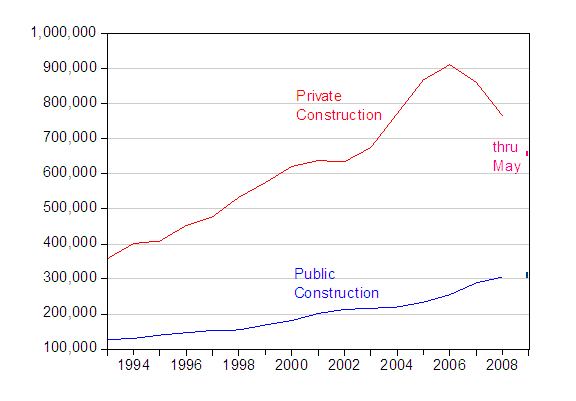
Figure 1: Public construction (blue) and private construction (red), in millions of dollars. Data for 2009 is Jan-May, annualized. Source: Bureau of Census.
A Granger causality test on first difference of each series (2 lags) fails to reject the null hypothesis that public construction does not cause private construction, at the 5% msl. On the other hand, the test rejects the null that private construction does not cause public construction at the nearly 1% msl. This is hardly a formal test, and I suspect that this conclusion could be overturned by different specifications. However, the main point is the evidence for crowding out is hardly overwhelming.
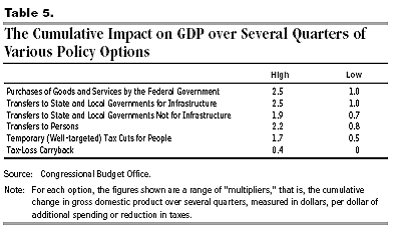
Output Multipliers
So, in my opinion, let’s return to output multipliers in our discusion of fiscal policy efficacy (timing has been dealt elsewhere [2] [3], [4]). Professor Mulligan is free to use whatever multipliers he believes in. I’ll rely upon a range, and here’s the range the CBO uses.
Technorati Tags: Casey Mulligan, recession,
stimulus, crowding out.
Ahhh the idea of causality. People try to show one thing causes another in an observational study as is proposed here. It is widely known that causality can only be shown in an experimental framework where randomization has been used. This is used to ensure any lurking variables do not exist. While the granger causality can be useful, other lurking variables could be in play that are unaccounted for. For example, the famous shoe size and reading ability in children example. Shoe size does predict the reading ability in children quite well. However, it is not the shoe size nor the growth the causes reading ability to improve. It is the education that the child undertakes while growing.
My point is that using Granger causality shows that something is a good predictor not that it actually causes the effect observed. I would be wary of the use of the test in any case.
In terms of using a range of multipliers, shouldn’t you really use a distribution that incorporates the range as well as the likelihood of each value in the range? I think both arguments are flawed.
I personally think the direction of the arguement goes the other way. Private construction leads to more public construction. Build a new neighborhood and the road traffic increases in the area so the public construction to widen the road commences. Not we widen the road so that a new neighborhood will be built.
I did click through the Elmendorf testimony, at least, and scanned that.
My problem with multipliers is that this recession is unique relative to others over the last 30 years. So, I conclude that a constraint suddenly appeared sooner than the economy expected. I suspect energy constraints.
So, I am looking for stimulus activity that directly addresses the constraint. These would have very high multipliers. Constraint distortion cause multiplier distortion today relative to multipliers measured in the past.
Under the assumption that we are energy constrained, I look for multipliers around the world where more intelligent use and design of public transit yields very high gains in oil efficiency. I find that in Columbia and Brazil where redesign of bus systems to better match commuter flows can result in a 50% or more decrease in energy use per commuter, a very high multiplier, much high than reported by the CBO presentation.
Stimulus which targeted the unconstrained sectors should just compound the constrained resource.
Ed: See my caveats regarding the use of Granger causality here. I’d assumed my readers knew the shortcomings already, but thanks for the reminder. I have elsewhere cited sources for testing for weak exogeneity, etc. (see Ericsson and Hendry (1995?)). although these do not necessarily conform to systems exogeneity.
Regarding a distribution of multipliers, well, somewhere out there there’s probably a meta-analysis, but I don’t know of it. Do you?
Mattyoung: I don’t dispute your argument, but I think you’re using the term “multiplier” in a different sense than I am.
Ed, good comment about the fact that in economic time series, we are not conducting true experiments and statistical results rely on many assumptions. That said, menzie should not be required to put a black box warning label with each post.
Kudos to econbrowser for the mention in the WSJ:
http://online.wsj.com/article/SB10001424052970203739404574288793998936838.html
Econbrowser
http://www.econbrowser.com
Originality: 5 light bulbs
Geekiness: 5 calculators
Readability: 3 reading glasses
For his day job at the University of Calif.-San Diego, economist James Hamilton works on the sorts of statistical problems that can leave even other trained economists confused. On Econbrowser, the blog he started in 2005, he (mostly) puts his insights on the economy into plain English. With a keen interest in energy markets, he was early with analysis of how a rapidly developing world and slowing oil production was pushing energy prices higher, and how those prices were affecting the economy. With his co-blogger, University of Wisconsin economist Menzie Chin, he’s been delving into thorny macroeconomic questions and offering detailed, but understandable, explanations of how the Federal Reserve’s unconventional policy shifts work.
Quibble: Usually Messrs. Hamilton and Chin keep the wonk factor down, but not always. One recent post made the point that “dY = (1/Ä){[((Yññi+Yi))m/Di )+YññR]dR + YññZdZ}.”
Do you believe the government can create/save job-years for an average price of only $116k? How does one measure? My hunch says the government is less efficient.
The crowding out that matters is the sopping up of liquidity when the government sells Treasuries domestically. Which is masked by the Fed injecting newly created money into the financial sector. Which is a process of transferring wealth to the financial sector from the rest of the economy. Hence big G&S profits, rising unemployment.
Any prediction that comes out of any administration is going to be very Rosey. Our deficits will be bigger, unemployment higher and the positive effects of the stimulus are going to be lower.
I would like to see the calculation of $GDP added per $ of stimulus spending. I think it is a more valid measure of the benefit-cost of the stimulus than $ stimulus per job. Seems like you could take the difference between GDP with and without stimulus (as presented by Elmendorf) to come up with that figure. But I’ve only seen the graph, not the numbers behind the graph.
After WWII the Keynesians were warning of the dire consequences of high unemployment and economic stagnation unless there was massive government spending. But congress was not buying it. The headline of the NYTimes on November 12, 1945 was “BILL TO CUT TAXES BY $5,920,000,000 GOES TO PRESIDENT.” Truman signed the bill. Then in 1946 the Republicans won congress on a tax reduction platform. Rep(R) Robert Taft introduced and passed a $6 billion tax reduction but Truman vetoed the bill not because of his party but because of the advice of the Keynesian economists.
In 1948 Taft again submitted a $6 billion tax cut and this time Truman’s veto was over ridden.
While the Keynesians were still attempting to put their spending plans together the tax cuts allowed the economy to recover. The Keynesians were totally embarrassed because none of their predictions came true.
Now jump forward to January 2009. Unemployment is 7.6% but the Obama administration is telling us that Keynesian stimulus will keep unemployment below 8%. They were wrong and as a matter of fact the president has admitted that it will go to 10% but even that number is too low with all of the Keynesian stimulus out there.
It was supply side tax cuts that pulled us out of the Great Depression in the late 1940s not WWII. If you take the unemployment rate plus the number of soldiers sent to fight the war you you will see that we were in the high double digits throughout the entire war. Output is said to have recovered but if you back out war spending from output incomes were lower than any time during the Great Depression.
What we are seeing now is the real results of the poison that the Keynesians were attempting to feed the country after WWII. The Obama administration is pushing us deeper and deeper into the prohibitive range of the Laffer curve and the tax increases intended to pay for Obama’s initiatives will not pay for the increased cost, as a matter of fact the Laffer curve effects will lower total tax revenue. We are getting a double whammy increased costs and lower tax revenue! Not to mention reduced services.
“Do you believe the government can create/save job-years for an average price of only $116k?”
Well, the average wage in the USA is $42,000, says the BLS.
So the government certainly could have given unemployed people (100% perfect targeting!) $42,000 per year for 6.8 million work years at a price of only to $286 billion, leaving a good $501 billion left over to bid up land values or whatever else it wanted to do. And it could’ve been done right away immediately, no lag! No wait until 2011 to take effect.
Of course transfers like that aren’t counted in GDP, so that would be deemed a failure in “GDP boost” regard.
OTOH, as per the olde Keynesian example, if the govt hired the unemployed for 6.8 million work years at $42k per, to dig holes then fill them in or whatever, that would be counted in GDP increasing it. Success!
The same number of jobs created much faster at only just over one-third the price with 100% efficient targeting and half a trillion dollars left over for other good stimulating things. Who could argue?
Jim Glass,
Your post makes it clear that the government stimulus plan is not about economic recovery. It is about the accumulation of power.
Jim- You made the correct connection … economists at times play more politics than economics
I think the crowding-out isn’t supposed to be so direct. I thought the problem was that government borrowing keeps interest rates from falling as they should, delaying a real recovery.