Sunday’s NYT had a great interactive graphics by Amanda Cox detailing the dynamics of recessions and recoveries. One interesting graph pertained to the OECD Leading Indicators:
Slide 9 from Amanda Cox, “Metrics: Turning a Corner?” NYT, July 5, 2009.
The graphic suggests a recovery is imminent. What does the literature say about the OECD composite leading indicators, for industrial production in the OECD aggregate and for individual countries? From
Ferdinand Fichtner, Rasmus Rueffer and Bernd Schnatz, “Leading indicators in a globalised world”:
Using OECD composite leading indicators (CLI), we assess empirically whether the ability of
the country-specific CLIs to predict economic activity has diminished in recent years, e.g. due
to rapid advances in globalisation. Overall, we find strong evidence that the CLI encompasses
very useful information for forecasting industrial production, particularly over horizons of
four to eight months ahead. The evidence is particularly strong when taking cointegration relationships
into account. At the same time, we find indications that the forecast accuracy has
declined over time for several countries. Augmenting the country-specific CLI with a leading
indicator of the external environment and employing forecast combination techniques improves
the forecast performance for several economies. Over time, the increasing importance
of international dependencies is documented by relative performance gains of the extended
model for selected countries.
Here’s some relevant graphs from the updated version of the paper (not online):
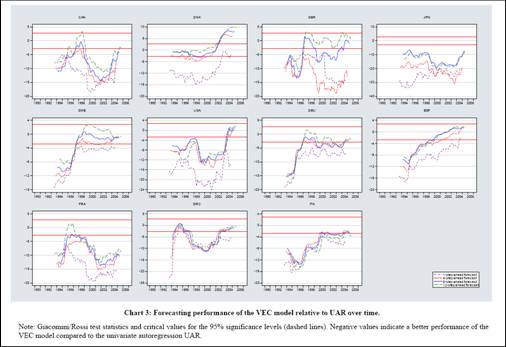
Chart 3: from Fichtner et al. (June 2009 version)
The authors note that while there appears to be some degradation over time of the predictive power of the own-country CLI for own-country industrial production, perhaps due to the effect of globalisation — it’s also true
“that
performance gains for larger economies (such as Japan and the US) from including the CLI in
the analysis appear to be more pronounced and less subject to a deterioration over time. This
possibly reflects a lower dependency of these large economies on international business cycles
and, hence, a smaller loss of information of the domestic CLI owing to globalisation. In
contrast, smaller economies showed a stronger deterioration in the forecasting power of the
domestic CLI.”
Those interested in the predictive characteristics of the OECD CLI’s should definitely take a look at this paper.
In its Economic Outlook last Autumn, the OECD took the view that the US slowdown was not heralding a period of worldwide economic weakness, unlike, for instance, in 2001. Rather, a smooth rebalancing was to be expected, with Europe taking over the baton from the United States in driving OECD growth.
Recent developments have broadly confirmed this prognosis. Indeed, the current economic situation is in many ways better than what we have experienced in years. Against that background, we have stuck to the rebalancing scenario. Our central forecast remains indeed quite benign: a soft landing in the United States, a strong and sustained recovery in Europe, a solid trajectory in Japan and buoyant activity in China and India. In line with recent trends, sustained growth in OECD economies would be underpinned by strong job creation and falling unemployment. (OECD Economic Outlook, Volume 2007/1, No. 81, June 2007, p. 7)
OECD activity now looks to be approaching its nadir, following the deepest decline in post-war history. The ensuing recovery is likely to be both weak and fragile for some time. And the negative economic and social consequences of the crisis will be long-lasting. Yet, it could have been worse. Thanks to a strong economic policy effort an even darker scenario seems to have been avoided. But this is no reason for complacency; the need for determined policy action remains across a wide field of policies
In summary, it looks as if the worst scenario has been avoided and that OECD economies are now nearing the bottom. Even if the subsequent recovery may be slow such an outcome is a major achievement of economic policy. But this is no time to relax ensuring that the recovery stays on track and leads towards a long-term sustainable growth path will call for major policy efforts going forward. (OECD Economic Outlook, Volume 2007/1, No. 81, June 2009, pp. 5 & 7
http://www.debtdeflation.com/blogs/
True. When blood starts to flow in the system, Lehman clot removed, people will be suprised why there was such dramatic recession at all.
I have been thinking about how economists use econometrics and why econometrics is less useful today and often leads to serious errors, such as Long-Term Capital Management and the current computer programs that led investment banks to poor assessments of risk.
What is interesting is that many who rely heavily on econometrics are the strongest critics of the free market, but for econometrics to work there must be a free market. One reason that econometrics has such a poor record today is that the econometrician does not realize that there is no free market. Economic events are driven more by politics in today’s world that ever before, consider GM and Chrysler and the bailouts of investment banks among so much more.
So the numbers and trends show a recovery while the politics of the situation show massive tax increases in the future. I wonder which will win out.
Two things stand out on these plots:
– The June ’82 and July ’70 situations seem similar to the current situation (on these plots), yet both of those recessions took another leg down before starting towards recovery, despite the leading indicators
– In all cases the Times highlighted, the economy was well into recovery six months after bottoming in the ‘downturn’ quadrant, which seems oddly suspicious and doesn’t seem to support the claim that “the climb out of the current downturn will be a long one.”
“When blood starts to flow in the system, Lehman clot removed, people will be suprised why there was such dramatic recession at all.”
The problem is that we now have a whole lot of new clots, and unfortunately they’re running the US government.
I always thought placing faith in the predictive power of econometrics to be questionable.
Yup, these charts were super interesting, but the attached NYT commentary was laughable.
I especially loved the comment that the shallowness of the recessions in the 1980s was due to computers. Yeah, it wasn’t the steady, tight-money policies, it was those darn computers.
Ugh. I’m so eager for the upturn to start. Or at least to see the bottom of the barrel.
I’ve been looking for a way to take action and contact our legislators and sign petitions and found some good policy the U.S. Chamber of Commerce backs (here). I don’t have a lot of money or time, but I figure this will help other people do good.
What worries me is the statement: “The evidence is particularly strong when taking cointegration relationships into account.”
Most system cointegration procedures are based on using the Cholesky decomposition to reduce a generalized eigenvalue to a standard eigenvalue problem. But the cholesky decomposition is a bad choice for this procedure — too prone to numerical error. The persons who build these procedures and who use them are generally unaware of this.
I won’t believe such results.
“When blood starts to flow in the system, Lehman clot removed, people will be suprised why there was such dramatic recession at all.”
“The problem is that we now have a whole lot of new clots, and unfortunately they’re running the US government.”
Medium term perhaps, have no idea. Short term, the pressure of liquidity is just too much to contain.Short term is literally next 3-4 months.
http://stats.oecd.org/mei/bcc/default.html is the one done by the OECD and is for all nations they cover.
@BDMcCullough:
No need to worry. Our aim is to mimic as closely as possible the behaviour of a forecaster of economic dynamics. You are right that most forecasters are likely in practice to rely on a Cholesky decomposition to implement the Johansen procedure, which implies that the estimation results are affected by inexact arithmetic.
But, frankly speaking, we don’t care so much whether our estimation technique is numerically stable. Basically, we compare the pseudo out-of-sample forecast performance of two competing models using test statistics derived from forecast errors. We find that cointegrated systems are providing us with a much better forecast than simple unconstrained VARs. Whether the VEC model is incorrectly estimated doesn’t really matter at this point. Improving the numerical stability of the algorithm might further increase forecasting performance, but it does not refute the results.
I hope this mitigates your doubts. Thanks for your interest in our paper.
Ferdinand