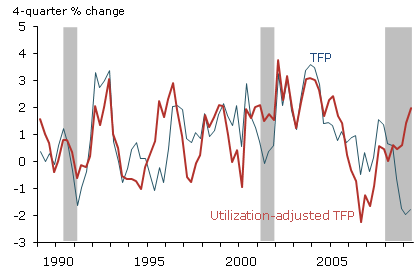
John Fernald and Kyle Matoba of the San Francisco Fed have just released a utilization adjusted total factor productivity series (data here). The importance of this development is clearly laid out by the authors:
This Economic Letter looks at potential output from the perspective of growth accounting, which assesses some of the key supply-side factors determining sustainable, noninflationary potential output. Perhaps most importantly, we find that the underlying pace of efficiency improvements — “technological progress,” broadly construed– has remained strong during the recession. This strength offers a reason for cautious optimism about potential output and the long-term health of the American economy. More immediately, stronger potential relative to the same observed output implies substantial slack in the economy.
Essentially, the authors have accounted for the fact that the utilization rate of the factors of production change over the business cycle. Succintly put:
Firms, for example, may hesitate to fire skilled workers they will need once the economy recovers, because they will lose valuable firm-specific skills and knowledge. Instead, firms are likely to reduce overtime (which reduces measured
labor input) and also, less obviously, the required effort of each worker (which is difficult to measure). At the same time that firms vary the intensity with which they use labor, they are also likely to vary capital utilization — that is, the intensity with which machinery and structures are used, most obviously the number of hours
per week the capital actually operates (e.g., Shapiro 1996).
Figure 2 compares the adjusted series to the conventionally constructed total factor productivity (TFP) series.

Figure 2 from Fernald and Matoba.
To make clear why the sustained growth rate in TFP is so critical to a discussion of macroeconomic stabilization policy, recall:
Y t pot = Φ t Kt 1-σ N t σ
Where Ypot is potential GDP, Φ is TFP, K is capital stock, N is labor stock. Taking logs and differentiating with respect to time leads to the standard growth accounting equation:
Δ y t pot = Δ φ t + (1-σ)Δ k t + σ Δ n t
So the growth rate of potential equals the growth rate of TFP plus the weighted average of growth rates of capital and labor (the weights are income shares assuming perfect competition and CRS).
This is important because, as discussed in previous posts [1] [2], the output gap is a difficult to measure object due in large measure to questions pertaining to the trajectory of potential GDP.
Output gap ≡ yt – ytpot
Where y ≡ log(Y).
This analysis suggests that potential GDP growth has not declined as might have been the case in previous instances (see the discussion here: [3] [4]).
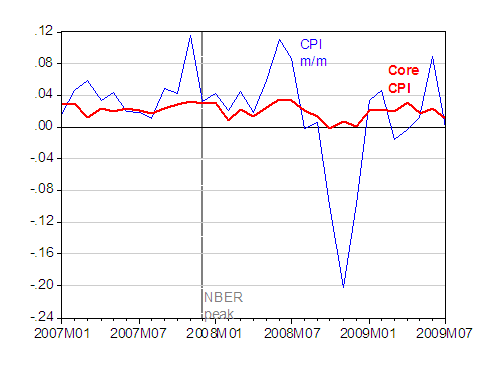
If so, the output gap is sufficiently negative that we need not worry excessively about inflation rising as monetary and fiscal stimulus pulls the economy upward. Quiescent inflationary pressures are consistent with this view.

Figure 1: CPI month-on-month annualized inflation rate (blue), and CPI core (red). Both series calculated as log first differences. NBER defined peak at gray dashed line. Source: BLS via St. Louis Fed FRED II, NBER, and author’s calculations.
According to the August Survey of Professional Forecasters, one year ahead expected CPI inflation is 1.8%, and the 10 year ahead is 2.5% — virtually unchanged from previous months.
Menzie, thanks for the post. Paul Krugman won the Nobel Prize for developing trade models that did not rely on constant returns to scale and perfect competition. No surprise that the outcomes of his models diverged from the “win-win” in textbooks.
Do you know of any growth accounting models that incorporate increasing returns? Thanks for your reply.
Wow! look at the divergence of TFP and UTFP near the right edge of the chart vs the left side.
The math looks all Greek to me.
God save us all.
Here’s something related from the IMF:
http://blog-imfdirect.imf.org/2009/08/13/potential-output-worrying-about-what-cannot-be-observed/
It is nice to see something like this that counters the widespread argument that potential gdp is collapsing when productivity is the strongest in any recession, let alone the worse of any post war recession.
Just to pour some cold water on the recent enthusiasm created by this nice paper, there is this update from the NY Fed, strongly inspired by the seminal models of Jim, which is also worth reading… contradicting a bit such a research…
Here are the links :
The original research :
http://www.newyorkfed.org/research/current_issues/ci12-8.html
And the current update :
http://www.newyorkfed.org/research/national_economy/richkahn_prodmod.pdf
What really strikes me is the trend in the probability which is highly consistent with the observed displacement of non-contstructed observations such as the beveridge curve or the median duration in unemployment ….
Given all these results, I personally doubt that there is not a major TFP slowdown in the offing….
Though it might appear comforting to note that TFP and longer-run potential output might not be lastingly and negatively affected by the current crisis, it does pose the question of possible deflation risks all the more sharply. The “true” output gap could be significantly greater that the latest CBO estimate, and deflationary pressures so much higher. If government efforts geared towards fiscal macro stabilization are reduced before the “true” output gap is reduced or closed, the US (and other world areas) could fall into a Japanese-like deflationary low-growth path. Instead of having growth rebound, it could edge up a bit before halting again as fiscal stabilization plans come to an end and governments turn to fiscal consolidation.
The behavior of inflation and inflation expectations raises the question: why aren’t they lower, given all that slack?
Just one anectdote: I’ve never even heard of furloughs being used before, now it seems that EVERYONE is on furlough. The City of Chicago is having “non-service days”. They had one yesterday. If you went to the library or city hall, it was closed and the employees were on unpaid furlough.
Talking to former colleagues, one of my former employers is on its second week of furlough this year.
Seems like a brilliant way to lower costs without losing those “skilled workers they will need once the economy recovers”.
Will this recession be remembered because of the emergence of widespread furloughs?
tom michl, I have a theory for why inflation and inflation expectations seem inconsistent with over-capacity:
First, the recent bout of inflation is very recent and feeds into expectations. Second, because there is an expectation that inflation will resume promptly, consumers of commodities, and speculators, began buying commodities (and commodity futures) near the February/March lows, leading to a recovery in prices. For the recovery/inflation camp, the price rise was self-confirming. They were correct to expect a rise in prices!
But what if the rise in prices wasn’t driven by end-use demand, but speculation that prices would rise? Stockpiles would rise along with prices. Look at the charts for aluminum, especially the 6-month change in prices and the 6-month change in the LME stocks:
http://www.kitcometals.com/charts/aluminum_historical.html
What if commodities merely stabilized this spring, or even continued to fall some? What would be the YoY change in CPI now, -4%?
ScottB: The endogenous growth literature dispenses with CRS in a certain way. See notes by Sala-i-Martin. Dennison, in his growth accounting exercises dealt with IRS in an ad hoc fashion.
Mark Thoma: Very useful link — thanks for adding it.
Ben: While not criticizing the methodology, I do want to observe that (1) the Kahn-Rich approach does not deal with measurement/underutilization issues, and (2) focuses on labor productivity, not TFP.
PatrickVB: Yes, I agree; that was the point I was indirectly trying to get at. Hence, I still think the original stimulus package was all too modest.
Looks like we are in for the mother of all jobless recoveries — that is, if a jobless ‘recovery’ can really be a recovery at all….