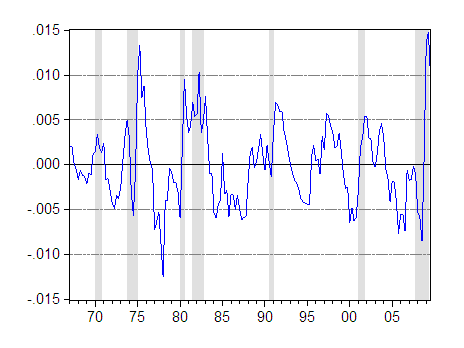
(Warning: Might be considered “wonky” by some) In many economic analyses, one wants to isolate the “business cycle” component of macroeconomic series. Here is one such series, which has had a detrending technique applied to it. Try to guess what it is.

Figure 1
The above series is the Hodrick-Prescott filtered net exports to GDP series for the United States. (I’ve discussed the HP filter in the context of output gaps before [1].) If one believes that the HP filter properly identifies the cyclical versus trend components, then the plot shows the cyclical component of net exports; hence in this context cyclical net exports were in rough balance in 2007.
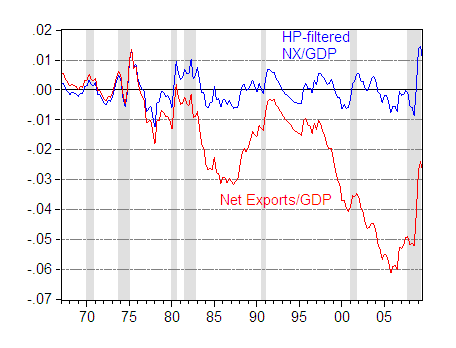
Of course, this series is much different than the one we are accustomed to. I plot the filtered and actual series in Figure 2.

Figure 2: Net exports to GDP ratio (red) and HP-filtered NX/GDP series, using lambda = 1600 (blue). NBER defined recessions shaded gray, assumes last recession ended 2009Q2. Source: BEA, advance 2009Q3 GDP release, NBER, and author’s calculations.
While it would appear that the HP filtered series does capture essential features of business cycle fluctuations in net exports (consider how the cycles correlate with NBER-defined recessions), filtering does impart some substantively different properties to the series. For instance, the unfiltered series is highly persistent, with the autoregressive coefficient in an AR(1) specification equal to 0.98, standard error 0.013. On the other hand, the filtered series exhibits much lower persistence, with an AR coefficient of 0.79.
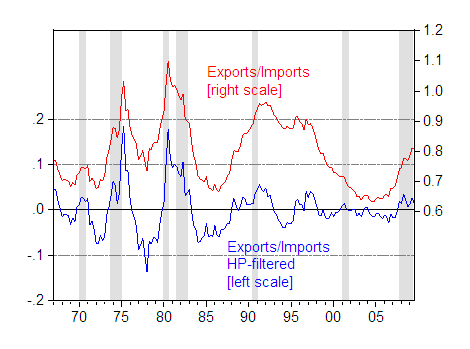
In many studies, the variable of interest is the ratio of real exports to real imports. Here are the unflitered and filtered series:

Figure 3: Ratio of real exports to real imports in Ch.2005$ (red, right scale) and HP-filtered (blue, left scale). NBER defined recessions shaded gray, assumes last recession ended 2009Q2. Source: BEA, advance 2009Q3 GDP release, NBER, and author’s calculations.
The degree of persistence is once again lower with the HP-filtered data, as is the variability, especially during the latter portion of the sample. The HP-filtered series also indicates almost no business cycle related fluctuation in the exports/imports ratio over the entire 1997-2007 period. Perhaps that’s the right interpretation. It certainly does give one pause for thought.
What’s the bottom line? For me, it’s not that HP-filtering is necessarily a bad idea. It’s just that one has to be real careful, and think about what is being extracted, and what remains, when applying any detrending technique.
For more formal discussion of the use of various filters, see Cogley and Nason [link updated 4pm Pacific].
FYI: I had a problem with the link, 404.
The link to Tim Cogley’s review down.
Ross and Spry: Thanks, I’ve replaced that link/paper with another one which conveys the message.
Why not use the BP filter to look at explicit frequencies rather than relying on the implicit frequency of of the 1600 parameter value?
When the HP filter is written in state-space form, it is apparent that the filter is trying to balance two conflicting goals: i) aim for white-noise differences between the actual data and the HP trend; ii) penalize bends in the trend with no regard for when they occur.
One consequence of this set-up is that the HP trend will decelerate prior to recessions and accelerate prior to booms for the sake of the first objective, even if nothing happening at the moment calls for such a deceleration.
See figure 7 from Dueker and Nelson (2006) to see this distortion.
To avoid this problem, Charles Nelson and I advocate business cycle filtering in the following way: estimate a latent business cycle index and a set of coefficients. Then, given the model coefficients, find counterfactual values of the data that would be most consistent with a fixed business cycle index. In this way, there will be no spurious decelerateion of trend output before a recession because that would be inconsistent with a flat-line business cycle index.
The key is to penalize bends in the trend that occur at the wrong time as well as the bends themselves.
Shall we read a steadiness in x/m to be inelastic to any other variables since 1990?
” It’s just that one has to be real careful, and think about what is being extracted, and what remains, when applying any detrending technique.”
If there’s a statistical technique to which this advice does not apply, I’ve never even heard of it.
In general, overall and by-subgroup descriptive statistics and graphs will alert one to strange behaviors of a statistical methods.
These charts should be supplemented with
http://research.stlouisfed.org/fred2/series/BOPXMDN
Filtering is almost always a bad idea, with the possible exception of seasonal adjustment. Filtering to remove trends throws out most of the low-frequency information, which is precisely where you would expect to find evidence of economic relationships. The right way to look for relationships between trending economic time series is cointegration analysis. If you’re interested in somewhat higher frequency relationships, see Robert Engle’s “Band Spectrum Regression” published way back in 1974 in the International Economic Review.
I would have though that we should not be surprised about the lower AR(1) properties from a filtered series because we are removing a trend. Not sure that says anything about the appropriateness of the HP filter.
I agree with Gabriel that BP filters impose some restictions that accord with priors about cycle frequency – would be interesting to see how it performs on both series above.