And some lessons from the 1930’s for the 2000’s
John Taylor returns to the topic of how much impact the stimulus package has had on output. The heart of the argument is summarized by his extension of a graph presented in the NYT (and reproduced in this post).
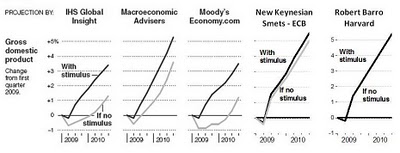
Figure from Taylor (2009)
As I noted earlier in my post about counterfactuals, this is the right way to assess the impact of the stimulus — that is to compare the outcome against a counterfactual, and here Professor Taylor has done so, bringing into the mix the Frank Smets and Raf Wouters model as well as Barro’s. (In other words, comparing forecasts w/stimulus to outcomes incorporating unforecasted shocks that have been realized is like comparing apples and oranges, as in [0].)
An Analogy
Why is this the right way to assess the stimulus? Here’s a medical analogy for why we need to look at things from the perspective of counterfactuals and model predictions.
I give a patient with a fever aspirin. However, the fever continues to rise. I could conclude that aspirin caused the fever to rise relative to what would have occurred without aspirin. Or I could use information regarding the effect of aspirin on fevers, obtained from previous experiments and experiences, and use that information to infer what the fever would have been in the absence of dosing with aspirin. Now, we know that the impact of aspirin on fever varies across individuals, and across types of infection. Does that mean the information from the past is useless? I would say not, and that we should make inferences, allowing for those variations, with some special reference to the mid-point of the range of estimates.
The Models and the Scenario Assumptions
Once we have determined what is the right way to proceed, it then makes sense to think a little about the models. First, what models have not been added. Well, there’s the Eichenbaum and Christiano as well as Laxton et al. models (see this post for discussion) as well as the Hall model (see this paper presented at the last Brookings panel on economic activity). Those papers presents substantially larger multipliers, while several have New Keynesian elements in a DSGE framework. In other words, they are DSGEs like the model used by Professor Taylor (see the ECB working paper for the full explanation of their approach. Why the difference? I think it has to do with (among many other things) the assumptions regarding the conduct of monetary policy (this is a point that Brad Delong makes with respect to the Cogan et al. paper).
Another issue: How are these models fitted? The macroeconometric models cited in the NYT article are estimated with judgmental factors incorporated (a very nontechnical description of the Macroeconomic Advisers model is here. How are DSGE’s fitted? The parameters are tweaked until the impulse-response functions conform to priors and data (see Camilo Tovar’s overview of using DSGEs in policy institutions here). (And in the case of the Barro model, that’s estimated over a very specific period, none of which begins after 1950 — see comments to this post).
Once the methodological approach is resolved, one still needs an understanding of where the specific models — and model conclusions — came from, and what assumptions drive the results. That’s why I often refer to surveys of multipliers [1] [2] (somebody should do a meta-study), and ranges of multipliers (as the CBO does [3]) in order to make conclusions regarding the impact of any policy.
Moving Forward
At the end of the post, Professor Taylor concludes:
…Moreover, in my view, the models have had their say. It is now time to look at the direct impacts using hard data and real life experiences.
I think one should always look to the data; whether we have sufficient data yet (given that the stimulus started in 09Q2, and we have not yet seen the advance 09Q4 release) makes me less than optimistic that we can yet tease out the effect of the stimulus using, for instance, SVAR approaches.
Multipliers from the Great Depression
I end on a slightly different note for the New Year (and the new decade), namely the Miguel Almunia, Agustin S. Benetrix, Barry Eichengreen,
Kevin H. O’Rourke, and Gisela Rua estimates for the government spending multiplier during the 1929-39 period, for a panel of 27 countries. From their paper (h/t Paul Krugman):
Figure 14 presents the responses to a shock to defence spending. It shows that
innovations in this variable are expansionary. This shock explains, on average, 6 per cent of
the forecast error variance of the GDP equation in a five-year horizon. Defence-spending
multipliers are 2.5 on impact and 1.2 after the initial year. These are at the upper end of the
range of multipliers estimated using modern U.S. public spending data.50 The absence of a
fiscal policy effect on output during the 1930s does not reflect the absence of a positive fiscal
policy multiplier, it would appear. Note that this is also the conclusion of Romer (1992) in
her calibration exercise for the United States in the 1930s.
Food for thought: empirical evidence, based on data for a period when nominal interest rates were low…and no wartime rationing in place.
.Happy New Year to all Econbrowser readers!
John F. Cogan , Tobias Cwik ,John B. Taylor and Volker Wieland approach is more of appeal to rigor,and the Keynes friendship with Ricardo not discarded.
The issue remains, Keynes has been given a chance since long and his credit may be more than exhausted.
FGCEA, Federal Government Consumption & Gross Investment
http://research.stlouisfed.org/fred2/series/FGCEA
Series: CUMFN, Capacity Utilization: Manufacturing (NAICS)
http://research.stlouisfed.org/fred2/series/CUMFN?cid=3
Series: FYGFD, Gross Federal Debt
http://research.stlouisfed.org/fred2/series/FYGFD?cid=5
Series: FDHBFI, Federal Debt Held by Foreign Investors (Discontinued Series)
http://research.stlouisfed.org/fred2/series/FDHBFI?cid=5
The above profiles suit more countries than the USA macro accounts.
Hi,
The range of projections, from Moody to Barro, makes it clear that the accuracy of the model is critical. Are there even models that indicate a negative impact of a “stimulus package”?
Since there are no obvious “control economies” that can be used for comparison, how are (how can?) various such models be evaluated?
Are the economies of the various countries enough alike that they can be used as “controls”? Or has globalization linked them enough to make that idea useless? And the same for historic data: can the various models be applied to some past time and then see how accurately they would have predicted the “future” (i.e. to the present)?
Consider your aspirin-fever example: with data from only one subject and one fever, it would not be possible to determine the effect of aspirin on fever. No doubt 5 different “models” would show as much variation as your 5 economic models. It takes data from many people, plus animals and some basic biochemistry, to predict (model) accurately the effects of aspirin.
And to close on what I think is an analogy to economic models: the effect of Green House Gases on climate (discussed here recently). With only spotty information of questionable reliability on only one planet (earth) it would not be possible to make a convincing case for any future projection.
But with some additional information, namely the fact that humans burn fossil fuels, the measured increase in CO2 (and methane) in the atmosphere, and the fact that GHG’s adsorb heat, data on the climates and atmospheres of other planets, etc. and the conclusion is clear that the climate would be expected to be effected.
But how much unusual weather (droughts, floods, blizzards, hurricanes, early frosts, changes in vegetation, etc.) does it take before everyone will conclude that the earth’s climate is changing as a result?
Menzie,
Happy New Year and THANKS to both of you for all the excellent posts in 2009.
1) In the context of our current economic environment and our current and projected fiscal imbalance, is there more of a consensus among economists on the net effect on GDP beyond the short term of deficit-financed stimulus, either generically speaking (some range assuming different forms of stimulus with different effects) or for the actual stimulus being applied?
2) As a layperson (non-economist) I look to the experts (economists) to potentially get some sort of answer or best guess on such analytical matters. When there are substantially different views/conclusions among economists on some question, I have to consider the possibility that one or both “sides” has reached its stated conclusion due largely to inadvertent bias or perhaps even lack of full good faith in presentation of the conclusion and supporting analysis. In the case of this question and the differing conclusions:
A. Is there a strong correlation between the conclusion drawn and ideological/party affiliation?
B. If so, what are the chances that, on one side, the other, or both, the causation runs from ideology/party to conclusion (i.e., inadvertent bias or lack of full good faith), as opposed to either causation running in the opposite direction (such analytical views driving ideological/party affiliation) or no causation existing (conclusion and ideology/party being independent of each other)? I know that answering this question requires (possibly undiplomatic) conjecture, but I’d be interested in your thoughts and your answers/guesses, as well as those of commenters.
I see that one of the charts is from IHS Global Insight. I recommend the book Spin-free Economics by Nariman Behravesh, Chief Economist at IHS Global Insight http://www.amazon.com/SPIN-FREE-ECONOMICS-Nariman-Behravesh/dp/007154903X
(Menzie, I see double post of my earlier comment. I don’t know why that happened. Feel free to delete one of them.)
I inject a patient with lethal toxins, see the patients health degrade, and conclude that the reason the patient got worse was because he just wasn’t give enough toxins.
“The stimulus wasn’t big enough.” This is always the conclusion of keynesian policy makers. We’ve tried mailing out $600 checks, paying people to buy cars, paying people to buy houses, handing over trillions of dollars to banks, buying trillions in mortgage securities and treasuries… pretty much everything but the kitchen sink.
While stimulus efforts allow us to pretend the economy is getting better in the short term, this nonsense will dig ourselves into a mountain of debt. When we are forced to raise interest rates and the next business cycle starts all of these government sponsored malinvestments will be exposed again, just like they were in 2000 and 2008.
ok, so let me understand this. We have spent 787B on the first stimulus and have added another 150B in a second “stimulus” called benefit extension. So in total 900B has been extended. In return, we get about 2% a year for 2 years of added GDP in excess of baseline as Menzie likes to say. How that baseline is determined is another question but we can assume it is accurate for this purpose. We have a 14T economy. So 2% per year is roughly 280B. We will assume the 2% is accurate even though most economic PROJECTIONS are suspect at best. But even given that, 2 years of 2% above baseline gives us approximately 560B in added GDP. Forget about the error rate, 400B more for Fannie/Freddie, 100B’s for GM, GMAC, Chrysler, AIG and hundred’s of billions of debt purchases in the open market as well as spending the repayments of TARP. Let’s just focus on 560B of “above baseline” GDP for 2 years.
Sounds like the multiplier on that is significantly less than 1.0. Menzie, where is the math wrong with baseline? Heck, I will give you 3% above baseline for 2 years which equals approximately 840B. Still less than 1.0 mulitplier just on stimulus bills.
It’s only results government employees and academia would love.
Private sector would say that is failure and the CEO would get fired. But that is coming in 2010 elections.
PS, those conclusions were based on 3rd qtr GDP increase of 3.5%. It actually came in at 2.2%. So take more than 1/3 off your results. Also, the conclusion means that we should have the government be the employer as it has better results. How do they pay for all that labor? Government does not spend efficiently. You can’t have a multiplier above one.
Menzie,
I know it is difficult but John Taylor is exactly correct and in an amusing way your analogy illustrates Taylors criticism of your post.
In your fever-aspirin analogy you are attempting to prove the efficacy of aspirin, but your analogy assumes the efficacy from the start. If aspirin were replaced with bleeding the patient your assumptions prove the efficacy of bleeding. This is the same logical foundation of the analysis of the stimulus.
By looking at the results of the stimulus on the economy we have to make the judgment that as of now it has not lived up to the advertising whether unemployment (8% or 10%?) or an economic recovery that still eludes us with the most positive forecasts seeing both continuing until at least the 4th QTR of 2010.
The best you can say for the stimulus is that is has had no effect. But because of the nature of the impact of the deficit spending and monetary manipulations, any serious negative impacts of the policies will not become manifest until 2010.
If there is no recovery in 2010 even the most passionate supporter of stimulus must either recognize the failure of the policy, or put on the mantle of a fool.
Let me agree with Tim Kemper. While government spending will surely increase GDP, the question is better posed as to whether it is worth the cost. Tim’s analysis suggests it isn’t.
Further, the ‘stimulus’ is treated as though it were a monolithic, homogenous program. It is not. It comprises many different initiatives. Some of these, for example the Cash-for-Something and the HAMP program (see NYT front page yesterday) have proved to be disappointments.
On the other hand, as Jim Hamilton has pointed out, the failure of financial institutions carry with them important externalities that can cause a wider economic collapse. The bankruptcy of Lehman was a good example of a bungled intervention followed by a spike in unemployment. So protecting the financial system as a whole would seem to be a good investment–assuming such an intervention can be properly executed.
In short, I think the consideration of the stimulus is a more nuanced issue, and its treatment as a single entity may obscure more than it reveals.
Finally, I remain concerned that the economics profession has not yet even agreed on what a recession is from a functional and mechanical point of view. Nor is it clear to me that all recessions are the same. Is an inflation-led recession the same as an asset/debt-led recession? Is one a cold and the other meningitis? Is aspirin the right remendy for both?
tim Kemper: Please refer to my previous posts on multipliers, and a standard intermediate macro textbook (either Mankiw, or Hall and Papell, etc., but at least one). Recalling the composition of the stimulus (which I outlined in this post, and the fact that there are numerous tax and transfer provisions, there is no need for the multiplier to be greater than one.
For an illustration of impact multipliers, see here. Dynamic multipliers are a bit more involved to calculate, but necessary if you want to undertake the calculations you aim to. In this regard, you might find these multipliers of use.
I admit I didn’t read all the links, so maybe I missed the answer to my concerns, but at first blush this seems like an input/output/gain(multiplier) model to me.
I get stuck on quantifying the input, and gave up on the rest.
My very old econ textbook says there can be monetary and fiscal stimulus. I guess it may be possible to have stimulus programs fully funded by current tax revenues, sort of the way biz does investment sometimes, but the USG has never figured out how to do it that way. So for the sake of simplicity I would have to use the entire fiscal deficit as the number for fiscal stimulus. Then we have Bernanke Banking, so we would need to throw in the delta we got from Fed balance sheet expansion as well.
So in my mind that makes the fiscal part of the stim program(let’s use 2 years?) equal to 2 X $1.4T (fiscal deficit) + $2.2T- $.9T (Fed balance sheet expansion)= $4.1T
Noting that $4.1T is very much larger than $787B, no matter how you decide to measure output, this looks like a very sluggish servo system to me.
Then there is monetary stimulus, currently set at ZIRP. I’m pretty sure only economists can figure out what that does, and I don’t have a clue.
Ok, I guess I misinterpret what you are saying. You are arguing that the stimulus needed to be done because govt had to substitute for private demand. I am trying to discern what is the best way to stimulate the economy to produce more jobs. Two different pruposes. Although the creation of jobs will in itslef stimulate demand I believe. So I am trying to determine what is the most efficient way for the govt to help spur employment thereby increasing demand. If we spend 900B over 2 years and get 2.5% per year increase in baseline GDP, is that the most efficient way to spend our money? Annual GDP (forget QGDP) is 14T. 2.5% per year is roughly 350B annual X 2= 700B of increase in baseline GDP output. And we already know the CBO analysis was inaccurate as we have hit 10% unemployment and they predicted no higher than 8% WITH the stimulus. So I think there analysis has lost much credibility.
tim kemper: I’ll be sure to pass on news of their failings to my colleagues at the CBO.
Using your criteria (which I would not use, myself, or I’d be running nothing but VARs all day), we should look to Nouriel Roubini — who did foresee the crisis — for his views on the fiscal multiplier [1].
Exactly right problem, wrong solution. Does nothing to support your analysis on effect of govt stimulus. Payroll tax cut would work to increase demand, jobs and GDP more efficiently than govt spending. Its like eating 5000 calories for dinner and seeing the heart disease 2 years later. We will see it, yield curve says so.
“Payroll tax cut would work to increase demand, jobs and GDP more efficiently than govt spending.”
Hi,
I have seen several recommendations for a “payroll tax” cut/suspension/holiday to increase demand. I assume that refers to the FICA that funds Social Security.
But that raises a fairness issue: it would directly benefit only current WORKERS but not others (retired, unemployed, etc.) And the benefit would be larger the higher their wages (up to $100k). Why not an increase in the EITC, or even Milton Friedman’s “Negative Income Tax? That would benefit almost everyone, and give more to those that now earn the least. Does a $100, 000 a year worker deserve 4 times the stimulus that a $25,000 a year would get? Why?
And would the effect of the Negative Income Tax not be at least as large as a comparable reduction in the FICA?