With the consumer in the doldrums, residential investment unlikely to rebound in the near future, and government stimulus constrained by political gridlock, it’s hard to see where the sources of aggregate demand will be. I’m going to extend Jim’s search for silver linings in the latest GDP release.
A Growth Decomposition
One possibility is that domestic investment will take up some slack. As several observers have noted, corporations have been making substantial profits and have the wherewithal to invest, and yet are not. Of course, depressed investment in plant and equipment was true before the recession, in 2006 and 2007, so it’s unclear why it should take the lead now.
One reason to think that nonresidential investment would take off is that gross investment is rising (17.6% q/q SAAR, roughly twice what MA forecasted back on 8/12), and contributed 2 ppts to GDP growth. Before anybody thinks this is some pollyana-ish prediction, I’ll note that the rise only makes sense given the catastrophic and persistent decline in this category during the recession. Given depreciation, the real private nonresidential capital stock has probably been flat (recently released BEA data indicates that this series was flat going from 2008 to 2009, which is pretty remarkable). This observation links up with the negative (mechanical) contribution of imports on GDP growth that has been remarked upon.
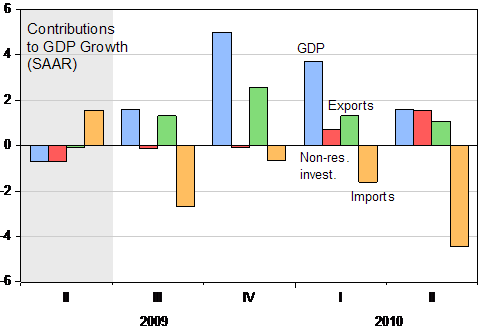
Figure 1: Real GDP growth (blue), and contributions of Non-residential investment (red), exports (green) and imports (orange), SAAR, in percentage points. Source: BEA, GDP 2010Q2 2nd release.
The Composition of Imports and the Prospects for Exports
I think it’s of interest to examine the components of the growth in imports since the trough, and what that implies for future growth. As I pointed out in a previous post, a large share of increase in imports is in the capital goods category.
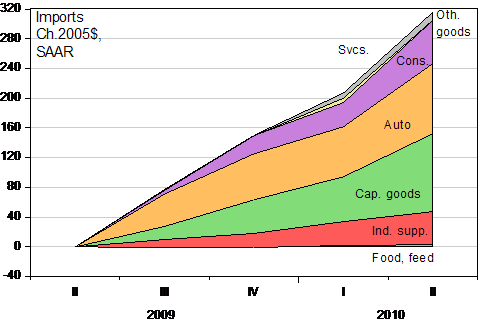
Figure 2: Change in imports since 200Q2, in billions of Ch.2005$, SAAR. Source: BEA, GDP 2010Q2 2nd release, and author’s calculations.
Most observers focused on the surge in consumer goods imports, but considering slightly longer term trends, one sees a larger component associated in investment, presumably to build future production capacity.
Another observation is that exports have been contributing (once again, in a mechanical sense) to growth since the end of the recession (which I am assuming occurred at 2009Q2), although given vertical specialization, it’s unclear how much.
What are the prospects for continued growth in exports? I use a standard error-correction specification:
Δ exp t = β 0 + φ exp t-1 + β 1 y t-1 + β 2 r t-1 + γ 0 Δ exp t-1 + γ 1 Δ exp t-2 + γ 2 Δ y *t-1 + γ 3 Δ y *t-2 + γ 4 Δ r t-1 + γ 5 Δ r t-2 + u t
Where exp are log real exports of goods and services, y* is log foreign real GDP, and r is the log real trade weighted value of the dollar. The real foreign GDP variable is export weighted, through 2009Q4. I extended the series for 2010Q1-Q2 using GDP growth rates from the Economist and trade weights accounting for over 80% of US exports. The dollar index is the Fed’s broad index, deflated by CPI. This specification is discussed in greater detail in this post.
Estimating this over the 1973Q4 to 2010Q2 period, one obtains a specification with an adjusted R2 of 0.35, SER = 0.020. The implied long run income elasticity is 1.81, the long run price elasticity is unity, while the rate at which errors correct is approximately 8.3% per quarter. All the long run coefficients are statistically significant, using Newey-West standard errors. Box Q-statistics for 4 and 8 lags fail to reject the no serial correlation of residuals null.
I use the estimated specification to forecast starting 2010Q2, out to 2010Q3. The actual and forecasted (log) values are shown in Figure 3:
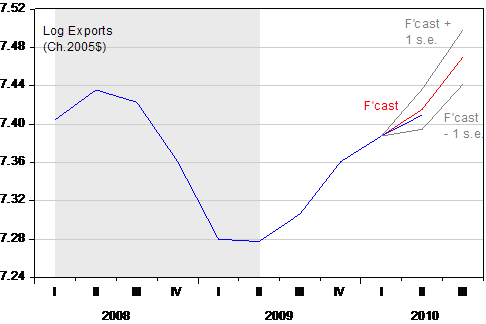
Figure 3: Actual log exports of goods and services, Ch.2005$, SAAR (blue), forecast (red), and plus/minus 1 standard error band. NBER defined recession dates shaded gray, assumes trough at 2009Q2. Source: BEA, GDP 2010Q2 2nd release, and author’s calculations.
This forecast is consistent with exports contributing about 2.8 percentage points (SAAR) to overall growth in 2010Q3. The increase in real exports is 24.4% q/q on an annualized, substantially above Macroeconomic Advisers’ forecast of 12.2% (8/12/2010). The predicted growth is being driven by the close correlation between the growth rates of exports and rest-of-world GDP, illustrated below.
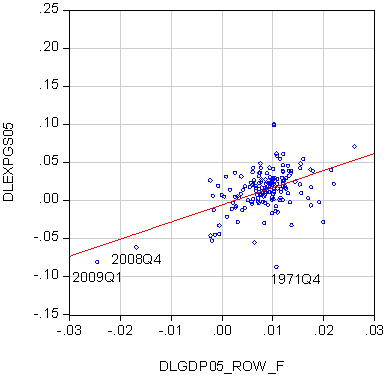
Figure 4: Scatterplot of log first differences of real exports against rest-of-world GDP, 1970Q3-2010Q2. Source: BEA, GDP 2010Q2 2nd release, Federal Reserve Board (70Q3-2009Q4), and author’s calculations.
The adjusted R2 for this simple bivariate relationship is 0.23.
I don’t want to make too much of this specific estimate based on the estimated ECM; the one standard error bound encompasses a 13.8% increase, close to the MA number.
What about the longer term? Clearly, in a time of tremendous uncertainty regarding growth prospects, it’s foolhardy to try to project further into future. But one can see what firms abroad anticipate, by looking at what they’re importing from us (i.e., what we’re exporting). Figure 5 depicts the increases since 2009Q2.
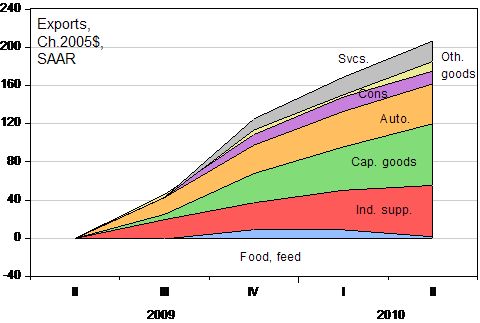
Figure 5: Change in exports since 200Q2, in billions of Ch.2005$, SAAR. Source: BEA, GDP 2010Q2 2nd release, and author’s calculations.
The substantial increase in capital goods exports suggests to me that foreign producers are ramping up investment in anticipation of renewed growth. Of course, those expectations could very well prove very wrong (i.e., I have no slavish adherence to rational expectations).
Policy Implications
None of the foregoing should be construed to mean I think we’re not in a rough patch. [0] In particular, there’s not much to indicate resumed consumption growth, and government spending on goods and services is stagnant (real state/local spending 2.3% less than peak at 08Q3, even while population has risen 1.5% in log terms). (I.e., “fiscal mindlessness” persists) At the same time, monetary policy authorities are strangely reluctant to further extend expansionary monetary policy even as deflation appears more likely. [1] [2] So while the international economy might add some pluses, consumption behavior and policy [3] is exerting contractionary forces on the economy. Finally, returning to domestic (nonresidential) investment, aggregate demand has to be sustained in order to keep investment spending up; I’m pretty dubious tinkering with the user cost of capital will do the trick (see here).
Interesting side fact: The magnitude of the (absolute value of the) contributions of exports and imports to GDP is unprecedented in the past forty years. That outcome is consistent with increasing vertical specialization, discussed here and here.
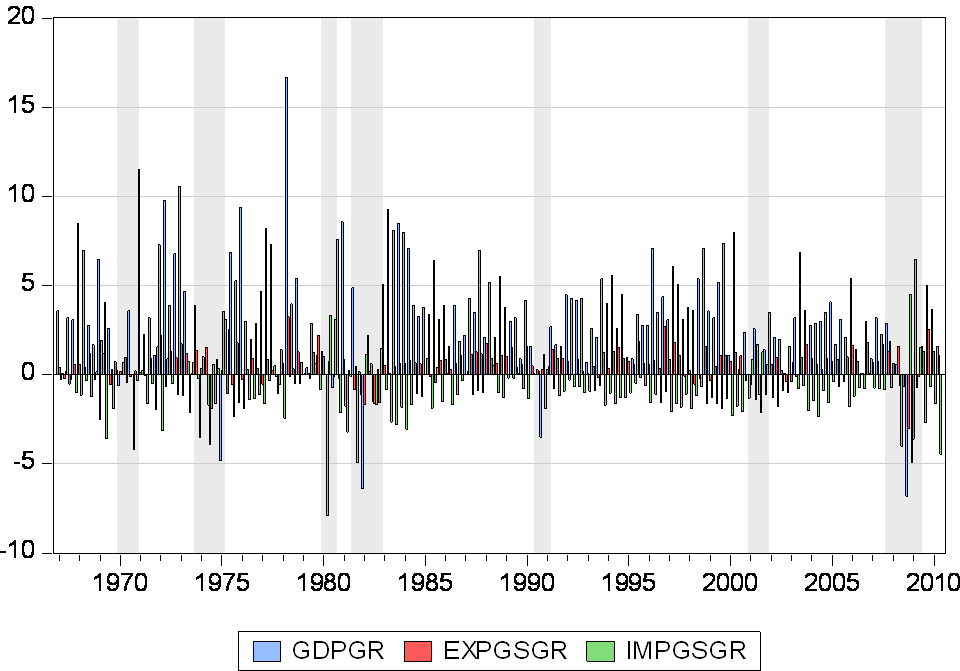
Figure 6: GDP growth (blue), and contributions of exports (red) and imports (green), in percentage points. NBER defined recession dates shaded gray, assumes trough at 2009Q2. Source: BEA, GDP 2010Q2 2nd release.
Only in Obama Nation is running deficits of 10% of GDP considered “government stimulus constrained by political gridlock.” So if we could only get the votes for 15% or 20% of GDP, that would fix everything?
Keynesian Hopemobile, meet Brick Wall of Reality.
Menzie,
This is all a bit over my head but this: “(real state/local spending 2.3% less than peak at 08Q3…), seems too low. Does the 2.3% stand if the stimulus funds are subtracted out of the equation? State and local revenues have most certainly fallen more than an average of 2.35%, have they not? So would it not follow then that State and local guv spending would fall further as the stimulus fades?
WC Varones, it’s worse than that. In 2009 the US govt borrowed to spend $1.885 trillion, which was 13% of the 14.25 trillion GDP.
This is different than the reported ‘deficit’, but nearly 1.9 trillion is what they actually borrowed.
One cannot help but wonder: What level of deficit spending producing the present stagnant response would it take to convince a Keynesian that this approach is misguided?
rayllove: The figure is for government consumption at state and local levels; total expenditures (including transfers) probably fell more.
Related to raylove’s question, here is a recent news story on the steep fall and slight rebound in state tax revenues (down 17% from the peak). There is a link to the longer report on that page.
This graph illustrates the US government expenditures since 1940 (USA data is available and therefore used for easy convenience)
Series: GEXPND, Government Current Expenditures
http://research.stlouisfed.org/fred2/series/GEXPND
This graph illustrates the Series: GFDEBTN, Federal Government Debt: Total Public Debt (USA data is available and therefore used for easy convenience)
http://research.stlouisfed.org/fred2/series/GFDEBTN
Planed and wrongly planed these economies are still looking at Central banks and Governments expenditures for their survival.
Same actors same scripts,when Central banks are not deemed to direct the economies,when governments or most of them, have wrongly influenced the structures of their economies.
May be time to draw some conclusions,Central banks are defined to be supportive,governments have taken too much room and misguided the real production functions.
4 comments:
1) Last time I looked (about 5 years ago), Macroeconomic Advisers had a very simple model of exports — exports were just a function of foreign growth (can’t remember the lag structure), and foreign growth is a function of US growth (again, can’t remember the lag structure).
2) On the topic of stimulus, I don’t have a strong view whether or not FURTHER stimulus is necessary. I do suspect we are trying to speed the recovery faster than possible, like a doctor throwing all sorts of medicine to a patient to get her recover from a cold faster than 7 days (as a result, the patient recovers in a week with a damaged liver).
3) I do believe, however, if further stimulus is deployed, at this stage, fiscal stimulus will be more effective and less harmful than more monetary stimulus. I hope by now, most people would agree that the ultra stimulative monetary policy in 2003, 2004, and 2005 was at least a contributing factor for our current mess. Current long period of ultra low rates is causing most asset classes to be mispriced, but it is difficult to know which one is the worst mispriced. At least for fiscal stimulus, its cost are more transparent.
4) Since we are talking about sustainable growth, it is useful to remember that average growth in US was 2.5% for the past 20 years.
Orthogonal topic:
Menzie, do you mind identifying which software you use in your work? (I mostly use R, but am always on the lookout).
Be nice if WCV went back to school to take the macroeconomic course he obviously failed!
Varones and Bryce, will you ever offer what you anti-Keynesian’s would do, and why it would work, with historical references?
Or, is your “the sky is falling, the sky is falling,” all you got?
Menzie: minor typo in your specification? The second term on the right hand side is written as:
imp t-1
I believe it should be
exp t-1
PS: 1) This MA ppt is the only documentation I have (previously cited in this post). The export equation is a plain vanilla “exports as a function of foreign income, and relative price of exports” (slide 23). I use a more reduced form expression, relating exports to foreign income and real exchange rate, thereby collapsing the pass through equation into the export equation. Slide 30 indicates that foreign income is a function of US income and inflation, plus autoregressive elements.
Steve Bannister: My coding days are past (by and large). I use EViews and Stata. In olden times, I used TSP and a stat package from Berkeley, BLSS. I’ve heard good things about R, but never tried.
Robert Bell: Thanks! Fixed now.
Here’s some math, using some ballpark estimates:
– 1 trillion dollar deficit
– $500 billion to be covered by tax increases
– 115 million households in the US
– top 16% of households (hh income >$100,000) to carry 80% of tax burden (this is not top 3% of households as often mentioned, but 5x larger pool)
= $400,000 million tax burden carried by 18 million households
= average annual tax burden per top 16% household: $22,000 per year (on a median hh income around $125,000 for this group)
This is not Bush versus Obama, this is Revenue versus Expenditure, and we need to get a grip on it–soon.
David Rogde,
The historical reference would be the severe recession following WWI. The gov’t reduced the burden it placed on the economy by reducing taxes & spending. It allowed people & prices to adjust to the economic realities without meddling, in stark contrast to today where the gov’t is everywhere interfering with the processes of formerly free people.
The sharp recession was followed by a healthy, brisk, sustained recovery.
Steven Kopits said: “This is not Bush versus Obama, this is Revenue versus Expenditure, and we need to get a grip on it–soon.” Thank you, sir!
We are at a point where every discretionary dollar spent is borrowed. How long before the rest of the world catches on???? How long at this borrowing rate before the US economy collapses??? Whose economy will be left???? How long before we realize we are still rich in raw resources (coal is just one example), and for what reason are we wobbling on exporting?
Bryce– you have a great example, but please note that the post WW I recession, like the post WW II recession and the post Civil War recession was caused by a sharp drop in government spending in the first place.
If you keep that in mind you just might draw some different conclusions.
Simple solution to fix aggregate demand:
(1) Set policy to extract $300 billion/year from the wealthiest 2% (note: start with aggressive enforcement of existing securities laws, with punitive damages and clawbacks; next-best choices will be taxes on stock/bond trades, dividends outside 401k-type plans, capital gains; also reinstate reasonable estate taxes — wealth should be earned and not too easily inherited). The rich don’t spend their marginal dollar as rapidly as the poor, so to boost aggregate demand they are “where the money is”. Useful byproduct: this will level the playing field for the middle class.
(2) Import 3 million well-to-do skilled people. Pay them $100,000/year using funds from above, to work on overdue infrastructure projects. These workers will need housing, and this will sponge up the surplus housing and stabilize home prices.
Not perfect, but for a quick fix, this is a decent start…
Comparison of historical events are slippery unless the beginning of the period is a part of the picture. Today, in the U.S., we have housholds under water on their mortgages because they and their neighbors paid too much years ago. We also find that credit card usage is being restricted by lenders but the % of people with delinquent balances is higher than ever.
Our problem is not just unemployment – it is under ememployment plaster on top of credit problems. What happened in the past is a poor guide today.
The best solution is a carefully designed way to restrict imports which will avoid creating a trade war.
How can we determine future demand when so much fraud and abuse still exists today?
The steps outlined below should have been implemented 2 years ago in conjunction with QE. Taxpayers received no benefit from Bernanke’s policies. We need policies where each consumer is allowed to clean up their household balance sheets based on fairness for all. Banks instead of paying bonus’s should hire hundreds of employees to implement the following:
1. All homeowners who can PROVE with receipts that the additional refinanced cashed out money after the first “purchase money” loan was for home improvements then this loan should qualify for a principle write down regardless of income. In addition all “purchase money” loans should get an automatic principle write down regardless of financial status. Not helping folks today with a “purchase money” loan is a disgrace, because this is one situation where the bank is equally at fault if not more at fault. These folks were busy working and trusted realtors, mortgage brokers and the whole FIRE industry to provide sound financial advice based on the amount of fees and commissions paid by this homeowner.
2. Second Home Loans and HELOC not backed by home improvement receipts and credit card debt should be treated equally under the same new policy. There is no difference between the debt if a homeowner refinanced to pay off credit card debt or if a renter / homeowner did not.
As it stands today after 6 months of defaulting on your credit cards you have no option but to endure the collection agencies and a 7 year hit on your credit report as opposed to a homeowner defaulting on second loans. Why did congress not add a recourse clause to the recently passed credit card act? What good is the credit card act if there is no recourse to recapture the abusive penalties? All debt today whether collected, charged or still being paid should be recalculated going back 10 to 15 years using the new rules for a new outstanding balance. After crediting back to the consumer the years of bad abuses then set up a program for each individual to pay off the debt based on the monthly payment he/she can afford. This is fair for both the consumer in debt and the consumer who did not use credit cards or did multiple cash-out refi’s. There is no disputing second home loans and HELOC are given huge leniency yet are equal to credit card debt.
3. Bernanke can absorb the losses the banks will take on the above policies after eliminating any profit these banks will make for years in addition to claw-backs on all ill gotten gains.
We know mortgage fraud and credit card abuse was out of control. Where is main-streets recourse?
The key to economic growth is investment. The key to funneling savings into investment is to minimize the size of the commercial banking system. You minimize the size of the banking system by first eliminating IORs.
Then you begin to reverse the errors of the past. I.e., you reinstate REG Q ceilings for the commercial banks & drive the savings held in the CBs to the non-banks. I.e., you reverse the contraction in the Shadow Banking system and do whatever to encourage its growth. You see, the CBs never experienced disintermediation when REG Q ceilings were eliminated, only the thrifts did.
I.e., you match savings with investment. CB’s don’t loan out savings. They create new money when they loan & invest. The CBs pay for what they already own. You can’t take money out of the CB system by giving it to the non-banks. It just results in a transfer in the ownership of those deposits.
And size isn’t synonymous with profitiablity. The CB system would be smaller, but it would be more profitable. The entire economy benefits as the supply of loan funds increases, and the cost of loan funds decreases.
If you think these statements are in error, then you can’t say you understand money & central banking.
The proof, out of the entire realm of economic debate, exists in only two papers. Read them before ignoring the truth & opening your mouths:
1. The Commercial & Financial Chronicle Thursday, April 6, 1967 MONETARY POLICY BLUNDER CAUSED HOUSING CRISIS
2. The commercial & Financial Chronicle, Thursday, June 6, 1968 REPEAT OF 1966-TYPE CREDIT CRUNCH UNLIKELY DESPITE TIGHT MONEY
See: Dr. Leland James Pritchard, PhD, Economics, Chicago, 1933, MS, Statistics, Syracuse
By then maybe you can say you know something.
[edited for length — mdc]
The drive by the commercial bankers to expand their savings accounts has a totally irrational motivation, since it has meant, from a system standpoint, competing for the opportunity to pay higher & higher interest rates on deposits that already exist in the commercial banking system.
The shift from demand to time deposits has converted spendable balances into stagnant money. This transfer added nothing to the Gross National Product, and nothing will be added so long as the funds are held in the form of time deposits. Shifts from transaction deposits, to time deposits, simply increases the aggregate costs to the banking system and adds nothing to the systems income.
But it does profit a particular bank, Citibank for example, to pioneer the introduction of a new financial instrument such as the negotiable CD until their competitors catch up; and then all are losers. The question is not whether net earnings on CD assets are greater than the cost of the CDs to the bank; the question is the effect on the total profitability of the banking system. This is not a zero sum game. One banks gain is less than the losses sustained by other banks.
How does the FED follow a “tight” money policy and still advance economic growth? What should be done? The money creating depository banks should get out of the savings business — gradually (REG Q in reverse-but leave the non-banks unrestricted). What would this do? The commercial banks would be more profitable – if that is desirable. Why? Because, the source of all time/savings deposits within the commercial banking system, are demand/transaction deposits (the primary money supply)- directly or indirectly through currency or the banks undivided profits accounts.
That is, money flowing “to” the intermediaries (non-banks) actually never leaves the com. banking system as anybody who has applied double-entry bookkeeping on a national scale should know. The growth of the intermediaries/non-banks cannot be at the expense of the commercial. banks. And why should the commercial banks pay for something they already have? I.e., interest on time deposits.
Dr. Leland James Pritchard (MS, statistics – Syracuse, Ph.D, Economics – Chicago, 1933) described stagflation 1958 Money & Banking Houghton Mifflin,
Profit or Loss from Time Deposit Banking — Banking and Monetary Studies, Comptroller of the Currency, United States Treasury Department, Irwin, 1963, pp. 369-386.
Modern Money Mechanics
http://landru.i-link-2.net/monques/mmm2.html
H.8-Assets & Liabilities of Commercial Banks
http://www.federalreserve.gov/releases/h8/Current/
H.41-Factors Affecting Reserve Balances
http://www.federalreserve.gov/releases/h41/Current/
Definitions & figures are not exactly comparable between the 2 periods. Also, some figures are only available on a SA basis or a NSA basis
Steve Bannister On my machine in the office I use EViews, LIMDEP and SAS Econometrics & Time Series/Operations Research package. But those are all pretty pricey (especially SAS!) so for home use I like to use GRETL, JMULTI and occassionally EZ-Reg (it has some features that are not widely available). Aside from being free, those three also have the blessing of Econometrica and have been used in peer reviewed research. Wiley has a nice book on time series analysis that’s oriented around JMULTI. My favorite is probaby GRETL, which has a nice “R” interface feature similar to GROCER.
Menzie I hope you’re right about the possibility of a silver lining in exports, but to be honest relying on error correction models has never given me a warm and fuzzy level of comfort. Yes, I know that’s standard practice, but somehow the idea relying on a technique that derives its inspiration from the image of a dog dragging a drunk towards home has always left me a little anxious.
Steve Kopits You’re forgetting that without large deficit spending we would have an immediate loss in output at least equal to the size of the deficit. Deficit financing simply smooths out the pain over time. Sometimes I get the impression that you see the deficit as some kind of luxury that we can’t afford. The truth is that it’s something we cannot afford to not do.
Bryce Why do you refer to government spending during a deep recession as a “burden?” The burden is too much savings and not enough demand for that savings. If it weren’t for government spending the burden of excess savings and excess capacity would be a lot worse than it already is. Government spending is only a drag on the private sector if private sector resources are fully employed and government spending crowds out private investment. That’s not the case today. In fact, it’s just the opposite. Government spending actually crowds in private sector investment, which is a good thing. But there’s hope for you yet. Look at me…just because I learned my econ at a freshwater school doesn’t mean I’m incapable of learning good macroeconomics.
CoRev What can I say my friend? You never disappoint. Ask yourself what would happen if the government didn’t borrow. The government should borrow because no one else wants to. There’s too much savings right now and not enough private sector demand. The fact that the government can borrow long term at 2.48% (today’s closing price) ought to tell you that people are lining up to buy government debt. And that fact alone answers every one of your questions.
The US federal gov’t borrowed a cumulative 30% of private nominal GDP for fiscal years ’09 and ’10, and all we got was 3.5% (vs. long-term avg. 6-7% and 5% since the ’90s-’00s) nominal yoy “growth” of private sector GDP and -1.9% avg. annualized growth of private GDP since Q2 ’08.
At the current debt-deflationary, slow-motion depression rate of gov’t borrowing and spending, the US gov’t will have borrowed and spent an equivalent of 100% of today’s private nominal GDP after ’15-’16 and 100% of total nominal GDP by the end of the decade.
Note that since ’00 the cumulative loss of real GDP growth from the long-term 3.3% trend has been ~15-16%, which is roughly where Japan was in the late ’90s.
At the trend rate of deceleration of post-’00 trend real GDP, the US real GDP will have lost 30% of growth that otherwise would have occurred at the pre-’00 trend rate, a loss equivalent to that of the 1830s-40s, 1890s, 1929-33 and 1938-39, and that of Japan since ’90. Adjusted for US population growth, the cumulative per-capita loss of real GDP growth will be around 40%.
consequently, we can expect an equivalent decline in local and state gov’t revenues and cuts to social services, infrastructure, public employees salaries and benefits, and pension payouts and retiree benefits.
An increasing share of local and state gov’t entities will file bankruptcy, unincorporate, and default on obligations, disbanding fire and police services, transportation infrastructure, and so on.
Peak Oil, falling net energy, peak Boomer demographic drag effects, and fiscal constraints will exacerbate the debt-deflationary slow-motion depression.
http://www.bea.gov/newsreleases/national/pi/2010/xls/pi0710.xls (See table 1.)
Moreover, private wages now make up just 41-42% of US personal income, whereas rentier income, gov’t wages, and personal transfers combined make up 45% of personal income and 110% of private wages. Thus, the US economy has become increasingly dependent upon rentier income, gov’t salaries and benefits, and public transfers at the expense of proprietors and private workers.
Yet, what we hear most is how much gov’t is doing or not doing to “stimulate the economy”, or how much this politician or another is proposing to borrow and spend to “get the economy going again”.
How much more debt and more gov’t spending will it take?
And how much more public and private debt is required as a share of income and GDP to grow gov’t wages, benefits, transfers, and public and private interest to the rentier caste?
Are we really that daft?
Keynesianism is an artifact of the reflationary/inflationary peak Oil Age era of growth made possible by abundant supplies of cheap oil and other fossil fuels. The era of cheap oil, and thus that of economic (and uneconomic) growth, is over.
Prepare for the “Greatest Depression” as part of the Great Regression back to Olduvai, friends.
2slugbaits: Most of the forecasted increase is due to the change in rest-of-world GDP; using a differences only specification (with four lags of output, exchange rate) leads to an implied growth rate of real exports of 18.5% (q/q, SAAR) instead of 24.5%.
“We are at a point where every discretionary dollar spent is borrowed. How long before the rest of the world catches on????”
Does anyone who writes something like this actually pause to think about what they’re saying? Which is, essentially, that the rest of the world, including the Chinese and Japanese and Brits, don’t have the same information as a random commentator on an econ blog, and that they’re too stupid to know a lick about any of these issues.
Nemesis The US federal gov’t borrowed a cumulative 30% of private nominal GDP for fiscal years ’09 and ’10, and all we got was 3.5%
And what would GDP had been without that government borrowing? Go ahead…guess. Hint: Government spending is one of the four major components of GDP.
Keynesianism is an artifact of the reflationary/inflationary peak Oil Age era of growth made possible by abundant supplies of cheap oil and other fossil fuels.
What??? Keynesian economics is primarily about managing aggregate demand. And the truth of Keynes’ insights is especially apparent in an age of disinflation or deflation, which is what we have today. I don’t know where you’re getting this reflationary/inflationary stuff.
2slugbaits, I appreciate your reply.
I certainly see why many would suffer the illusion that the gov’t can borrow 13% of GDP without ‘crowding out’ private investment. The ‘idle resources’ are a temporary phenomenon flowing from mistakes, systematic misallocation of resources.
The right goal is to foster efficient allocation of resources. Aggregate demand will then in a reasonable amount of time take care of itself.
That is the real debate: Efficient allocation of resources versus manipulationg aggregate demand. Negative real interest rates, massive gov’t intervention into the economy, & growth of the gov’t as a portion of the economy [which must be ultimately paid for by that economy’s private scetor] all distort resource allocation badly from what a free people would make it.
BPO, thank you for your response. I cherish being called stupid by someone who knows nothing about me. What it shows me is that my comment has hit home and motivated another foot soldier of temperance to anger.
“constrained by political gridlock”
Isn’t gridlock a good thing for equities? Then it should be good for the overall economy, or is it only good in a strong economy?
What has changed also, compared with “old times” are the public expectations of what the gov’t should do to help the economy, and in general, the unemployed people.
Now keynesianism is really not a “choice” as was during Hoover times, unless you do not matter about popular radicalism, or really do you think that “History is over” as Fukuyama says?
How many millions of workers must be looking for food in garbage bins before the gov’t make “something” for them? 20% of the labour forces as in FDR times?
The results of the “free markets” trends was the exponential growth of Ponzi scheme business, starting in the CDS, CDO, other derivatives, etc… that makes much more “money” than the “normal” banks and the Fed could do, but damaging the whole world economy for a long period
Quite sad at how the GDP is now just government spending. The U.S. has no real growth and the GDP has and always will be based on an illusion: borrowing, spending and credit. No real production, investment and savings.
I wonder if any of the Ds and Rs will bring this up in November. I highly doubt it because that means telling the truth to the uneducated American masses.
Menzie,
Many thanks for the MA ppt — useful info. I must have looked around 2005 and looks like they have since retooled the model.