I have been working on a project with UCSD graduate student Cynthia Wu to try to assess the potential for the Federal Reserve to continue to influence long-term interest rates even when the short-term interest rate is essentially at zero. I’ll be relating the conclusions from that research in a few days. But first I’d like to call attention to a new data set that we developed on the maturity structure of publicly-held debt which may be of interest to other researchers. As Paul Krugman likes to warn, this one is just for the wonks.
We began, as do Greenwood and Vayanos (2010), with CRSP data for outstanding Treasury debt by individual CUSIP number to calculate outstanding nominal Treasury debt on different securities at the end of each month. We found numerous discrepancies between the sum of these individual entries and the sum of nominal bills, bonds, and notes recorded in the Haver database, which we were able to attribute to assorted data entry errors and omissions in the CRSP database. We were able to identify and correct these errors so as to reduce almost all discrepancies to less than $200 M by hand comparison of the CRSP numbers with individual copies of the Monthly Statement of the Public Debt of the United States. From these we were able to construct the face value of non-TIPS marketable outstanding debt with maturity measured in weeks from the last Friday of the month, rounded up.
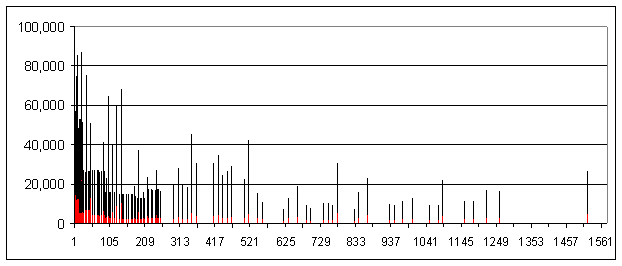
We separately constructed rough estimates of how much of the securities of each maturity were held by the Federal Reserve. The resulting data structures for outstanding Treasury debt and Fed holdings take the form of (240 x 1577) matrices, with rows corresponding to months (ranging from January 31, 1990 to December 31, 2009) and columns corresponding to maturity in weeks up to 30 years. The following figure displays the information from the December 31, 2006 rows of these two matrices.
 |
The next graph provides a sense of some of the time-series variation, plotting the average maturity of debt held by the public for each month. Average maturity dropped temporarily in the mid-1990s and began a more significant and sustained decrease after 2002, rising again with big issues of long-term debt beginning in the fall of 2008.
 |
Our database also includes other items that may be of interest to researchers, such as daily constant-maturity Treasury yields and some measures we developed from the maturity structure that both theory and empirical analysis suggests can be helpful for predicting changes in interest rates for different maturities. Click here to access the database.
Interesting post – you have all the raw material to illustrate a point I’ve been trying make to make re: QE2. Once the Fed’s Treasury holdings grow beyond that which is needed to supply the market’s desire to hold cash (ie non-interest bearing Federal Govt Debt), their actions with regards to “quantitative easing” are effectively altering the maturity of outstanding Treasury Debt.
Simply put, QE involves the Fed taking an interest bearing security (a bond) out of the market, and financing it with non-interest bearing debt of instantaneous maturity (ie cash). This necessarily shortens the maturity of outstanding publicy held debt, a reality masked by the way that calculation is usually done (ie omitting cash). If one doubts this, simply think about what the maturity of outstanding govt debt would be if the Fed bought ALL of it – ie zero.
There must be some tipping point at which such debt management irresponsibility undercuts the market’s confidence in the governments ability to refinance itself short of forcing actors to continue to hold non-interest bearing debt (cash) beyond that point at which they would like to redeem it. In other words, there is most certainly some level of QE at which confidence in the Dollar collapses. Could it be that the Fed is about to go searching for this point, in the hopes that in their infinite wisdom, they can just “kiss” that tipping point without pushing the Dollar toward oblivion?
Isn’t this topic of Fed interest rates irrelevant to the average consumer who has his interest rates set by credit card companies? The real level of interest rates for the bottom 75% of earners is not the Fed rate. Look at your own credit card interest rate. Check out what small businesses are paying for loans. Go to a different neighborhood and see how many people need the services of payday lenders. Perhaps the Fed rate has an impact on bank profits and bonuses, it has little to do with what real people are paying. If the Fed were to limit interest rates charged by the banks or other lenders, that would have a greater affect on the real economy than paying banks for taking federal dollars.
One interesting application of this would be to see how changes in not just the aggregate amount of debt but rather the maturity structure of public debt interacts with private credit markets.
This is certainly interesting work.
Wouldn’t duration be more useful than average maturity?
The U.S. Treasury ought to reimburse you for those efforts. How can they operate with out it?
Lord: Yes, for some purposes duration, or indeed going the step further of stripping the coupons from the principal and tracking each coupon separately, might be preferable. However, as you will see when we release the paper, one of our primary objectives was to identify sources of variation in the supplies of alternative assets which were not themselves a response to changes in interest rates, for which we felt maturity was going to be the most robust approach.
JDH:
Your figure shows the majority of the average maturity change occurs during the early-to-mid 2000s when the Fed’s monetary policy was highly accommodative. Do you see any connection between this development and interest rate “conundrum” at that time?
Yikes, JDH makes his graduate student correct 9 trillion in debt held by the public? That’s cruel.
Geithner did say he intended to try and lengthen the maturity of new debt they are financing. For the obvious reason of locking in lower rates for a longer period of time. So the data indicates we are up to about 4 years now.
If I understand my bond portfolio theory correctly, average duration is supposed to be the measure that indicates interest sensitivity of the portfolio. But when I look at bond funds, the figures for average maturity and average duration are not hugely different.
Looking forward to JDHs coming research on how much longer the Fed can bend the whole yield curve. Sounds like a challenging project.
Cruel, yes. Unusual, no.
“Rien ne se perd, rien ne se cre, tout se transforme”
Assumptions risks profile remaining the same
Upfront loaded with short maturities and a probable overlap by 2011/2012 with the bulk of private sector financial debts including the deferred maturities on LBOs.
Most likely the same profile in Europe with a dwarfing perspective of M3 (P15,P16,P17))
http://www.ecb.int/pub/pdf/mobu/mb201008en.pdf
Globally one has to wonder how the banks liquidity ratios are looking like (duration mismatches) in spite of all governments efforts to see this problem contained.That include all prices distortion in all markets.
May I naively ask the question: Are banks using the free money they are getting from the Fed–and thanks to the Fed, the hapless CD holders–to buy long-term Treas. debt? To wit, mismatching maturities?
Bryce
They have to have something on the balance sheet, otherwise they wouldn’t be banks.
They securitized all their loans and sell those off. It’s like chefs who won’t eat their own cooking. But then they had to buy someone else’s securitized loans back so they could have some maturity mismatch and make some money…. so they could be a bank. burp.
Can you please make the data available in open, non-proprietary format, for example as comma-separated (CSV) text files? Publishing them in Matlab’s and Excel’s proprietary formats makes it cumbersome to get at the data to those who choose not to work on Windows and/or Matlab! For example, I work in Mathematica, Python, and C on a Mac platform and while there are tools to convert/extract the proprietary data formats, it’s cumbersome and basically a waste of time. Better to just export the data as flat text files at the source, particularly in a public context!
Ouch….the average is pretty short term! Seems like a risky strategy for Treasury.
“In other words, there is most certainly some level of QE at which confidence in the Dollar collapses. Could it be that the Fed is about to go searching for this point, in the hopes that in their infinite wisdom, they can just “kiss” that tipping point without pushing the Dollar toward oblivion?”
Maybe they aren’t so sure of their “infinite wisdom.” Maybe that’s why they are holding back acting in the face of very high unemployment.
James, echoing HS, I have Excel but not Matlab. Could you publish in an open format for your database?
David
PS – To show you some of my work on the topic:
http://alephblog.com/2009/12/23/my-tips-treasuries-and-inflation-model/
R is able to read matlab v5 files:
library(R.matlab)
z_public < – readMat(“z_public.mat”)
str(z_public)
[edit from JDH: no space between < and – , but I don’t know how to make html display this]
Bill West: Thanks for the tip, it’s most helpful. I’ve also added it to the database description page as another option. Sorry that I don’t know how to make the < and – symbols appear next to each other the way they should in html.
HS: See Bill West’s tip for MATLAB. As far as Excel is concerned, have you considered OpenOffice as an alternative?
One issue is I’m not sure that all software would correctly handle 1577 elements in a row for csv files, and for Excel, it’s nice to have standard date formats.