The Employment situation release for October surprised on the upside: the Bloomberg consensus was for 60,000 increase and the actual was 151,000. And yet I receive emails from the JEC-Republican stating:
“If we are to jumpstart this sub-par recovery, President Obama must change course now,” said U.S. Congressman Kevin Brady (R-Texas), the top House Republican on the Joint Economic Committee. “With the jobless rate stalled out at 9.6% in October and economic growth at an anemic 2%, we are unlikely to see real improvement in our economy until the President orders a full stop on his economic policies and charts a new course.”
Oh, well. On to data.
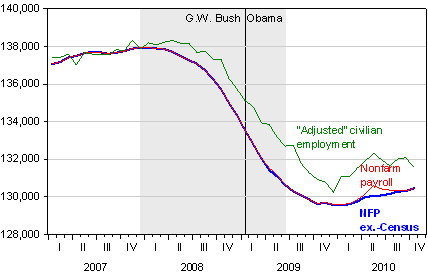
Figure 1 displays NFP, NFP ex.-Census, and the household series adjusted to conform to the payroll concept.

Figure 1: Nonfarm payroll employment (red), nonfarm payroll ex.-Census (bold blue), and civilian employment/household series adjusted to conform to NFP concept (green), all seasonally adjusted, 2007M01-2010M10. NBER defined recession dates shaded gray. Source: BLS, employment situation, October release, via St. Louis Fed FRED II, BLS, NBER, and author’s calculations.
Of course, the standard caveats apply — this is only one observation, and sure to be revised next month. However, the October figures incorporate upward revisions in the previous months’ employment levels. If sustained, then eventually unemployment will decline.
Just for perspective, of the net total 7.5 million net job loss that occurred from 2007M12 to 2010M10, 3.6 million occurred by December 2008 (the last full month of the Bush Administration). The net loss from 2009M01 to 2010M10 was 3.1 million, incorporating a net gain since 2009M12 of 0.9 million.
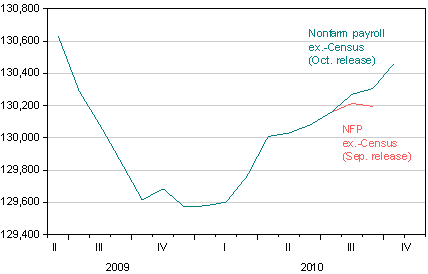
Figure 2 presents a detail of the ex.-Census figures.

Figure 2: Nonfarm payroll employment ex.-Census, October release (teal), nonfarm payroll ex.-Census, September release (salmon), seasonally adjusted, 2009M06-2010M10. NBER defined recession dates shaded gray. Source: BLS, employment situation, October release, via St. Louis Fed FRED II, NBER, and author’s calculations.
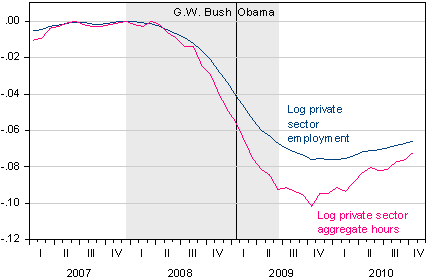
Finally, private sector employment is rising — 1.5% at a 3 month annualized rate (in log terms) — but aggregate hours are rising even faster, at 3.6%.

Figure 3: Log private sector employment (dark blue), log private sector aggregate weekly hours index (pink), October release, seasonally adjusted and normalized to 0 at 2007M12. NBER defined recession dates shaded gray. Source: BLS, employment situation, October release, via St. Louis Fed FRED II, NBER, and author’s calculations.
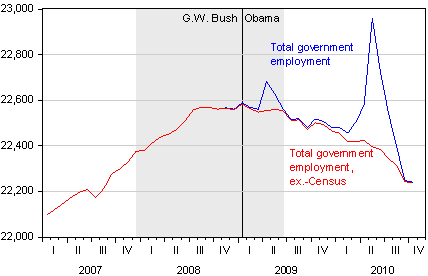
Finally, an observation on the trend in total government employment. It continues to shrink.

Figure 4: Total government employment (blue), government employment ex.-Census (pink), seasonally adjusted. NBER defined recession dates shaded gray. Source: BLS, employment situation, October release, via St. Louis Fed FRED II, NBER, and author’s calculations.
Several caveats here: MA, CR [Izzo/WSJ RTE] [RA/Free Exchange] [Economists View] [Paul Krugman].
Just in time, to have no effect on the Election.
The AH’s at the top are AH’s.
At the peak in December 2007, there were a total of 137.951 million jobs in the country (115.574 million private sector). In February 2009, which is the earliest date it is possible to put the credit or blame on Obama (the surveys are taken mid month, ie before Obama was sworn in on 1/20/09 so the 1/09 numbers have to belong to Bush), there were a total of 132.823 million total jobs (110.254 million private sector). Thus at the most one could blame Obama for the loss of 2.361 total jobs and 2.032 million from the private sector. Keep in mind that the ARRA did not pass until the end of February, and I don’t think it is reasonable to assume it could have had any effect on the overall economy before May of 2009. By the time Obama took office, we were already down 5.128 million jobs from the 12/07 peak in total jobs (and down 5.320 million private sector jobs). The total number of jobs in the economy bottomed a year ago and we are now up 874,000 year over year (1.099 million private sector). To put that in perspective, over the entire 8 years that Bush was in the White House (measured 2/01 to 2/09) the economy produced a grand total of 293,000 jobs. Yes I would like to see the pace of job creation pick up, but to put all of the blame (as apparently the electorate does) on Obama just does not square with reality.
to put all of the blame (as apparently the electorate does) on Obama just does not square with reality
I don’t blame Obama for the state of the economy, but he owns the choices he made in response to the economic situation. Those choices shape my forward-looking assessment of his policies and preferences.
But, my critical views aren’t coming from the Tea Party perspective that prevailed in so many areas of the country on Tuesday.
So at this rate, we’ll be back to pre-recession employment levels just in time for the, um, midterm elections of 2018. Note that that’s “employment”, not “unemployment”, as the population is still growing in the meantime. We desparately more large-scale stimulus, and we ain’t gettin’ it.
More generally, I don’t think it’s useful to blame either Bush or Obama. Look at the longer-term trends, and blame Reagan. Real wages and household debt show significant turning points 30 years ago. Supply-side economics has put all of the gains of productivity into the hands of the capital-owners rather than the workers, who were encouraged to keep borrowing so that aggregate demand could keep up. Until we couldn’t/wouldn’t any more.
reading others analysis of the employment report, the Household Survey does not track with the Establiahment Survey, and the difference appears to be that pesky birth/death adjustment. Yes, we have some seasonal hiring going on, but full time employment continues to take a hard hit.
Wow lilnev…”blame Reagan”. You are not going to be the next Chairman of the Fed (or anything else prolly) with an attitude like that.
Kudos alround then
Good contrast between the missive(s) from the ranking member of the Republican Finance Committee and this thread (ok, most of this site, most of the time) of active, curious minds noodling around.
U go gang
lilnev: I agree (as Krugman notes) that this positive report is still far from sufficiently positive, given the deep hole we were driven into. But I am hopeful that subsequent numbers will show some acceleration (although, I am cognizant that after post-financial crises, growth is typically very slow).
Terry: I do find it interesting that the conservatives who clamored for and held up high the alternative adjusted houshehold series plotted in Figure 1 have not this time around mentioned at all the fact that job losses have been much less under this measure. Coincidence? I think not. I still think given the higher variability in the household series, I think it wise to put more weight on the establishment series. See [1] [2], among others.
Menzie,
You fall into the blame-Bush-exhonerate-Obama crowd. I belong to the blame-Bush-blame Obama crowd. That said can you give me one Obama policy that is not simply an extension of Bush policy? (Let me eliminate health care right off the bat because with his prescription drug bill Bush sent health care flying, of course Obama has sent them soaring!) The area where FDR and Obama are most alike is taking their predecessor’s policies as their own and expanding them. FDR not only used Hoover policies he has Hoover’s economic team draw up the budgets and the bank closing.
It may be hard for you to grasp but our current economic condition is not partisan. It is owned by both parties, and they is why the Tea Parties exist.
The Tea Partiers have served their purpose. And now those who funded and organized their ‘events’ will move on to bigger game.
Why Republicans will not shrink government.
I think there’s an excessive tendency on both sides of the aisle to assign blame or credit to the US President for the state of the economy. If not Bush and Obama someone will even go all the way back to Reagan.
Look, the trend of increased economic inequality predates Reagan. The trend of lower economic growth showed up before Reagan as well. Presidents just happen to be there.
I belong to the “There are deeper forces at work” crowd. Among those forces:
These forces do not get the credit (or blame) they deserve because they are not people who lead one of the political tribes. The human cognitive bias to see individual humans as causes of phenomena blinds people to real causes.