And the first three months of 2012 were also the warmest first quarter in the contiguous United States, according to NOAA.
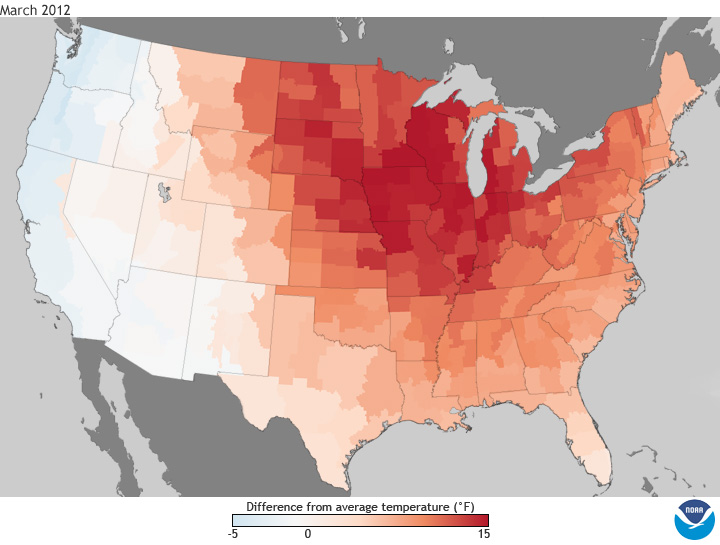
Figure 1: Temperature departures from the 30-year average of 1981-2010 on a climate division level. Source: NOAA, accessed on 9 April 2012.
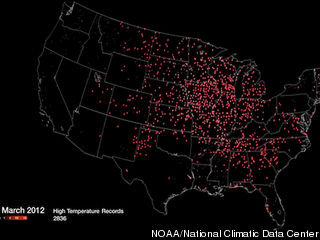
For a fascinating video showing how the records were broken, over time, geographically, see this NOAA animation:
.
From FoxNews:
In March, at least 7,775 weather stations across the nation broke daily high temperature records and another 7,517 broke records for night-time heat. Combined, that’s more high temperature records broken in one month than ever before, Crouch said.
“When you look at what’s happened in March this year, it’s beyond unbelievable,” said University of Victoria climate scientist Andrew Weaver.
NOAA climate scientist Gabriel Vecchi compared the increase in weather extremes to baseball players on steroids: You can’t say an individual homer is because of steroids, but they are hit more often and the long-held records for home runs fall.
…
RealClimate provides an explanation of how global climate change can, by inducing a spread-preserving mean shift, result in a higher probability of extreme events such as this March’s high temperature. WARNING: For those who do not believe in Classical statistics, DO NOT READ.
For those who do not believe in anthropogenic global warming, don’t worry. With vigorous enough purging (c.f. Ryan Plan), we can be rid of these troublesome atmospheric scientists (this is the “ignorance is bliss” approach). Also, no need for those geologists, as the market can step in to do the earthquake prediction.
For previous last year’s attempt to cut NOAA funding, see here (Republican proposals for FY2011).
For the small price of slavery, “‘Yes, we plead guilty … ‘Skeptics will proudly celebrate … Climate Depot takes full responsibility for the fate of your children and grandchildren from any future man-made climate catastrophe” (“Australian PM warns skeptics ‘are too ‘dangerous to ignore’ and are ‘holding the world to ransom’”, By Marc ‘EIB’s corporate whore’ Morano, Climate Depot Editorial”; web crimes by Joseph D’Aleo; icecap.us, 11/6/09).
However, crime has yet to pay.
Brilliant minds think alike, Menzie. I was looking at the jobs numbers to see if the weather had any effect there, and it seems to have been helped more in February than March, although Home Depot and bars/restauratnts seemed to hire up a bit last month.
Can’t say I was complaining about it up here in Wisconsin. Not when the UW Terrace opened up 3 weeks ahead of schedule! (We’re back around normal for this month, just a bit above average)
The first 3 months of last year were the wettest in 117 years for much of the same area that experienced the high temperatures this year.
http://www.ncdc.noaa.gov/temp-and-precip/maps.php?ts=3&year=2011&month=4&imgs%5B%5D=Statewideprank&submitted=Submit
The winter prior [2010] was one of the coldest on record for the whole southeast.
http://www.ncdc.noaa.gov/temp-and-precip/maps.php?ts=3&year=2010&month=3&imgs%5B%5D=Statewidetrank&submitted=Submit
And all of this proves?
Okay, I’ll answer that. Absolutely nothing.
This year’s very warm winter in the U.S. was balanced by a miserably cold winter in Europe and western Asia… where even fruit groves in Spain froze… the coldest weather in 60 years.
The reason for all of this:
http://hallofrecord.blogspot.com/2012/01/global-warming-or-arctic-oscillation.html
Now back to economics for which this blog provide interesting discussions.
I blame George Bush.
Let me know when the economics happens again.
For those who DO believe in Classical statistics, See the 2012 IPCC Special Report on Extremes and disasters
For those interested in studying BOTH sides of the issue, see:
IPCC Confirms: We Do Not Know If The Climate Is Becoming More Extreme
When you do, you may find you need to use Pielke’s A Handy Bullshit Button on Disasters and Climate Change
While we in the US had a warm Winter this was contradicted by cold, some of it extreme, in other parts of the world. And with that we have weather.
On the climate front we are approaching fifteen years of stable and/or cooling temperature anomalies. Now that is inconvenient.
I am forever amazed at the arrogance of climatologists claiming the past ~150 years tell us anything significant about the planet’s climate. The story is that this heating or its rate of change is unprecedented! Really, really unprecedented.
Reality is different. Each succeeding warm period in the past intraglaciation has been cooler than the one preceding. This graph shows the temperatures for this period, the Holocene: http://upload.wikimedia.org/wikipedia/commons/c/ca/Holocene_Temperature_Variations.png
Notice the unprecedented nature of today’s warming.
So whenever we see these scare articles from Menzie and the other “true believers” just remember the actual long term reality.
For those who want us to get back to economics, remember this movement wants to change the whole economy of the planet to save it from the evil of mankind and his warming.
“A paper published in Quaternary Science Reviews finds that, contrary to AGW predictions, the frequency and severity of weather extremes was similar to the present during the Medieval Warming Period and Little Ice Age.” (H/T Hockey Schtick http://hockeyschtick.blogspot.com/2012/04/paper-extreme-weather-was-as-common.html)
Quaternary Science Reviews Vol 30, # 27–28, December 2011, Pages 3947–3959
Combined dendro-documentary evidence of Central European hydroclimatic springtime extremes over the last millennium Ulf Büntgena, et al
Oh boy, here we go again :))
For those who do not believe in anthropogenic global warming, don’t worry. With vigorous enough purging (c.f. Ryan Plan), we can be rid of these troublesome atmospheric scientists (this is the “ignorance is bliss” approach).
Villify anyone who doubts that the senstitivy of climate to man-made CO2 is as high as the IPCC and its minions claim.
The radicals have done such a good job of linking “global warming” to “man-made” that the average person thinks “man-made” whenver the phrase “global warming” is uttered.
Bruce and David have a nice summary.
North Amercia was warm, but the global view looks pretty flat since 1998 but CO2 has risen substantially since then. Amazing how natural effects dominate the effect of CO2.
http://www.ncdc.noaa.gov/sotc/service/global/global-land-ocean-mntp-anom/201001-201012.gif
Best. Winter. Ever. If this is global warming, I want more of it.
Between the very cool summer we had last year, and this nonexistent winter, my utility bills have been stupidly low. I had literally hundreds of more dollars to spend or save last year because of the weather.
I do think that the areas in red in Menzie’s map are going to have a pretty severe drought this year. Buy corn and bean futures now.
Has this been paid by Al Gore ?
Thought this guy has already cashed out and lives in St. Barth on his multi-million dollar yacht surrounded by hot bunnies (after divorce, well).
Best winter ever.
Johannes: No, unlike some people, I do not shill for, say, the petroleum industry. And I do not consult for NOAA, USGS, or other agencies that have been on the chopping block; I just think we should know about tornadoes and earthquakes, given that I have a lived a large chunk of my life in the Midwest — where tornado frequency seems to be on the rise (surprise!) — and California (where earthquakes are common).
Memzie claims: “given that I have a lived a large chunk of my life in the Midwest — where tornado frequency seems to be on the rise (surprise!)”
but reality shows: http://www1.ncdc.noaa.gov/pub/data/cmb/images/tornado/clim/EF3-EF5.png Perhaps Menzie could model the tornado results shown above, and then show an increasing trend line. Dunno, since that is the preferred method for climatologists. Never worry about or deal with real data.
BTW, anyone notice the site the from which data was drawn?
Blind belief is just that. Blind belief.
While we are reviewing weather and US temperatures here’s even another view: http://media.oregonlive.com/oregonian/photo/2012/04/gs31hott110-02jpg-0372b20f0c42d5a1.jpg
Is it just me or given the context is CoRev responding with NOAA data just a bit amusing…..
CoRev,
Sorry, temp has not been flat since the local high of 1998. Argument could be made for about five years after then, but the global trend has clearly been up since then. Why so people like you keep repeating this sort of falsehood?
OTOH, in the near term indeed global warming is good for the economies of both the US and China. The biggie is lower winter heating bills outweighing a variety of negative effect. This will hold for about another 1 degree C of warming. After that the numerous negative effects start to outweigh those positives. As it is, this fact about the US and China probably explains more than anything else why Copenhagen was such a flop.
Menzie, you do know that this weather is because of quasi-cyclic ocean circulation patters and high UV from the sun?
The earth’s surface temperature is moderate, barely above baseline.
Of course, NOAA is a great organization, and cutting funding won’t improve its politics.
When funding is cut in government, usually the most basic and important operations are what’s cut. Pet projects continue on and they base their request for more funding on their lack of performance “because of the cuts”.
Rocket Scientists vs NASA:
Select excerpts from the letter:
■“The unbridled advocacy of CO2 being the major cause of climate change is unbecoming of NASA’s history of making an objective assessment of all available scientific data prior to making decisions or public statements.”
■“We believe the claims by NASA and GISS, that man-made carbon dioxide is having a catastrophic impact on global climate change are not substantiated.”
■“We request that NASA refrain from including unproven and unsupported remarks in its future releases and websites on this subject.”
http://wattsupwiththat.com/2012/04/10/hansen-and-schmidt-of-nasa-giss-under-fire-engineers-scientists-astronauts-ask-nasa-administration-to-look-at-emprical-evidence-rather-than-climate-models/
March UAH temp anomaly: +0.11 C. Not much, really.
aaron,
I love it when people who have no idea what they are talking about lecture other people on anything. There is no trend in UV. See Hicke, Slusser, Lantz, Pascual, Journal of Geophysical Research, 2008, vol. 113.
Also, while changes in ocean circulation can influence climate, and have done so in the past, claiming this is what drove the March temps is very far from established. The link from anthropegenic CO2 to global temp may not be as strong or certain as many claim, but your certainty about the alternatives sounds like something from Fox News.
No trend, this is a recent anomaly. I hate it when people act self-righteous and condecending and have no idea what they’re talking about.
Barkley,said: “Sorry, temp has not been flat since the local high of 1998. Argument could be made for about five years after then, but the global trend has clearly been up since then.”
Perhaps you missed this article and chart: http://media.oregonlive.com/oregonian/photo/2012/04/gs31hott110-02jpg-0372b20f0c42d5a1.jpg
Data, for Jay11, is also from NOAA.
Barkley also insists: “Also, while changes in ocean circulation can influence climate, and have done so in the past, claiming this is what drove the March temps is very far from established. The link from anthropegenic CO2 to global temp may not be as strong or certain as many claim, but your certainty about the alternatives sounds like something from Fox News.”
So if “The link from anthropegenic CO2 to global temp may not be as strong or certain” then warming is from –wait for it–
alternatives!!!!
Barkley, since we have been warming since the past glaciations, with squiggles relating to event like the “Little Ice Age” what is is it you think is happening?
What amazes me is how few really understand the simplest math associated with ACO2. Here’s a hint: Temps have risen ~.7C in the past ~150 years. 95% of the greenhouse effect is due solely to natural water vapor. Of the remaining 5%, only 0.2% to 0.3% of the greenhouse effect (depending on whose numbers you use) is due to emissions of carbon dioxide and other gases from human sources. We know that GHGs are not the sole contributor to warming. The impact of GHGs on temperatures is Still to be precisely determined.
Do the simple math! Even if the total increase is due to ACO2 that can only be (~.7C times ~.03%), and what we do know that total warming from CO2 is not a reasonable assumption. But economists fail to do the simple math. Its all about saving the planet! From what and for whom?
Here’s Dr Pielke Sr’s take on the press announcement for this phenomenon: http://pielkeclimatesci.wordpress.com/2012/04/10/attrbibution-of-the-warm-winter-to-global-warming-an-example-of-the-mistatement-of-reality-by-some-climate-scientists/
This is just one extract from the article: “My Comment: Jim has, as with Andrew Weaver, failed to quantify his statement with real world observations as shown in the figure at the top of this post. This figure shows that much of the planet, in terms of areal extent, was cooler than average….” (My emphasis)
aaron,
I just googled March ultraviolet radiation. Nothing came up at all. Do you have a source for your claim that there was an “anomaly” in March for UV? Oh, I googled that one as well, with also nothing showing up. Whatever source you might have does not seem to be visible in cyberspace. You might want to get more reliable sources before you start making claims about what other people know.
CoRev,
Well, at least you provide some sources (wow, a photo), although again going to the sources shows that the trends are there, although there are clearly year to year oscillations.
That I am willing to say that we are not sure of the strength of the anthro-CO2 effect is quite different from saying that there is none. Sure, lots of things affect all this, even if some commenting on this may deny that. So what? It is the people denying any link who are without data supporting their claims. Do you (or aaron) have any evidence to support just which of these alternatives are responsible for the warming that is occurring?
BTW, here is the big picture according to my friend and prominent global warming “skeptic” of the Cato Institute (who accepts that warming is happening and that anthro-CO2 is part of it, even if precisely how much is uncertain). On the one hand we have exponential growth of CO2 ambient concentrations in the atmosphere (undoubtedly due to human activities). OTOH, the direct relation between CO2 concentrations and global temp is logarithmic. Upshot is roughly a linear rise in global temps, which is in fact about what we have been seeing as the trend since the mid-1970s (and those getting all excited about 1998 are looking at an upside outlier).
Oh, and water vapor is endogenous to global warming, hack cough.
Barkley, no one has claimed no effect from CO2/ACO2. Your comment, however, that the impacts are not know is a break through for the warmist crowd. Citing CATO had no meaning, they are not part of the discussion. Even your statement: “OTOH, the direct relation between CO2 concentrations and global temp is logarithmic.” does nothing to clarify the impacts not being known, and probably adds to the confusion.
BTW, what is this supposed to mean: “Oh, and water vapor is endogenous to global warming, hack cough.” A case could be made that it is endogenous to climate, but to a specific climatic impact in general? Nope! Now if you want to make a case for DI-hydrogen Oxide being a dangerous molecule, then we can probably agree.
CoRev You pick an outlier year (1998) as the starting point and then claim that there has been no upward trend since then. You flunk the honesty test. Look, the min/max anomalies for the 7 year period 1998-2004 are 0.4109/0.6170. Guess which observation is for 1998. The mean for those 7 years is 0.536. For the 7 year period ranging from 2005-2011 the min/max values are 0.4970/0.6384, with a mean of 0.573. Now the sample size is small and the data are noisy, so we cannot claim with a high degree of certainty that there is a definite upward trend since 1998; but if you took even odds that the next 7 years will be cooler than the last 7 years, you would probably lose that bet.
Your understanding of the response function between CO2 temperature increases is laughable. Your toy model is indeed simple math…and it’s wrong. For someone who pretends to make the Gospel of Big Oil his life’s work, you show a shocking ignorance of how to correctly compute the impact of a marginal increase in CO2.
Last year (2011) was somewhat cooler than some of the more recent years. That could very likely be due to the volcanic ash and sulfur dioxide (SO2) that was released into the atmosphere over northern Europe. As you know, SO2 has a temporary cooling effect and a lot of it was dumped into the atmosphere.
David L. Hagen The Medieval Warming Period (MWP) is primarily a northern European phenomenon, not a global phenomenon. It probably was relatively warm in norther Europe at that time, but it was also probably relatively cold in central Asia. The M&M recreations of the MWP have not survived close scrutiny. M&M correctly pointed out an error that Mann made, but they failed to see the even larger error they made in their own principal components model. After correcting M&M’s error you end up with a MWP temperature much closer to Mann’s than M&M’s. But none of that stuff is very reliable anyway. What we do know with a high degree of certainty is that temperatures have increased over the last 150 years, and they are increasing at an increasing rate. And we also know that there is a physics based prediction (confirmed in the lab) that higher CO2 concentrations will increase temperatures. The concern is that it takes 100+ years to get CO2 out of the atmosphere, so there’s a long lag. There is now quite possibly a greater than 5% chance that global temperatures in 3 generations will be 7 or more degrees centrigrade higher than today’s temps. That would make the planet uninhabitable for (literally) billions of people.
Bruce Hall This past winter was also one of the driest in the country’s grain belt. Look at soybean futures. The upper midwest had very little snow and there is concern about the wheat crop.
BTW, my friend is Patrick J. Michaels, whom many do not like because of his polemics, but whose scientific remarks are carefully made and not in line with the nonsense now being peddled by so many, including quite a few here. Michaels agrees that there is global warming and that humans are at least partially causing it, but as a libertarian says that we should just adjust to it and do nothing major about it, but then he is a climatologist and not an economist, so maybe he should be more cautious on such matters.
CoRev BTW, what is this supposed to mean: “Oh, and water vapor is endogenous to global warming, hack cough.” Absent some exogenous forcing factor the amount of water vapor in the atmosphere is constant over long frequencies; e.g., annually. Water vapor does fluctuate on a 14 day cycle, but at a annual frequency it is constant. And quick…what is the derivative of a constant? And that’s exactly the effect of water vapor on temperature change acting endogenously. Now if there is an exogenous force that warms that atmosphere (e.g., CO2 or methane), then this will raise the global temperature and therefore the water vapor in the atmosphere. That can cause a feedback effect that multiplies the effect of C02 on temperature.
2slugs says: “That can cause a feedback effect that multiplies the effect of C02 on temperature.” Really!? Each CO2 molecule’s impact is amplified? Or is the temperature increased due to feedback mechanism which may or may not be associated with CO2? Say, could the Sun have any influence?
BTW, latest research shows the MWP was worldwide. You need new research!
MWP is nearly meaningless. You probably missed this earlier comment: “Reality is different. Each succeeding warm period in the past intraglaciation has been cooler than the one preceding. This graph shows the temperatures for this period, the Holocene: http://upload.wikimedia.org/wikipedia/commons/c/ca/Holocene_Temperature_Variations.png
Notice the unprecedented nature of today’s warming.”
2slugs you also make this claim: “Your understanding of the response function between CO2 temperature increases is laughable. Your toy model is indeed simple math…and it’s wrong. For someone who pretends to make the Gospel of Big Oil his life’s work, you show a shocking ignorance of how to correctly compute the impact of a marginal increase in CO2.”
1st, I do not know of what you are talking re: life’s work and big oil?
If the simple math is wrong, correct it! Your 7C is wrong. Your lab based theory is also wrong. Only in your own mind is the M&M findings considered wrong. Bet the hockey stick won’t be featured in the next report.
BTW, if the quality of the reporting doesn’t improve significantly in the next report, IPCC will lose much more credibility. It was pretty much a laughing stock after the 2007 report.
http://www.agu.org/pubs/crossref/2011/2010JD014746.shtml
http://www.atmos-chem-phys.net/11/13029/2011/acp-11-13029-2011.pdf
http://www.nature.com/ngeo/journal/v4/n11/full/ngeo1282.html
2slugs
The arguement that the current warming is unprecedeted is gettig tired.
This ikaite record qualitatively supports that both the Medieval Warm Period and Little Ice Age extended to the Antarctic Peninsula.
http://www.sciencedirect.com/science/article/pii/S0012821X12000659
The key issue for most (not all) skeptics is the magnitude of the sensitivity of climate to man-made CO2. If policy makers are going to undertake a global redistribution of wealth based on man-made CO2 emissions, then we should be witnessing a great empirical debate on that sensitivity – – Not survey results about consensus – – Not journal editors being fired for publishing articles that refute the consensus.
CoRev Your lab based theory is also wrong. Get a physics book.
Only in your own mind is the M&M findings considered wrong. Oh, then I’m sure you will be able to explain why M&M chose to calibrate their models using both low and high frequency criteria even though what they were modeling was only low frequency (10 and 50 year) buckets. This calibration biased the verification phase of their analyses towards generating false negatives. Using only low frequency calibrations to check low frequency buckets wipes out M&M’s findings and correctly deflates most of the big bump they found in the 15th century.
Say, could the Sun have any influence? So now you’re telling us that over the last 150 years the sun has been burning hotter and hotter? Hopeless. Natural variation in the sun’s output happens. Sun spots happen…or in some cases don’t happen. But solar variability and solar cycles are not trends. Learn the difference between trend components, cyclical components and irregular components.
aaron,
Really getting desperate, aren’t you? So, let us see, data from China claims the sun was dimming between 1961 and 2000. How does this explain global warming? Oh, and then another study says there are cycles of UV tied to the 11 year sunspot cycle, which might be tied to global temperature. Um, are you aware that cycles do not explain trends in this case?
None of this remotely disproves that humans are generating CO2, and that more of it tends to warm the atmosphere, even if these other factors are affecting things. Wow.
CoRev,
2slugs is right. You do not know what is meant by an endogenous effect or what is meant by a positive feedback effect. Indeed, the data on ice ages is that the movements in and out of them in terms of temperature changes was very rapid in geological terms, like 100 years or so. This is fully consistent with the existence of positive feedback effects involving endogenous variables. If you do not understand the nature of dynamical systems, please go study the subject before you make a bigger fool of yourself than you have already.
http://www.atmos-chem-phys.net/12/2469/2012/acp-12-2469-2012.pdf
“Site selection was re- stricted to the availability of the most complete UV spectro- radiometric datasets during the period 1990–2011. The anal- ysis includes the long-term variability of total ozone, aerosol optical depth and cloud fraction at the sites studied. The re- sults, based on observations and modeling, suggest that over Canada, Europe and Japan the period under study can be divided into three sub-periods of scientific merit: the first period (1991–1994) is the period perturbed by the Pinatubo,,,”
“The second period (1995–2006) is character- ized by a 0.14 % yr−1 increase in total ozone and an increas- ing trend in spectral irradiance by 0.94 % yr−1 at 305 nm and 0.88 % yr−1 at 325 nm. …”
“The third period (2007–2011) shows statistically significant evidence of a slowdown or even a turning point in the previously re- ported upward UV-B trends over Canada, Europe and Japan….”
“The third period, which refers to the last 5 yrs, might provide for the first time significant statistical and model-derived evi- dence, indicating a slowdown of the upward trends observed in the past, over the sites studied where UV-B trends seem to have undergone a turning point most probably after 2007.”
BR, you are good for a laugh. Thanks.
aaron,
OK, so there are competing studies on UV trends. One I cited from 2008 says no trends; this one says UV up from 91 to 07 and down since, assuming I have read it correctly. So what? Even if this is correct, the correlation with the global temperature trend appears to be essentially zero.
Let me remind you that your original argument was that March had high temperatures due to some increase in UV. This does not remotely support that, although to be more fair, it came out prior to March, so it says, well, zero about March.
This is the best you can do? Sorry, I am not going to respond any further to this sort of ridiculous drivel. What is it with you self-proclaimed skeptics? Why can you not make consistent and sensible arguments like Patrick Michaels (aggressive as he is with those he disagrees with such as Jim Hansen) instead of just throwing around nearly random stuff that is utterly irrelevant when not outright stupid?
Get it together, aaron, as you are merely tiresome, not even remotely amusing.
It always amazes me how willing people are to ignore an entire scientific field because they read some blog post or because it doesn’t fit in with their goals. Do you really think that science is so corrupt that 98% of a field would make false claims?
I bet if we back in time the same people denying climate change also denied that there was a hole forming in the ozone layer and that it was caused by man.
Barkley says: “…the data on ice ages is that the movements in and out of them in terms of temperature changes was very rapid in geological terms, like 100 years or so.” Agreed! Don’t tell me tell 2slugs. Its his claim of unprecedented.
Barkley, what was you point? You have name dropped and made obvious statements which are well understood. Because you made them it is truth to the masses????
Calling a system dynamic and chaotic adds what value? You confirmed what I have said about us not knowing enough. BTW, chaotic systems become less so with knowledge. Our knowledge as demonstrated by the GCMs is clearly too little at this point.
Feedbacks and forcings can cause inflection points. Claiming dynamic systems have feedbacks adds what value?
BTW, the bulk of the arguments re: Global Warming is centered on feedbacks (positive and negative). When they are both defined and measured then we will better understand how and why climate actually works. H2O in its various forms can be both.
2slugs, after trying to correct your misunderstanding of how CO2/GHGs work in the atmosphere you double down with: “Get a physics book.” You do not understand the physics. Worse, you do not understand the effect of GHGs. Slowing down the loss of specific wave lengths to slow equilibrium is not creating heat as you implied.
As far as the M&M paper, are we talking about the same paper? You appear to not even know what the paper subject and findings were.
BTW, the Sun is the originator of nearly, high ninety percentile, of all heat. Maybe the Sun has some effect on the atmosphere and its temperature.
What is obvious is natural factors can overwhelm GHG warming. Diminishing temperature peaks in the Holocene are clear evidence against your claim of warming or being “unprecedented”. Barkley’s response (also covered in sever peer reviewed articles) of the quick shifts in glacial temperatures is another against your claim of the change being unprecedented.
You, Menzie and the other “true believers” may not like it, but the wheels are off this wagon. A couple more years of cooling will put the end to the arguments over warming.
Quick! Someone tell Al Gore about Menzie’s post. Maybe, if he hurries, Al can sell his vacation 6,500 sq ft home on his beachfront property that he bough in 2010 before the oceans rise and swamp his pricey new (I’m sure, energy efficient) digs
http://www.worldpropertychannel.com/featured-columnists/celebrity-homes-column-al-gore-tipper-gore-oprah-winfrey-michael-douglas-christopher-lloyd-fred-couples-nicolas-cage-peter-reckell-kelly-moneymaker-2525.php
2slugs, just past week we have had a “peer reviewed” paper by Shakun which contradicts previous findings re: the correlation of CO2 and glaciations. It took less than a few days to take it apart as shoddy science at best.
The paper has resulted in graphs which clarify which recreate what was previously understood. Try this one: http://wattsupwiththat.files.wordpress.com/2012/04/gisp220temperaturesince1070020bp20with20co220from20epica20domec1.gif
Notice the warming? Each succeeding temperature high is followed with a lower one. We still do not know about the current warming period, but if it has stopped, then it will follow the lowering trend line.
Funny what happens when we look past the time frame of arrogant climatologists.
Global temperature? I’m talking about weather.
Re-read my comment I said because of UV, not high UV.
Your paper simply says that the US network doesn’t have enough data to call a trend. It doesn’t prove flat a 0 trend. It says the opposite, high variability and doesn’t consider solar output/solar cycles..
Sunspot proxies also suggest a decline since the late 90s.
And UV was very low past 2007.
Now that we are likely nearing a max in the next couple years, this cycle seams weaker than the last, which was weaker than the previous (by sunspots). We also know that magnetic field and UV vary much more than TSI.
All this is mute, the point has always been that low UV has likely caused weather changes before this past year. Ocean current ocillations have also likely added an extra kick to that effect. We are likely feeling the residual effects and effects of the unusual sea surface temperatures.
Oops. Moot.
Ooops. Re-read my own comment. I did say high UV. My bad.
Anon, so much misinformation and misspeak. Show us the comment where Global Warming is denied. If you cared to read and understand you would find the issues discussed here are related to feedbacks and forcings and their overall effects on temperatures.
The 98% issue has been debunked so many time it is gruesomely obvious that anyone quoting it is ignorant of most of the facts.
Re: the ozone level has changed naturally in the very recent past without mankind’s influence. you really need to do much more research instead of emoting.
Barkley, Aaron answered your snarky question and now you decide to run away. Tsk, tsk, tsk.
Barkley, you might find it interesting to know that I probably agree with you on this subject, what I object to is the name dropping and the arrogance. Knowing one climatologist does not make you an knowledgeable. Your comments show that you are probably less knowledgeable than Aaron.
2slugs, where’s that tiresome agronomic study? I ask since there is some newer research that pretty much says its bunk. How fat is the tail after the temperatures fall or stabilize? Worse, since you so thoroughly understand the fisikks of CO2/GHGs how does that confirm the stabilizing/lowering of temps? your research is about one report deep, and is used to confirm your own bias toward catastrophic impacts. Not impressed.
CoRev,
I shall reply to you on one matter. Yes, I am arrogant. I have been involved with modeling of global climate for nearly 40 years, including with several of the leading “global warming skeptics,” not just Pat Michaels, who also worked with me on a major project on this at U of Wisconsin-Madison nearly 40 years ago. Both Michaels and Fred Singer, a harder line skeptic, were on the faculty of UVa when Jim Hamilton arrived there long ago, and I knew both of them before he ever got there (I am located an hour away from there, and first met Jim when he was there).
Sorry, CoRev, but although I am an economist, I have been deeply involved with climate research for decades and first learned about chaos theory from doing so back before the term was even invented (it first appeared in print in a paper by Robert May in 1974) or was ever applied in economics (some years later). I could go on, but you would probably accuse me of more “name dropping.”
If you want to see my fuller views on all this, then buy my 2011 book from Springer, _Complex Evolutionary Dynamics in Urban-Regional and Ecologic-Economic Models: From Catastrophe to Chaos and Beyond_, particularly Chap. 11.
My skimming may have been too thin, what was China about?
(and why did one of my comments disappear?)
Thanks, Barkley.
If you really want to learn something about climate change, but don’t have the time to verify the cherry-picked bullsh*t from CoRev and aaron, visit Skeptical Science. They do a great job summarizing the real scientific research and explaining why most of the skepticism can be dismissed. Here is the link:
http://www.skepticalscience.com/
SkS is one of the worst sites to visit for truth in CC. It is far more subtle than ClimateProgress, but it is rife with misinformation, cherry picking and dropped (bias selected) data/reporting.
It is worst because it is so good at hiding the misinformation. Unless you read much of the available data/reporting daily it becomes too cumbersome to verify each claim. Being cumbersome means it is necessary to evaluate each SkS report for validity and back up.
Beware of any site that edits, bans, or selectively chooses to show comments. Regrettably that is the norm for the pro-AGW sites. Read a few and then see what I mean.
Roger Pielke Sr. discusses a new article on the cause of the Little Ice Age. Evidence that ~50 year period of vulcanism responsible for 500 years of cooling.
http://pielkeclimatesci.wordpress.com/2012/04/12/new-physics-today-article-the-triggering-and-persistence-of-the-little-ice-age-by-bertram-m-schwarzschild/
and a nice critique of that paper today…
http://wattsupwiththat.com/2012/04/13/dronning-maud-meets-the-little-ice-age/#more-61228
Menzie Chinn
Re: “how global climate change can, by inducing a spread-preserving mean shift, result in a higher probability of extreme events”
Dr. Roy Spencer provides a far more likely explanation in: New Evidence Our Record Warm March was Not from Global Warming April 13th, 2012
See Graph
Please apply your statistics expertise to comparing those two explanations and post your results.
David L. Hagen I believe you are confusing what is meant by “extreme events.” A particular kind of “storminess” is one sense of the term, and that appears to be the sense that you and Dr. Spencer have in mind. But that is not the sense in which the Real Climate article on classical statistics is using the term. The Real Climate article is talking about how a shift in the mean, a shift in the spread or a shift in both will make formerly extreme events more common. The Real Climate article is talking about how tails get fatter. And the “extreme events” they are talking about in this case are high temperatures.
You should also note that the Real Climate article links to an article that specifically addresses Dr. Spencer’s comment. In fact, it was written 2 weeks before Spencer’s comment. Given the similarity of Spencer’s comment with the New Scientist article (coincidence???), Dr. Spencer probably should have at least credited or linked to it. The problem is that linking to it would also have exposed the weakness in Spencer’s argument.
http://www.newscientist.com/article/dn21636-has-global-warming-brought-an-early-summer-to-the-us.html
In the New Scientist article they talk about the airflow from the south being the main cause of the warm March in North America. Of course, that begs the question as to why the unusual change in the airflow from south to north. One possible candidate is global warming. A shift in the mean does not mean every year will be warmer than previous years, but it does mean formerly outlier global anomalies (say above 0.61C) are no longer outlier events.
2salugs, few do not accept that it has warmed from the LIA. Few admit, are in denial, that the warming according to CRUTEM3 data, has stopped for over a decade.
Insisting or more correctly implying that extreme weather events have significantly increased. Tornadic action is actually less extreme and not increasing. The same is true for cyclonic activity. Temps for March were actually higher in the thirties, and was only the third warmest in the US since 2000 using RSS data.
Instead for fear mongering, RC and by extension you, are not correct.
Dr Spencer has been doing much recent research comparing the temperature data sets and trying to rationalize UHI within them. Some of his article start here: http://www.drroyspencer.com/2012/04/new-evidence-our-record-warm-march-was-not-from-global-warming/
2slugbaits
Please read Spencer’s post. He explicitly explains how global warming REDUCES extremes by:
http://www.drroyspencer.com/2012/04/new-evidence-our-record-warm-march-was-not-from-global-warming/
i.e., RealClimate has its models backwards from the physics.
Furthermore, there was an equal and opposite effect elsewhere that you ignored.
On MWP, there is growing evidence that it was global, (despite Mann). e.g.
More evidence the Medieval Warm Period was global
http://wattsupwiththat.com/2012/03/22/more-evidence-the-medieval-warm-period-was-global/
http://wattsupwiththat.com/2009/11/29/the-medieval-warm-period-a-global-phenonmena-unprecedented-warming-or-unprecedented-data-manipulation/
http://wattsupwiththat.com/2009/09/02/woods-hole-embraces-the-medieval-warm-period-contradict-manns-proxy-data/
See further citations in NIPCC reviews
http://www.nipccreport.org/spider/search.php?query=medieval+warm+global&search=1
Mann’s cherry picking does not science make!
So I went back and read the RC article. “For illustration, let’s take the most simple case of a normal distribution that is shifted towards the warm end by a given amount ”
What does the record show? Are extreme cold and extreme warm events more frequent? No, at least not in the Dim Coumou and Stefan Rahmstorf article, Table 1, cited in the RC article. http://sciences.blogs.liberation.fr/files/10-ans-dextremes-climatiques.pdf
I don’t see any controversy here, other than Menzi trying to sell this as a mean preserving spread, when the data point to a mean increasing shift in the distribution, (see Table 1 in cited paper)
Global warming is caused by a variey reasons. We should expect more high temp records and a wetter world, because an increase in temperature is associated with an increase in atmospheric water vapor.
The only time this becomes controversial is when you attribute the extreme warmth to humans.
CoRev The Real Climate article was a stat 101 class on how formerly extreme tail events become more common as the mean shifts and/or variance spreads with the addition of new outlier observations. The “extreme events” they were talking about had to do with temperature anomalies, not tornadoes or thunderstorm activity. You either misunderstood the RC article or did not read it.
And if you would follow this thread, you would have known that my comment to David L. Hagen was in response to the very same Spencer link that you suggested I read!!! As I pointed out to David L. Hagen, the Real Climate article provided a link that made exactly the same point that Spencer made; viz., the warm March was due to a southerly airflow. But what caused the southerly airflow? We don’t know, but one possible explanation is global warming.
BTW, if you condition the temperature variability on pre-1998 variability, then there has indeed been a statistically significant increase in temperatures since 1998. The only reason the increase since 1998 isn’t statistically significant is because temperatures over the last decade have changed the unconditional tail probabilities. You may have missed it, but that was the point of the Real Climate post.
2slugs, let’s compare Stat101 with Reality101. Acting like the weatherman who eschews looking out the windo for his models and stat packages dose not match what going on outside that ole windo.
Perhaps it was missed in your reading but menzie said: “RealClimate provides an explanation of how global climate change can, by inducing a spread-preserving mean shift, result in a higher probability of extreme events such as this March’s high temperature.”
Probability seldom trumps reality!
You also make this interesting statement: “But what caused the southerly airflow? We don’t know, but one possible explanation is global warming.” Meteorologists do of course know why. A persistent low pressure system in the Northwest and an equivalent high pressure system in the Northeast. They prevailed for nearly two weeks causing that south to north air flow and the concomitant warm March. Remarkably, the same pattern occurred ~1910. If it happened before the great rise in CO2 and warming then can we make and support the claim that it is Global Warming. Even in part?
An indication of when its warm one place the opposite is occurring some where in the same hemisphere. April 15, 2012 “BRITAIN will be blasted by another bout of Arctic weather over the next few days – with temperatures plunging to their lowest since Christmas.
Fierce winds will roar in from Lapland and the North Pole from today, making sub-zero temperatures feel even colder, hitting -5C (23F) in the North.”
The world hasn’t been particularly warm for well over a year. GW is the worst candidate for a possible cause of warm US March.
Much more likely is that ocean circulation, blocking patterns in the arctic from solar effects, and the stop of significant warming contribute to this.
The stop of temp increase is a likely cause of shifting patterns.
This makes sense regarding southerly flow.
If you claim, “Well, maybe global warming caused the extra southerly flow!”, you then are also claiming (through mass continuity) that global warming ALSO caused extra northerly flow (with below normal temperatures) somewhere else.
And no matter what anyone has told you, global warming cannot cause colder than normal weather. It’s not in the physics. The fact that warming has been greatest in the Arctic means that the equator-to-pole temperature contrast has been reduced, which would mean less storminess and less North-South exchange of air masses — not more.
http://wattsupwiththat.com/2012/04/16/usas-record-warm-march-not-caused-by-global-warming/#more-61458
tj Once again and right on cue, TV weatherman with a high school diploma, our man Anthony Watts has completely missed the point. There are two separate issues here. The first issue has to do with the way a shift in the mean changes what temperature ranges get covered at the tails. If you’ve had any statistics at all this should not be controversial. The second issue is about warmer North American temperatures. Global warming may or may not have been the ultimate cause of a warm southerly air flow. We don’t know. CoRev’s silly comment about persistent high pressure systems is trivially true, but begs the real question.
And Watts seems to be arguing with a strawman. No one claimed that “storminess” increased in March. No one said anything about “storminess.” What’s this guy blabbering about?
CoRev An indication of when its warm one place the opposite is occurring some where in the same hemisphere. April 15, 2012 “BRITAIN will be blasted by another bout of Arctic weather over the next few days – with temperatures plunging to their lowest since Christmas.
You need to do more international traveling. Europe was very cold for much of the winter, but not during March. The beaches in Spain were very nice and seasonal, as was Paris. And if Britain was cold over the weekend, so too was much of the part of North America that was warm in March. Say…you might even wonder if these radical temperature differences between March and April couldn’t be thought of as extremes. Ya think?
2slugs asks: “Say…you might even wonder if these radical temperature differences between March and April couldn’t be thought of as extremes. Ya think?” Really!? Weather has extremes? Whoda thunk it?
On a world-wide basis: “March 2012 was the 16th warmest March on record globally, according to the National Climatic Data Center. Records go back to 1880.”
Better be careful on those Spanish beaches. If it was official travel, it may be misinterpreted.
2slugs, most climate functions are actually going against the RC team. That in part is why there are so many recent poor scientifically formulated papers and articles.
As an example: Anyone else noticed there have been no comments on Arctic Sea Ice lately? This might explain why: http://nsidc.org/data/seaice_index/images/daily_images/N_timeseries.png.
Ice started forming earlier last Winter and it has continued to form weeks longer this Spring. The normal rate of decrease is much greater than we have seen this year. What does it mean if ice formation continues to be extended over the next years?
That will take care of the fat tails.
2sb, no one is misunderstanding the RC post. It is very simple, and not relevant. Its assumptions and lack of numbers make it unnecessary.
We don’t know a distribution or costs. The left tail is clearly fatter, so a mean shift is good. And there is nothing to suggest that variance is growing, we simiply don’t have comparable data, and the data we do have shows no effect on weather.
All we have so fare is longer/multiple growing seasons, and it’s hard to attribute that to greenhouse warming (since only about .35 in the last 50yrs can be attributed).
2slugs,
Your comments are misplaced. I already agreed that global warming causes a mean-increasing shift in the distribution. I didn’t see any evidence for fat tails in Table 1 of the Dim Coumou and Stefan Rahmstorf article cited above and in the RC blog post. Nowhere, does the last quote I posted above mention ‘storminess’.
Many of you have fallen into the trap of equating global warming with ‘man made’, and ‘man made’, with CO2 emissions. Now, everytime we hear ‘global warming’, or ‘extreme weather event’, we think ‘man-made CO2’ is the main cause.
TJ, I agree completely: “Many of you have fallen into the trap of equating global warming with ‘man made’, and ‘man made’, with CO2 emissions.”
That’s why I insist folks do the math. Folks like 2slugs ridicule for including the numbers, which BTW haven’t changed in decades, but it appears he and many others (Menzie, you’re one) will not do the math. I suspect they are afraid to determine how badly they have been duped.
2slugbaits
Re: “BTW, if you condition the temperature variability on pre-1998 variability, then there has indeed been a statistically significant increase in temperatures since 1998.”
That is only valid if the “pre-1998 variability” was accurate. However, that “variability” only goes back a limited time over which measurements have been made. Therefore that is a very small subset of the true natural variability.
The increased post-1998 variability is more likely to be a better reflection of the true natural variability, reducing the systemic bias of a a geologically very short measurement time.
See Proof that “climate disruption” is found all the way back to pre-industrial times.
Note my reference to Spencer above is that global warming REDUCES the tropic to pole temperature difference and thus REDUCES the thermodynamic / temperature difference driving force and thus the winds that cause variations and fatter tails.
What evidence do you provide to the contrary?
2slugbaits
See the following post reviewing evidence for colder temperatures in the Little Ice Age and warmer temperatures in the Holocene maximum. Both indicate larger natural variability then the very recent records – and thus actual fatter tails to temperature distributions – that were NOT due to recent CO2.
Little Ice Age Was The Coldest Period For 10000 Years April 7, 2012
http://notalotofpeopleknowthat.wordpress.com/2012/04/07/little-ice-age-was-the-coldest-period-for-10000-years/#more-1085
In science, the null hypothesis rules until displaced by objective evidence with substantial statistical significance. You have the burden of proof to provide that evidence for catastrophic anthropogenic global warming.