Governor Romney has said that 500,000 is the monthly job creation he expects as normal during a recovery [1]. It actually last happened in May 2010 but is otherwise pretty rare. Reader Rick Stryker argues that the 500K should be expressed in percentage terms, accounting for the size of employment. Nonetheless, breaching the equivalent in percentage terms never happened during the eight years of the G.W. Bush administrations.
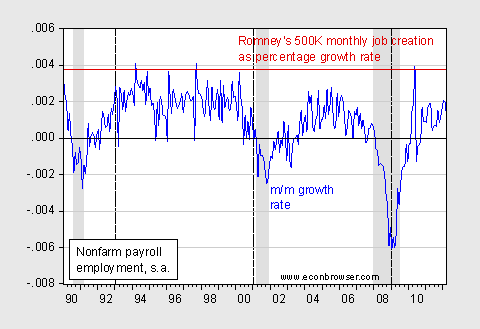
Figure 1: Month on month growth rate (log differences, not annualized) in nonfarm payroll employment, s.a. (blue), and 500,000 monthly change, expressed in percentage of 2012M04 NFP. Source: BLS April release, via FRED.
In fact, over the last 21 or so years, one has to go back to the Clinton administrations to find such numbers.
Oh, and by the way, unemployment has been at or below 4% only 11 times in the past 40 years (essentially at the end of the Clinton Administration).
The BLS employment numbers below show the magnitude of the employment decline and the anemic recovery so far. At 5 million fewer employed now than in Jan. 2008, it would take 10 months to get back to where we were more than 4 years ago with 500K per month added.
In 2012, more than enough time for Obama’s policies to take effect, the rate of growth is about 120K per month. Given an increasing population, that rate hardly something to brag about.
Since the valley was so deep, the ascent should reasonably be more steep. 500K per month is quite ambitious. 120K per month is lacking ambition.
2008 138023 137939 137844 137636 137446 137248 137038 136764 136332 135843 135040 134379
2009 133561 132837 132038 131346 130985 130503 130164 129933 129734 129532 129490 129319
2010 129279 129244 129433 129672 130188 130021 129963 129912 129885 130105 130226 130346
2011 130456 130676 130922 131173 131227 131311 131407 131492 131694 131806 131963 132186
2012 132461 132720 132874(P) 132989(P)
Unfortunately, until all three parties stop subscribing to Karl Marx’s fast track solution to destroying capitalism (free trade), there will be no real job creation. Once they begin to understand their own country’s economic history, as noted by Daniel Webster who said the number one reason we have our present day Constitution was to stop the economic chaos unleashed by free trade with Great Britain under the Articles of
Confederation, there will be no solution. Meanwhile, the Chinese in contrast have adopted the economic logic of the founding fathers, Lincoln and Hamilton. Who would have thought.
If you’re willing to consider the daring attempt of a Christian engineer to overthrow 200 years of economic theory, then check out the new blog rescuingeconomics.wordpress.com. The missing piece of the puzzle is a theory of economics which makes sense of protectionism. The blog takes a first swing at laying the ground work.
So your response to Romney’s statement is, well it “never happened during the eight years of the G.W. Bush administrations?” And you think that is a meaningful response?
What does Romney’s goal of 500K jobs per month say about what he would like to see in terms of unit labor costs? The May 2010 spike in employment numbers was the result of four very steep drops in unit labor costs:
2009Q3: -10.5%
2009Q4: -4.0%
2010Q1: -7.2%
2010Q2: -3.7%
Not surprisingly, this was matched by very strong hourly labor productivity.
2009Q3: +12.9%
2009Q4: +7.1%
2010Q1: +4.9%
2010Q2: +8.3%
Strong manufacturing productivity numbers.
The one piece of good news in the latest BLS numbers is that labor productivity seems to be on the wane. You can only squeeze so much blood out of a turnip.
Was this a response to Romney’s statement or just a cheap shot at Bush?
Bruce Hall: You write: “Since the valley was so deep, the ascent should reasonably be more steep.” Is this a Diana Ross song approach to macro forecasting? Since you commented on the Lazear post, I must assume you you have forgotten the entire exchange about average growth rates after a financial crisis, a la Reinhart and Rogoff.
Jeff and Brian: The relevance of citing the Bush administration record is highlighted by this article.
Menzie: Is this a Diana Ross song approach to macro forecasting?
Very good. However, it seems that this particular period of job losses are much greater than the “average” or “typical” recession/recovery over the past 4 decades or more.
Is it unreasonable to expect a faster recovery… unless, of course, you are saying that the U.S. economy and related employment has fundamentally changed or that the last three years of policy has been fundamentally flawed? Personally, I think it is a combination of the two.
This has been the ideal situation for someone who sees the American market system as flawed and evil and who then implements the incentives for people to become more or less permanently dependent on the largess of the government… 99 weeks of unemployment … rapid growth in those claiming permanent disabilities … etc. The “safety net” is rapidly becoming a king-size bed and the numbers of those no longer seeking work are growing. Meanwhile, attack the job creators. Regulate the job creating industries into stagnation. Put our hope in windmills. Class warfare at its finest.
During the 2008 campaign, the administration and its allies just had to say “George Bush” and their opponents averted their gaze. It worked like magic, so much so, that I thought of them as the Knights Who Say “George Bush,” after the Monty Python skit.
It’s now 2012 and I would have expected that the Knights would have hung up their armor by now. But not so, as this post illustrates. The justification for pointing to Bush’s record on jobs is that Alexandra Franceschi, Specialty Media Press Secretary of the Republican National Committee, went on AM radio to do outreach to Latino voters. When asked a question about what the Republican party stands for in general, she answered so generally that her remarks could have described Reagan’s, both Bushes’, and to some extent Clinton’s economic policies. Even though Franceschi is in no way Romney’s economics spokesperson and said nothing specific about Romney’s policies, The Knights Who Say “George Bush,” are looking for any reason, no matter how flimsy, to say “George Bush” yet again. But, here’s why this won’t work:
1) George Bush has not been President for over 3 years
2) Somebody else has been President during that time and has a record that must be defended
3) Romney and Bush are actually different people
4) The economic problems that Bush faced are different from today’s problems. After the early 2000 recession, the unemployment rate peaked at 6.1 percent, much lower than the peak rate after the last recession. Thus, the Bush recovery didn’t need 500K jobs per month and it’s not a surpise that we didn’t see that.
5) Although Romney’s policies will follow general Republican principles, Mankiw and Hubbard, both excellent economists, are helping Romney craft policies that are appropriate for current economic problems.
Now about that 4%. It’s true of course that if you throw out the unemployment data before 1970, there are only 11 months in which the unemployment rate is at or below 4%. However, the data goes back to Jan 1948. If you include all the post war data, there are 117 months in which the unemployment rate is at or below 4%.
Now, perhaps you think that the data before 1970 aren’t relevant. If so, why? Maybe you think the natural rate of unemployment is higher than 4% and thus Romney has set an unrealistic goal. If so, keep in mind that it was commonly thought in the early 90s that the natural rate of unemployment was around 6%. In fact, a major reason for the Fed hikes of 1994 was that the unemployment rate was perilously close to what was thought to be the natural rate, implying an acceleration of inflation. But in fact the unemployment rate got to 4% by December 1999 without any real acceleration of inflation.
Why should someone running for President of the US be setting employment goals for the largest free market economy in the world? Setting such goals seems “socialist” to me, harking back to Soviet-era five year plans. Truth is the government has little to do with short run macroeconomic performance. Only someone who would say anything to get elected President would pretend otherwise.
Rick Stryker There are many reasons why the unemployment rate going back to 1948 is not relevant to this discussion. First, BLS has not always measured it the same way, so you cannot lean too heavily on long run comparisons. For example, the way BLS handles employment in the military has changed several times over the last 30 years:
http://hnn.us/blogs/entries/94681.html
Back in 1970 there was a draft, which effectively absorbed a large number of young males (several million), many of whom otherwise would have been included in the 18-26 year old civilian demographic that typically has high unemployment rates.
Second, over time the BLS has changed its household survey methodology and questionnaire. There was a major change in 1994. Again, both what is measured and how it is measured have changed over time.
http://en.wikipedia.org/wiki/Current_Population_Survey
Third, the headline BLS data refers to non-farm employment only. In the past a larger farm sector allowed some marginal workers to “spill over” from one sector to another. That’s one reason why farm states typically have lower measured non-farm unemployment rates. Structurally the economy has moved away from farm employment and towards non-farm employment, so there is less opportunity for marginal worker “spill over.” Yet another reason you cannot compare numbers from 1948 with numbers from 2012.
Fourth, the NAIRU itself is not constant over time. NAIRU is effected by frictional unemployment (that’s a “good” kind of unemployment) and labor productivity.
Over the 1948 through 2008 period there was bipartisan agreement that government employment should increase during a recession. It is only recently that the GOP has decided government employment should decrease during a recession. That makes a 500K per month goal very implausible, unless the GOP suddenly decides that if a Republican is in the White House then government employment should be expanded.
Finally, unlike previous post-War recessions, we’re fighting this one with both hands tied behind our back. The GOP not only resists fiscal policies to stimulate the economy, but the Fed is operating at the zero lower bound. Worse yet, the GOP tells the Fed chairman that QE is treason, so watch your back if you visit Texas. How do you stimulate aggregate demand when the two major policy tools have been neutered?
Rick Stryker: “3) Romney and Bush are actually different people
4) The economic problems that Bush faced are different from today’s problems. After the early 2000 recession, the unemployment rate peaked at 6.1 percent, much lower than the peak rate after the last recession. Thus, the Bush recovery didn’t need 500K jobs per month and it’s not a surpise that we didn’t see that. ”
Your remarks puzzle me; I thought that G.W. Bush and Romney have the same economic policies. Govt. bad, freedom good, taxes bad, unspecified spending cuts good, foreign threats bad, more spending and bureaucracy to protect against foreign threats good.
As for Monty Python, I think the idea of being seen with GWB makes Mr. Romney as nervous as GWB is at the thought of travelling outside of the US (due to The Knights Who Say “the Third and Fourth Geneva Conventions.”)
“The one piece of good news in the latest BLS numbers is that labor productivity seems to be on the wane. You can only squeeze so much blood out of a turnip.”
Only in the “I shill for Obama” world of 2 sluggers is a slowdown in productivity growth considered a good thing! Darn productivity growth that increases REAL wages ….. we need stagnation so firms will have to hire more workers (experience higher cost)……in the Obama economy…
ROFLMAO! 2slugs epitomizes the joke that is modern-day Keynesian economics.
MORE on Obama’s ‘My Stimulas Will Create 3.5 Million Jobs in 2 Years and Lower the Unemployment Rate ……if I can getg enough to GIVE UP. ROFLMAO
http://blog.american.com/2012/05/the-awful-april-jobs-report-is-the-real-unemployment-rate-11-1/
Yes Menzie, and by that logic can we also expect another 3 million job loses under a second Obama term? Another $5T in debt? Crack analysis once again for Menzie “politicized nonsense under the guise of legitimate research” Chinn.
2slugbaits,
The unemployment rate series I (and everyone else) used is designed by the BLS to be comparable over time. This series, like all economic time series, undergoes improvements and changes to its methodology. A thorough review by the BLS can be found here: http://www.bls.gov/cps/eetech_methods.pdf. The seasonally adjusted monthly unemployment rate series, which starts in 1948, is very commonly used in empirical research. There is no real justification for dropping data elements before 1970.
I realize that NAIRU is time-varying but I’m afraid you missed my point, which was that estimates of NAIRU can have a very wide confidence interval. So, if you think that an estimate of 5% for NAIRU discredits Romney, check your estimation precision first.
Simon van Norden,
Jimmy Carter, Bill Clinton, and Barack Obama do not have the same economic policies even though they are all Democrats. Neither do Romney and Bush, both Republicans. Carter and Obama are particularly different in their polices. The only similarity I can see in them is that they are both one-termers.
Rick Stryker The seasonally adjusted monthly unemployment rate series, which starts in 1948, is very commonly used in empirical research.
Wrong on both counts. You might see charts and graphs that display data going back to 1948, but very rarely actual econometric analysis. And even then the usual practice is to use nonseasonally adjusted data and incorporate the seasonality adjustments in the analysis for reasons described in Ghysels & Osborn, “The Econometric Analysis of Time Series,” 2001.
estimates of NAIRU can have a very wide confidence interval. So, if you think that an estimate of 5% for NAIRU discredits Romney, check your estimation precision first.
That is abuse of confidence intervals.
Which one of Bush’s tax policies has Romney repudiated? Does Romney want to repeal the Bush tax cuts? And since Romney’s chief economic advisors were also Bush’s chief economic advisors, why should we expect Romney’s policies to be materially different from Bush’s.
More embarrassing revelations for the shrinking pool of people who bitterly cling to the myth of global warming :
http://pjmedia.com/instapundit/142359/
” “In 2008, James Hansen declared that we were at a tipping point due to ice loss at both poles which was going to decimate life on the planet…Since the same date in 2008, Arctic ice has increased by more than 15%.””
2slugbaits,
Thanks for pointing out the seasonality issue. I rechecked the calculation on the number of times that the unemployment rate was at or below 4% and the results did indeed go down if you use non-seasonally adjusted data: from 117 to 116 months.
Regarding your point that data going back to 1947 is rarely used in statistical analysis and when it is it’s non-seasonally adjusted, you might want to want to warn Prof. James Hamilton, who wrote a paper in 2005 entitled, “What’s Real About the Business Cycle?” That paper appears to contain some sophisticated statistical analysis and modeling on the seasonally adjusted unemployment rate, with data starting in 1947.
Two points:
1. See this:
http://1.bp.blogspot.com/-GMf_-8slDMo/T6PN5UHSCSI/AAAAAAAANK4/1gErxQQ-HJ4/s1600/EmployRecApril2012.jpg
The Obama recovery has the exact trajectory of the Bush recovery. It is different only because it started from a much lower employment level.
2. Ever since the early 1980’s, each employment recovery from recessions has been longer than the previous recovery — no exceptions. Just look again at that chart above. We are clearly witnessing structural not political reasons for stubbornly high unemployment.
Jim,
At what point can we start calling Obama Bush 3? 😉
Rick Stryker I think you misunderstood my point about seasonality. There’s no problem with using seasonally adjusted data if you’re just trying to display that time series. In fact, that’s the only sensible way to do it. But if you want to do “analysis” that goes beyond simply showing a time series graph, then things get a little trickier. For example, you cannot take seasonally adjusted subaggregates (e.g., state level unemployment) and aggregate it into a seasonally adjusted national level. You must use nonseasonally adjusted subaggregates. And you really can’t do any kind of filtering or smoothing of a portion of a time series. For example, if you have a 50 year time series that is seasonally adjusted, you really shouldn’t filter or smooth the last 25 years only. Instead you should take the raw data and include the seasonal adjustment in the larger analysis…perhaps by adding a seasonal lag or whatever. In JDH’s paper he built an AR(2) model using the full time series, which was probably okay. Probably not what I would have done, but in that particular case I don’t know if it would have mattered or not.
It did occur to me that Romney and Bush 43 do differ in one important respect. To his credit, Bush 43 used TARP to bail out GM and Chrysler, while Romney oppposed the bail out.
2slugbaits,
Yes, I agree that there are circumstances in which you have to worry about seasonally adjusted data. In this case, however, I was doing nothing more complicated than taking the seasonally adjusted data set that Menzie had already counted back to 1970 and just kept counting back to 1948. I didn’t see how worrying about seasonal adjustment was relevant for this. I mentioned that the data set was seasonally adjusted not to make a point about the need to use seasonally adjusted data but rather just to be crystal clear about what data Menzie and I were both using.
I agree that Romney and Bush II disagreed on the auto bailout. As the campaign unfolds, we’ll get a better sense of the differences between Romney and Bush. One thing that really held Romney back during the primaries was conservative suspicion about his record in Massachusetts. My guess is that Romney would be more likely to raise taxes as part of a spending reduction package (Reagan did it too in the early 80s and so did Bush I) and more likely to agree to bipartisan big government programs than Bush II would have been.
Robert
“Darn productivity growth that increases REAL wages ….. 2slugs epitomizes the joke that is modern-day Keynesian economics.”
Here in the REAL world, Robert, wages are mostly determined by supply/demand for workers and their skills. Since 1975 productivity has doubled, but wages/benefits have gone up less than 50%.(Data from FRED; 2005=100)
Nonfarm Business Sector: Output Per Hour of All Persons
1974-07-01 54.338
1974-10-01 54.840
1975-01-01 55.277
1975-04-01 56.191
1975-07-01 56.845
….
2011-01-01 110.170
2011-04-01 110.080
2011-07-01 110.564
2011-10-01 110.891
2012-01-01 110.752
Nonfarm Business Sector: Real Compensation Per Hour
1974-07-01 71.074
1974-10-01 70.726
1975-01-01 71.189
1975-04-01 71.757
1975-07-01 71.614
….
2011-01-01 103.343
2011-04-01 102.118
2011-07-01 102.744
2011-10-01 103.411
2012-01-01 103.171
The joke isn’t Keynesian economics, Robert. The REAL joke is that conservatives have been brainwashed and so many of your beliefs are FALSE.
Darren (o/t, from above)-
“More embarrassing revelations for the shrinking pool of people who bitterly cling to the myth of global warming ….Since the same date in 2008, Arctic ice has increased by more than 15%.”
From the National Snow & Ice Data Center-
http://nsidc.org/arcticseaicenews/
Arctic sea ice reaches near-average extent in April
Analysis
“Arctic sea ice extent declined slowly through the first three weeks of April, compared to recent years. The slow decline through March and the first few weeks of April meant that by mid-April, ice extent was at near-average levels. However, much of the extensive ice cover is thin ice that will melt quickly once temperatures rise in the Arctic. Over the past week, extent has started to fall sharply.”
There is NO NEWS here, Darren, just right-wing propagandists fabricating a story out of normal variations in Arctic sea ice. And, of course, the gullible conservatives who swallow that propaganda.