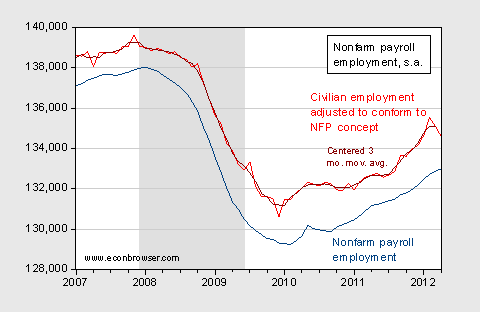
According to the BLS, nonfarm employment rose only 115,000, as government payrolls shed 15,000. The household series adjusted to conform to the NFP concept indicates an additional 1.6 million employed relative to the official series. Private sector employment now exceeds levels of 2009M01, while aggregate hours worked exceeds by 1.9% (in log terms). With revisions to the February and March data, average employment growth is 207 thousand in the first four months, as compared to 210 thousand, from the first three months indicated in the March release.

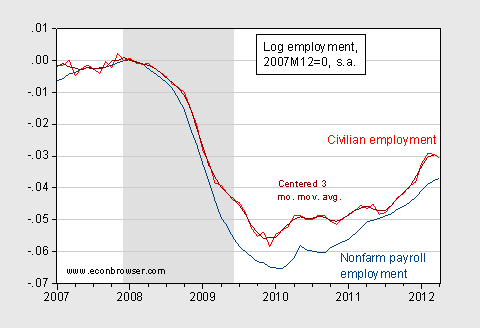
Figure 1: Log nonfarm payroll employment (dark blue), and log household employment series (red), and centered three month moving average (dark red), seasonally adjusted, rescaled to 2007M12=0. NBER defined recession dates shaded gray. Source: BLS via FRED, BLS, NBER and author’s calculations.

Figure 2: Nonfarm payroll employment (dark blue), and log household employment series adjusted to conform to nonfarm payroll employment (red), and three month centered moving average (dark red), seasonally adjusted. NBER defined recession dates shaded gray. Source: BLS via FRED, BLS, NBER and author’s calculations.
Figures 1 and 2 confirm that employment growth appears to be decelerating. However, it is interesting that the household series adjusted to conform to the NFP series continues to register 1.6 million additional employed, as compared to the official NFP series. Note that the former series is a research series, developed in response to conservative economists criticisms of the official series. The household survey is smaller than the establishment, so the sampling error is about four times as large as that of the establishment survey. Further, the household series has to be adjusted for population controls (although the establishment series has to be benchmarked using data on UI tax records).
Governor Romney has stated that employment growth should average about 500,000 after such a recession [1] This job growth has occurred exactly 16 times since 1939 (the sample available); the last time it occurred was May 2010. It never occurred during the administrations of the G.W. Bush. September 1997 (during the Clinton administrations) was the previous episode. (see also [2]).
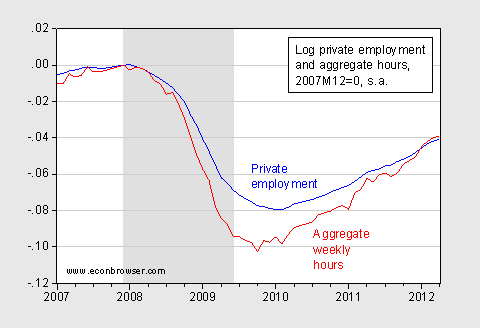
Figure 3 highlights the fact that total hours worked are rising faster than private sector employment (which is in turn rising faster than nonfarm payroll employment).

Figure 3: Log private employment (blue), and log aggregate weekly hours index in private sector, series AWHI (red), seasonally adjusted, rescaled to 2007M12=0. NBER defined recession dates shaded gray. Source: BLS via FRED, NBER and author’s calculations.
Private sector employment now exceeds levels of 2009M01, while aggregate hours worked exceeds by 1.9% (in log terms).
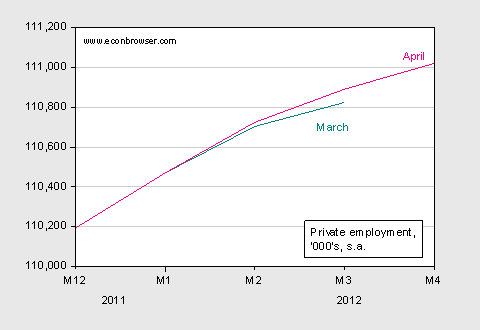
Finally, note that the monthly (not benchmark) revisions have been upward. With revisions to the February and March data, average employment growth is 207 thousand in the first four months, as compared to 210 thousand, from the first three months indicated in the March release.

Figure 4: Private nonfarm payroll employment from March release (teal) and from April release (pink), seasonally adjusted. Source: BLS via FREDbv.
None of the foregoing should detract from the main point: we need faster employment growth. And that goal is within our power. Certainly, if government employment rolls had not decreased by 15,000, NFP would have risen by more in a mechanical sense. But in a deeper economic sense, we hould have had yet more had states not been slashing the rolls of K-12 teachers and other educational staff. Other measures, here and (citing the CBO) here.
More coverage: [WSJ RTE/Sparshott], [WSJ RTE/Izzo], [WSJ RTE/Shah], [Calculated Risk], [Delong], [Thoma], [NYT/Leonhardt], [NYT/Norris], and [FreeExchange/Ip].
You might also note government employment is down about 500k since Obama took office. That’s at all levels. I’m not crediting or blaming Obama for that, but you could see it’s a big number.
“aggregate hours worked exceeds by 1.9% (in log terms).”
Most people do not think in log terms. Why express things this way?
… or if the Fed would do more. If i hear one more time from the likes of certain Fed members that unemployment is structural so rates need to go up soon i will puke my monetary cookies.
Counting the number of times that monthly employment increases were greater than 500K since 1939 is just an attempt to lower the bar for what administration supporters know in their hearts is a failed presidency.
In 1939, the size of the labor force was 30 million; today it is 133 million. A 500K monthly increase on 30 milion would be truly gigantic and not at all what Romney was advocating. To put Romney’s remark in context, we need to adjust for the current size of the labor market, which we can simply do by dividing 500K into 133 million, yielding 0.38%. Going back to 1939, there are 172 cases in which monthly employment gains were at least 0.38% of the current labor market size. Admittedly, the last time we saw sustained increases of 0.38% of current labor market levels was during the recovery from the 1982 recession. But that just implies that Romney is setting an ambitious but not historically unreasonable employment goal. Given the size of the current employment hole, it is also necessary goal if we are to return to full employment anytime soon.
Setting ambitious but reasonable goals is just what a future President should be doing. Supporters of the current administration understand that they need to lower expectations however. It was amusing to read erstwhile ecstatic now lukewarm Robert Deniro’s remarks to NBC’s David Gregory, which probably sums it up well for administration defenders: “..it’s not easy to be President of the United States.” And: “I know he’ll do better in the next four years..”
Rick Stryker: Ambitious, yes. Reasonable? Like Governor Romney’s 4% unemployment rate, which Doug Holtz-Eakin characterized as… well you read it yourself here. I look forward to your next comment, so I can get a good chuckle.
So help me understand some math here:
If you’re running an 8% natl budget deficit, and you want to reduce that to, say, 3%, that means that GDP has to be reduced 1% per year for 5 years, if you want to create fiscal sustainability over a five year period. Is that correct? So if your potential GDP growth is 3% per year, then attaining a sustainable deficit will by definition automatically reduce that potential growth rate by 1% each year. Is that right?
Also, if you have built up debt of, say, 50% of GDP, then paying that back will require the equivalent of a 1% reduction in well-being (assuming 0% interest rate) for something like 50 years. Now, if I understand correctly, that reduction won’t show up in GDP figures, but will affect social well-being through either lower government spending or higher taxes, or both. Do I have that right?
Menzie,
I would think that Holtz-Eakin is not disputing that we can get to a 4% level eventually. That’s happened a number of times historically. Holtz-Eakin is hardly a defender of the current administration, having been very critical of the current employment market performance. But being a politically experienced economist, I think he’s worried that getting to such a low level within the first 3 years of a Romney presidency is a tall order. He no doubt remembers that when the unemployment rate hit 4.4% in October 2006, Nancy Pelosi dismissed it by saying that Bush had the worst jobs record since the Great Depression. Holtz-Eakin is wisely looking forward to the day when Romney has gotten us to 5.5% by early 2016 and Hilary and you are attacking him for a completely unacceptable performance.
Steven Kopits In a word, no. The sustainability of fiscal debt is driven by lots of things, including the confidence that lenders have in a government’s abiilty to tax future incomes, the prevailing interest rate, GDP growth, and how much of the annual deficit is due to interest payments versus new primary debt. There is no magic number that says disaster is guaranteed beyond XX%, although there surely is some limit for every economy. And you have to look at whether the deficit is cyclically driven or structurally driven. Cyclical deficits are no big deal.
if you have built up debt of, say, 50% of GDP, then paying that back will require the equivalent of a 1% reduction in well-being (assuming 0% interest rate) for something like 50 years.
No. That would require all of the debt being held by foreigners, but most debt is held by US citizens so a debt payment for the government is also a source of income for others. That’s not to say public debt doesn’t carry welfare or utility costs. Who receives the interest on that debt matters because there will be distributional effects. And the fact that government has to increase future taxes to pay the interest will have deadweight costs. Stuff like that. It also matters what the deficit buys. If a government uses deficit financing to sustain consumption (i.e., tax cuts), then the benefit of deficit spending will not go beyond the aggregate demand multiplier. But if government uses deficit financing to upgrade infrastructure and increase human capital investment, then those projects will generate a future supply side return beyond the multiplier effect. The time to upgrade sewer and water systems is when there’s a global savings glut and interest rates are very low. You do not want to do those kinds of projects when infrastructure spending risks crowding out private sector investment. Also, remember that the current generation “pays” for the principal part of deficit spending because that’s when real resources are consumed equal to the principal.
Rick Stryker: Um. Ok. So, 500,000 is a reasonable expectation, and so is 4% unemployment, except when it isn’t, in which case it is aspirational. I concur, then, that Governor Romney has a strong grasp of the data, in that alternate world.
Douglas Lee: Academic economists very often report changes and growth rates in log terms. That’s because 1% up then 1% down takes you to the same place, while using the exact/base period formula doesn’t do that.
500k does not seem that unreasonable if the folks classified as out of the labor force transition back to unemployment and employment. I have no idea what the actual number will be, but if we get a burst of growth we could easilty see several months of large flows into employment.
Menzie,
No, both 500K and 4% are reasonable expectations since they both happened many times historically. The question is whether 4% can reasonably be expected by the end of Romney’s first term, not whether it can be achieved at all.
We can back of the envelope the size of the problem. In May 2008 when the unemployment rate was 5.5%, the labor force size was 137 million. Today it is 133 million. That’s a deficit of 4 million jobs that needs to be made up. But the labor force has also been growing. For back of the envelope purposes, let’s approximate with 100K per month. That’s 47 months at 100K per month, or 4.7 million. Thus, just to get back to May 2008 when the unemployment rate was 5.5% we will need to increase by almost 10 million jobs.
Since Romney’s polices will take some time to take effect, he might have 2 years of labor force growth before early 2016. Even if he gets 12 months X 500K per month, which is more than we saw in the early 80s recovery, that’s only 6 million jobs. He’ll also need to have many months of very strong sub-500k job growth during those 2 years to get back to 5.5%. Of course, he might get lucky and the labor market might recover sooner but his advisors need to be worried about the scenario I’ve described. That’s what Holtz-Eakin is worried about I think. His comments should not be viewed as questioning Romney.
tj if we get a burst of growth we could easilty see several months of large flows into employment.
And if only we had a can opener we could open the can of beans. You’re assuming away the problem. The fiscal stimulus from ARRA has almost entirely dissipated. Extending the tax cuts last winter simply maintained the status quo and did not provide any significant new stimulus. In fact, overall government fiscal policies are contractionary. So what component of GDP is going to provide this “burst of growth?” Europe? China?
Romney is a businessman and has no particular understanding of macroeconomics. And anyone who thinks business economics and public policy economics are at all similar just doesn’t know either one. Obama was a law professor and was equally ignorant about economics, but he was at least self-aware enough to understand that folks like Christine Romer and Jared Bernstein and Larry Summers knew a lot about macroeconomics. There are a few folks on Team Romney that know how to write economics textbooks, but they don’t seem to have the intellectual integrity to publicly call Romney out on his nonsense.
Here’s the difference between Obama and Romney. Both are clueless about macroeconomics, but Obama listens to his economic advisors because he wants to learns something. Romney listens to his economic advisors because he knows they will tell him what he wants to hear. It’s the difference between an engaged brain and an empty suit.
Rick Stryker: I have evaluated your 500K statement in percentage terms in a new post. You clearly have no acquaintance with the data. When you state unemployment has been at or below 4% many times, you do realize that in the past 40 years the total number of months that is true is 11. Please consult the data again.
Menzie,
Of course, I already consulted the data before I made my statement. Indeed, you and I are looking at the same data, the monthly civilian unemployment rate from the BLS, seasonally adjusted. If you go back 40 years, there are exactly 11 instances in which the unemployment rate is at or below 4%, just as you say. Curiously enough, that data set goes back to Jan 1, 1948 not just to May 1970. If you check all the data over the post war period rather than just the last 40 years, you’ll find that the unemployment rate was at or below 4% 117 times.
Rick Stryker: Yes, I know Governor Romney would like to take us back to the 1950’s (or 1910’s), but I didn’t think that data was particularly relevant. However, if you think it is, please, go ahead and run with that ratio.
Let me make a more narrow case, Slugs.
You can say that US fiscal deficits will continue at 8% forever, so no adjustment is needed. I think most people would argue that deficits need to return to the potential GDP growth rate within a finite period of time. Pick your period. I’d target 5 years.
Now if you want to go from an 8% deficit to a 3% deficit in five years, you need to reduce the budget balance by 1% per year, and as I understand it, that will reduce GDP by 1% in each of those years.
Yes or no?
2slugs,
Regardig your post on the related thread about policy –
You missed the point. The point is that with the huge number of unemployed and marginally attached, either Obama or Romney could (I would claim will) see some 500K increases in employment. Of course, I assume our economy is more resiliant to policy errors than you do, although Obama may yet prove me wrong.
Regarding your comment on Obama listening to his economic advsiors – perhaps – but it appears his Progressive handlers make the decisions. They were far more interested in engineering social change until we got within a year of the election.
Hilarious post! Menzie puts lipstick on the Obama pig.
And the drivel from 2slugs is even better. Barry listens to his economics advisers because he is engaged! ROFLMAO. The only thing Obama is engaged in is the golf course and class warfare. And why take comfort in the fact that Obama listens to Keynesian macroeconomist (unemployment won’t go below 8%, we will create 3.5 million jobs) when it is evident that they are clueless about macroeconomics.
Steven Kopits I don’t believe I said that deficits can continue at 8% of GDP forever. I’m not sure where you got the idea.
If you want to go from an 8% deficit to a 3% deficit in 5 years, then yes, you would have to cut government spending by 1% per year. Of course, there is no obvious reason why you should or would want to do this in 5 years…why not 10?…but there you go. Cutting deficit spending by 1% each year does not mean GDP is cut by 1% each year. Presumably you would not want to cut the deficit if private sector growth was still flat. But if the private sector is on the rebound, then cutting the deficit would not reduce GDP. It all depends on whether or not the “crowding out” effect is binding. Today it is not binding, which is why you want deficit spending…deficit effectively “crowds in” growth. But at some point the deficit will “crowd out” private sector growth and that’s when we would want to reduce the deficit.
tj I think you’re making a rather trivial point. Yes, in a bizarre kind of way it is true that a larger pool of unemployed labor makes it arithmetically easier to see 500K per month employment growth because the labor supply ceiling is not binding, but that strikes me as a sophomoric argument. The relevant binding constraint is weak aggregate demand, not the size of the labor pool. Romney has not told us how he expects to overcome weak aggregate demand. Instead we get some nonsensical blather about unleashing the creativity of entrepreneurs, getting government out of the way, freedom, justice and the American way, blah, blah, blah. Romney’s prescriptions betray his private sector background. Private sector businesses fret over the factors that they can control, which are mainly supply side things. Businesses get ahead by cutting costs, shifting costs, and putting the other guy out of business. That may make you a lot of private money, but it’s bad public policy. Herbert Hoover was a sharp businessman who misapplied that business experience during the Depression. Andrew Mellon was a sharp businessman who also misapplied that business experience during the Depression.
Obama’s problem was that ultimately he listened to his political advisors more than his economic team. It was his political advisors that talked him into downsizing the stimulus plan.
Slugs –
“Why not 10 years?”
Historically, recessions average every five years in the US. In Europe, there were two years between recessions. So the notion that you can run a large deificit forever, and that markets will let you do that…well, neither the historical record nor the European experience shows that’s ideal.
You’ll recall I called for a recession back last April. I encourage you to look at the Eurostats employment statistics and look when European unemployment begins to rise again. (See p. 3: http://epp.eurostat.ec.europa.eu/cache/ITY_PUBLIC/3-02052012-AP/EN/3-02052012-AP-EN.PDF)
The notion that we can expect ten years of uninterupted growth is largely unfounded. So you have a choice: progressively reduce the gdeficit, in which case deficit reduction will lead to material drag on growth for the next 4-6 years; or continue to run deficits at 8%, which I personally think will lead to a stagnation of living standards in the US in a time frame that begins to approach decades.
When Christina Romer went into the Obama administration I could read in her writing that she actually thought she would make a difference. I predicted she would be the first to leave the administration. I was wrong. Her boss left first then she followed quickly afterward. She spent most of her time in the administration apologizing and making excuses for failures of the administration. Why do I bring this up? It seems pretty obvious that Menzie is auditioning for the part of Secretary of Apology in any new administration. He would be much better that Christina Romer. She actually seemed uncomfortable with that job.
Ricardo: Yes, I recall your disappointment, in the same comment that you called to let GM and Chrysler fail (under your DickF moniker (May 2, 2009, 8:38AM):
Anyway, just to check: is there anything factually incorrect in the post? It would be nice to read something from you besides another ad hominem attack, devoid of data.
Menzie,
You are a little premature to sing the praises of Chrysler. Let’s see how things are in 5-10 years. To illustrate let me respond with analysis of Chrysler’s ugly, twin sister GM. This was written by Brian Domitrovic (edited for length).
By the way, we now know that the bailout of 2008-09 was bigger than first thought…. The official expenditure by Treasury’s reckoning was $80 billion. But as the Wall Street Journal recently reported, if you throw in the “tax-loss carry-forwards” that pit GM’s huge past losses against future profits, the IRS will be out another $18 billion in taxes never come due. Call it, in total, a cool $100 billion. Treasury still says it’ll get all of that back in due course save $24 billion. We’ll see.
For now, let’s cast back to the most hallowed of all research to come out of the discipline of finance in the go-go years, the 1980s and 1990s. This would be the big study of corporate re-investment compiled by Michael Jensen of Harvard Business School some twenty years ago.
Jensen did something interesting. He looked at the re-investment performance of essentially every firm the Fortune 500 (actually 432 of them) from 1980 to 1990. Then he ranked them, worst to first. Guess who came in dead last, as in the worst? Instinct already told you: GM….
…Here was a company, in Jensen’s finding, whose investment back in itself was so large that it was greater than the entire sum of venture capital committed nationally in those eleven years, 1980-1990. And these were no slouch years for venture capital….
Or to put it another way (again Jensen’s example), GM could have flat purchased Toyota and Honda (the companies that were eating its lunch) for the amount of money it plowed back into itself in these years.
Here’s Jensen: “It is clear that GM’s R&D and investment program produced massive losses. The company spent a total of $67.2 billion in excess of depreciation in the period and produced a firm with total ending value in equity…of $26.2 billion.”
One purpose of the article was to stand agape at these numbers. Talk about cash burn! Never in the history of man (outside maybe the Labour government in Britain in the 1970s) had an engine been conceived … that could destroy money with such efficiency and consistency.
The larger purpose of Jensen’s research was philosophical. It was to point out that despite all the Joseph Schumpeter talk of “creative destruction” that is supposed to take place in modern economies, sometimes old firms don’t see the writing on the wall, don’t get the picture when a two-by-four is hitting them repeatedly over the bean. GET OUT OF THIS BUSINESS is specifically the message the market is screaming at them. And yet they keep plowing billions back into the business.