In a Guest Contribution today, Loukas Karabarbounis and Brent Neiman (University of Chicago) discuss their recent research on “Declining Labor Shares and the Global Rise of Corporate Savings.”
The stability of the labor share, the proportion of an economy’s total income paid out to workers as compensation for their time, has long stood as one of the principal stylized facts of economic growth. While this regularity may very well hold across centuries or in the long run, our recent work demonstrates the failure of this characterization over the last three decades. In “Declining Labor Shares and the Global Rise of Corporate Savings,” (Karabarbounis and Neiman, 2012) we show that labor shares have eroded in most countries around the world, including seven of the eight largest. Globally, corporations paid about 65 percent of their income to labor (as opposed to capital) in 1975, compared with about 60 percent in 2007.1 This trend can be seen in the red dashed line in Figure 1, which plots year fixed effects from a regression of labor shares each year in the eight largest economies that also absorbs country fixed effects.2
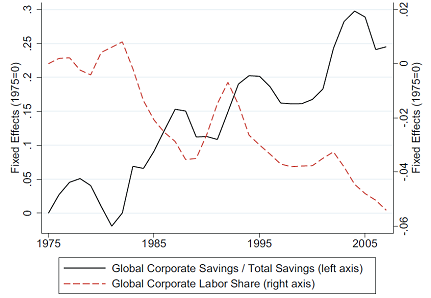
Changes in the labor share have broad implications for inequality and for our understanding of how firms operate. We also demonstrate that the labor share declines were associated with increases in corporate profits and corporate savings, which equal the portion of profits which were not paid out as dividends. Indeed, all eight of the world’s largest economies saw an increase in the share of their total savings originating in the corporate sector rather than from households or the government. Corporate savings accounted for a minority of total global savings in 1975 but contributed a majority by 2007. The upward sloping black line in Figure 1 plots year fixed effects from a regression of the share of total savings due to the corporate sector in the eight largest economies after absorbing country fixed effects. The increase of more than 20 percentage points is striking. In essence, thirty years ago global investment was primarily funded by household savings whereas now it is primarily funded by the savings of corporations.
What caused these trends? One might hypothesize that international trade has allowed capital abundant countries like the United States to shift out of labor-intensive sectors. This explanation, however, would counterfactually imply an increase in labor’s share in developing countries such as China. Instead, we emphasize that the relative price of investment goods compared to consumption goods declined sharply around the world beginning around 1980, right around the same time the trends began in the data.3 Further, we demonstrate that countries experiencing greater investment price declines also experienced greater reductions in labor shares and greater increases in corporate savings shares. To the extent the decline in investment prices reflect the IT revolution, these empirical relationships suggest that the computer and internet age may be bringing about a shift in labor’s role in production.
Our paper studies a model in which firms produce output by combining capital and labor with an elasticity of substitution that exceeds one, and in which capital market imperfections lead firms to prefer financing investment with internal savings rather than external funds such as new equity. In response to a decline in the investment price, firms shift away from labor and toward capital, reducing labor’s share. They increase corporate savings as the cheapest means to finance this expansion of the capital stock, increasing the share of corporate savings. In fact, the model also corroborates our story quantitatively. When we use our calibrated model to simulate shocks to the relative investment price that mimic those observed in the data, the model reproduces roughly half of the scale of both trends observed in the data.
Declines in the labor share need not automatically produce increases in corporate savings. For example, an increase in market power leading to higher profit margins and lower corporate investment would likely cause declines in both the labor share and corporate savings. In this sense, studying these two phenomena jointly offers powerful corroboration of the mechanism in our model, compared with many other explanations which could on their own generate one of the two trends. The single shock to the investment price in our model generates both a decline in labor share and an increase in corporate savings. In future work we hope to explore the implications of these global trends for business cycles, inequality, and global imbalances.
References
- Bentolilia, S., and G. Saint-Paul (2003): “Explaining Movements in the Labor Share,” The B.E. Journal of Macroeconomics, 3(1).
- Blanchard, O. (1997): “The Medium Run,” Brookings Papers on Economic Activity, 2, 89-158.
- Fisher, J.D. (2006): “The Dynamic Effects of Neutral and Investment-Specific Technology Shocks,” Journal of Political Economy, 114(3), 413-51.
- Harrison, A. (2002): “Has Globalization Eroded Labor’s Share? Some Cross-Country Evidence,” Working Paper, University of California at Berkeley.
- Jones, C. (2003): “Growth, Capital Shares, and a New Perspective on Production Functions,” Working Paper, Stanford.
- Karabarbounis, L., and B. Neiman (2012): “Declining Labor Shares and the Global Rise of Corporate Savings,” NBER Working Paper No. 18154.
- Rodriguez, F. and A. Jayadev (2010): “The Declining Labor Share of Income,” Human Development Reports Research Paper 2010/36.
1 Earlier work including Blanchard (1997), Jones (2003), Bentolila and Saint-Paul (2003), Harrison (2002), and Rodriguez and Jayadev (2010) also note variability in the labor share over the medium run. Our work is generally consistent with these papers, but differences in focus, data, and methodology discussed in our paper allow us to more broadly conclude that the global labor share has declined.
2 We measure the labor share within the corporate sector and therefore exclude government and unincorporated enterprises.
3 Fisher (2006) documents an acceleration of this decline for the United States in the early 1980s.
This post written by Loukas Karabarbounis and Brent Neiman.
So it wasn’t all due to the Republicans? Damn!
Someone better pass this along to Krugman, Stiglitz and the little guys like Reich. Put it in a cleft stick and hand it to a runner…
Despite the shift away from labour and towards capital, the share of corporate savings invested in structures, M&E and software has been steadily decreasing and currently stands near a modern day low. Corporations have used the rise in corporate savings to boost dividends and investment overseas. Furthermore, a good portion of the dividend payout leaks overseas. Policy makers should focus their efforts in changing this dynamic (through tax incentives perhaps). Another round of QE is unlikely to have same success at boosting the recovery as a well thought out policy promoting investment of corporate savings at home.
“This explanation, however, would counterfactually imply an increase in labor’s share in developing countries such as China.”
Why would one make the above assumption? If I pay $10/hr and shift to a place where I pay $1/hr, how is that new place going to see an increase in share? Especially if the government I’ve shifted to is doing their best to keep labor cost down as a means to attract investment?
We must keep in mind that labour IS capital. Savings simply constitutes one type of leverage to direct human energy and attention. If you can name an exception, I will be happy to hear it, but I haven’t heard one yet.
I did a quick skim, so I probably missed a few points. Your explanation makes sense, but I didn’t see much/any discussion in the paper regarding the causes of the investment price, household depreciation, etc shocks. A brief description would help put your results in perspective.
Perhaps a reduction in the barriers to global capital market flows over the last 30 years reduced the price of investment goods and allowed corporations to increase profit margins and investment.
“Collectively, however, they suggest that real corporate investment relative to GDP increased by
35 to 50 percent between 1975 and 2007.”
At the same time, financial market liberalization around the globe increased household mortgage debt (negative savings) and increased the appreciation rate of homes (consistent with the assumed negative shock to the household capital depreciation rate). Financial market liberalization also reduced the cost of capital for households, corporations and government.
I don’t know, it seems to me that debt is more of flow variable for corporations, so a reduction in the price of investment goods flows directly into corporate saving and increases the stock of savings, all else equal. In terms of elasticity, if the demand for investment is relatively inelastic, then the drop in the price of investment goods resulted in lower total cost of investment goods and the increase in corporate savings.
My guess is that the level of dividend payments to households went up, but it was not enough to offset the increase household mortgage debt/revolving credit, so labor’s share of saving fell.
I would also guess that over the next decade, if households pay down debt, that the trend flow to household savings relative consumption will rise. This might naturally reverse the recent trend change in labor/corporate shares. A higer savings/consumption ratio at households would also tend to reduce the savings share at corporations if it causes profits to grow at a slower rate.
The post references the “stylized facts” … but a quick skim/search of the paper doesn’t show discussion in that direct context — it may be interesting to have some more discussion in the context of Kaldor’s (1957, 1961) stylized facts. Ultimately, if the income shares aren’t stable/stationary, what is the limit (or do the paper’s results have any implication for that)? Or can relative investment prices continue to fall and will machines run corporations and labor share go to zero … an ultimate future of a “Terminator” economy?
Anyone: Does this have any implication for equity valuations currently?
The authors reference the Antras study that found Cobb-Douglas was not a good fit. I’m familiar with that study and Antras uses a Hicks neutral CES specification. So do the authors of this paper. But another economist (Devesh Raval) at the Booth School recently (Nov 2011) published a paper with the Census Bureau’s Center for Economic Studies (CES-11-05, “Beyond Cobb-Douglas: Estimation of a CES Production Function with Factor Augmenting Technology”) in which the author used a labor augmenting (Harrod) specification. Raval found that capital shares changed over time and it fit the empirical data (using four digit industry category codes) better than a Cobb-Douglas function with Hicks neutral technology. If the authors of today’s paper are eavesdropping I’d be interested in knowing if they considered adding a labor augmentation factor to their CES model. The intuition being that automation is labor augmenting which would affect the capital/labor ratio over time.
TF: at the least it brings into question the notion of mean-reversion of corporate profits as a percentage of GDP, and mean-reversion of market capitalization as a percentage of GDP. The paper doesn’t show a big swing in investor’s required rate of return in equities.
The captioned paper and conclusion is introducing through time, corporate structures, profits, debts, as isomorphic structures when they may not.
Since 1980 the corporate structure of debts, profits, investments, valuation, are showing phenomenal changes. The same paper is not differentiating branches of activities such as financial corporations from others, when they are puzzling anomalies with historical benchmarks.
T Philippon WAGES AND HUMAN CAPITAL IN THE U.S. FINANCIAL INDUSTRY:
1909-200 Thomas Philippon Ariell Reshef
“We use detailed information about wages, education and occupations to shed light on the evolution of the U.S. financial sector over the past century. We uncover a set of new, interrelated stylized facts:
financial jobs were relatively skill intensive, complex, and highly paid until the 1930s and after the 1980s, but not in the interim period. We investigate the determinants of this evolution and find that financial deregulation and corporate activities linked to IPOs and credit risk increase the demand for skills in financial jobs. Computers and information technology play a more limited role. Our analysis also shows that wages in finance were excessively high around 1930 and from the mid 1990s until 2006. For the recent period we estimate that rents accounted for 30% to 50% of the wage differential
between the financial sector and the rest of the private sector”
No wonder if the payout is unevenly distributed to labor, as dividends and other forms of remuneration are not accounted for in the process. Not included in the paper, the abnormal, non Gaussian profile of the financial profit 30 % of the SP 500, not included in the paper the low fixed capital formation during the period.
As for the quantitative, Fed St Louis data resources may supply enough evidences that may raise questions as to the new trajectory starting in 1980.Debts, valuation and the relevance of corporate savings may have gone through a radical change.
Fed St Louis
Debt Outstanding Domestic Nonfinancial Sectors – Business Corporate (Nonfarm) Sector (BCNSDODNS)
http://research.stlouisfed.org/fred2/series/BCNSDODNS
Non financial debts from zero in 1960 to
8 trillion USD in 2012
Is it a matter of valuation only?
Market Value of Equities Outstanding – Net Worth (Market Value) – Balance Sheet of Nonfarm Nonfinancial Corporate Business
http://research.stlouisfed.org/fred2/series/TNWMVBSNNCB
2012:Q1: 16,101.07 Billions of Dollars against less than 2 trillions USD in 1980.An ambiguous chart reading,for those whom believe in fortune tellers.
The corporate savings when compared to debts,may not be so rich as to justify a larger hand out to the labor.The same period 1980 to 2012
Time and Savings Deposits – Assets – Balance Sheet of Nonfarm Nonfinancial Corporate Business (TSDABSNNCB) 2012:Q1: 557.95 Billions of Dollars
http://research.stlouisfed.org/fred2/series/TSDABSNNCB
Net Corporate Dividends (DIVIDEND) 2012:Q1: 841.7 Billions of Dollars from less than 100 million USD in 1980.
Should the year 1980 be a benchmark,one may fail to see the real commensurate growth in gross fixed capital formation (even worse in France)
Gross Fixed Capital Formation in United States (USAGFCFQDSNAQ)
http://research.stlouisfed.org/fred2/series/USAGFCFQDSNAQ
In simple terms, excess liquidity, or ‘bubbles’, would seem to connect directly to the balance between corporate profits and labor share? But I see no mention of anything here about this balance. It seems very likely though, that this imbalance, when combined with the additional rise in foreign inflows (leading up to the recent downturn), may do much to show why the trickle-down theory is flawed?
ray
The end of any form of gold backing the system in 1971 should have been considered. There is no coincidence that labor productivity…and wages…have suffered as the fiat money (non-CPI) inflation tax hurts labor since Nixon closed the gold window.