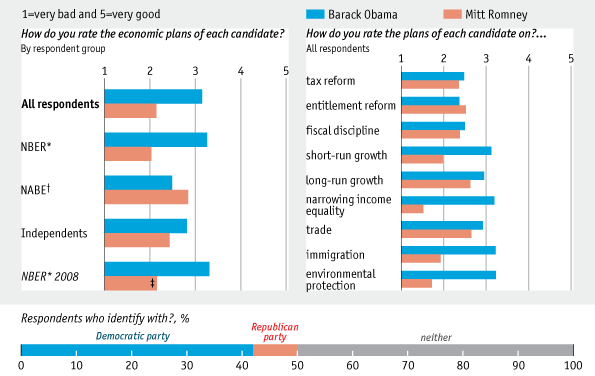
From the Foreign Policy survey: The Economy (released today):
Figure from Foreign Policy survey: The Economy. n = 62; survey taken August 17 to September 14.
Update, 9:30am Pacific, 10/17: See also Economist poll of economists from NBER and NABE:
The comments, recounted here, are also well worth reading.
Or how about none of the above?
I would blame it on constrained global supplies of exported crude oil, with the developing countries, led by China, so far at least consuming an increasing share of a post-2005 declining volume of Global Net Exports of oil (GNE).
Since 2002, the average annual increase in Brent crude oil prices, through 2011, was 17%/year, with one year over year decline, in 2009.
I estimate that the total cumulative post-2005 volume of GNE that will be available to importers other than China & India has already been depleted by about half–half gone in six years, through 2011.
As in the movie “The Sixth Sense,” (in which many ghosts didn’t know they are dead and only see what they want to see), for most Americans our auto centric suburban way of life is dead, but most of us don’t know it yet, and we only see what we want to see.
Both because they listen too much to the fed/economists who didn’t/don’t see too much debt as a problem, and they worry too much about interest rates. The people voting need to stop worrying about access to credit/debt.
JJB,
Pot => Kettle = BLACK?
“We” only see what we want to see, and to you, the problem with post-financial crisis, real estate bubble economies is oil. Got it.
MC,
Your heart is in the right place, but N=62?
It is much less important how effective propaganda has been about events in the past and much more important what we will be facing in the near future.
President Obama has made tax increases for those making over $200K/year ($250K for married couples) a centerpiece of his campaign, right behind authorizing the killing of bin Laden, his take-over of GM, and the pension plan for Big Bird.
While both President Obama and Mitt Romney have proposed cuts in corporate income taxes President Obama’s plan would lower them for the largest corporations, the C-Corps while increasing taxes on the flow-through sector significantly. Note the following from the summary of the report referenced below.
This new study, The Flow-Through Business Sector and Tax Reform by Drs. Robert Carroll and Gerald Prante
Ernst & Young LLP, has been released analyzing how devastating this would be for our economy, specifically employment due to the increase of tax wedges on pass through corporations.
Excerpt:
Flow-through businesses are subject to a single level of tax on the income earned, whether or not it is distributed. The income and expenses of flow-through businesses are reported by an entity‟s owners – hence the name “flow-through” or “pass-through” entities. An individual owner‟s flow-through income is combined with income they may receive from other sources and subject to individual income taxes. Losses, rather than accumulating within the business entity level, are also passed through to the owner where they may, subject to various limitations, be used to offset income from other sources. Thus, it is the tax rates faced by individual owners of flow-through businesses that affect decision-making and the economic health of these businesses.
In contrast, the income of C corporations is subject to two levels of tax, first when income is earned at the corporate level, and again when the income is paid out to shareholders in the form of dividends or retained and later realized by shareholders as capital gains. These two levels of tax are often referred to as the double tax on corporate profits. C corporations can generally carry losses back for two years and carry them forward indefinitely.
The flow-through form provides multiple options of entities with various ownership and capital requirements that allow entrepreneurs the potential for limited liability with the flexibility needed to choose the entity that best fits their particular business needs. Sole proprietorships are unincorporated businesses owned by a single individual. Partnerships are unincorporated business entities owned by two or more entities or individuals, without any limit on size or type of partner.
S corporations are domestic corporations that meet certain conditions that generally constrain their ability to raise capital through expansion of ownership and stock issuances. S corporations, for example, are limited to no more than 100 shareholders and one class of stock and are required to be a domestic corporation. Also, generally only individuals may be shareholders of S corporations. These restrictions can have the effect of reducing an S corporation‟s access to capital.
Limited liability corporations (LLCs) are flow-through business entities that combine the limited liability feature of the corporate form with the flow-through of income and losses of the partnership form.
…The economic footprint of flow-through businesses has grown steadily by several different measures. The percentage of businesses choosing the flow-through form rose from 83 percent in 1980 to 94 percent in 2008. The share of total receipts generated by flow-through businesses has nearly tripled since the early 1980s with the flow-through share of total receipts rising from 13 percent in 1980 to 36 percent by 2008. The flow-through share of net income also rose significantly, 25 percent in 1980 to 82 percent by 2008.
…the flow-through sector now comprises a large fraction of business activity not only based on number of firms and receipts/net income, but also based on the number of workers it employs. In 2008, the flow-through sector employed 54 percent of the private sector work force, with C corporations employing the remaining 46 percent. S corporations employed 25 percent of the private sector work force, while partnerships employed 10 percent and sole proprietorships accounted for 19 percent.
Blame for the Economy
In order:
1. Excess Chinese liquidity (financial crisis affected the entire OECD, not just the US)
2. Oil prices (lack of supply growth)
3. The Fed, for not compensating for 1 and 2 above
4. The Republicans, for not compensating for the Fed
5. The Democrats, who contributed mightily to the spread of mortgages to non-qualified borrowers
Now, leaving aside whether an FP poll constitutes science, the chart above has nothing to do with growth. Blame is backward-looking. Growth is forward-looking. What will cause growth?
Price signals are clear—we need to increase oil production. The most important single initiative on this front is Shell in Alaska. They are showing 1.4 mbpd at peak (early 2020s)—same as the Gulf of Mexico and more than current shale oil production. We need to accelerate this program to move first oil to 2017. I would point you to slide 9 of the FP presentation. http://www.foreignpolicy.com/articles/2012/10/08/the_fp_survey_the_economy#8 Note where oil ranks as a constraint on growth. Note the participants in the survey. Note their prescience on slide 2.
By the way, if you’re interested in median income, then CNG as a transportation fuel is clearly at the top of the list. The economics of this fuel are the same as for Wal-Mart—its serves the same core $25,000-65,000 income group. Want to help the below average working household? Reduce their transportation fuel expenses by half. CNG can do that.
Which party is more likely to be aggressive on these matters?
And speaking of football and San Diego (and this comment has nothing to do with your hometown, Jim–honest!), but what a whuppin’ Peyton Manning put on the Chargers last night. The two Mannings, Brees, Brady, Aaron ‘Circus-Tricks’ Rogers—-we live in the Golden Age of Quarterbacks. It’s doesn’t get any better than the Aaron Rogers and Peyton Manning shows of the last two days.
One very important question that was not asked.
Which party did you support in 2000, 2004, and 2008?
Steven,
Re: “Price signals are clear—we need to increase oil production.”
Of course, as you know, an increase in the production rate means a corresponding increase in the depletion rate, i.e., the rate that we consume remaining resources, and while estimates of recoverable reserves can and will vary, as you know depletion (of both oil and gas reserves) is a one way street.
My current specific area of focus is the rate of depletion in post-2005 Global and Available* Cumulative Net Exports (CNE).
By definition, the volume of Global and Available post-2005 CNE is steadily falling, year by year.
In fact, using a method that has proven to be too optimistic for prior net export declines suggests that the 2005 to 2011 rate of depletion in post-2005 Available CNE, i.e., the total post-2005 cumulative volume of globally net exported oil that will be available to importers other than China & India, was almost one percent per month.
*Available Net Exports = GNE less Chindia’s Net Imports (CNI)
You guys are hilarious with your partisan hackism. Nothing can stop the trend of demographics and entitlements. We are AT BEST, Japan.
Jeffrey –
So the more oil we use, the less we have left? Yes, well, that’s true.
I don’t understand the policy implications, however. Should we not then develop shales, the Gulf or Alaska?
I hate to be a bit pedestrian here, but I see the challenge to solve is the one before us: getting more affordable transporation.
This means:
In the short run: More oil.
In the medium term: CNG based on affordable tanks for vehicles.
In the long run: Self driving cars to make electric vehicles economically viable.
We know what we need to do. It’s not rocket science. It about determined implementation.
kharris –
If oil doesn’t matter, then:
– Why did the financial crisis hit just the advanced economies–exactly the ones donating their oil consumption to the emerging economies? Why didn’t it affect, say, the Philippines, Nigeria and Ecuador, rather than primarily the OECD economies? What was the common denominator? Are you arguing that goverance collapsed simultaneously in all these countries but remained intact in, say, Venezuela, Argentina,and India?
– Why are Canada, Norway, and Australia in good shape compared to the rest of the OECD?
– Why did the path of the US economy begin to deviate from that of Europe just as WTI and Brent began to diverge? What’s the critical difference between Europe and the US in the last year?
– Why are wages and investment so high in the oil patch if the issue is a lack of aggregate demand? Shouldn’t they also be low? Don’t oil prices speak to a constrained commodity?
– Do you think oil is linked to the economy at all? Do you believe we could take away all oil consumption and still go on as before? Were the oil shocks of the ’70s really oil shocks, or just misnamed? What price of oil can the US afford? Can it afford $115 Brent? On what basis do you think so? And if not, does it not stand to reason that the US must be losing oil consumption, just as the historical record plainly shows? How do you think that might affect the economy?
So, by all means, if you’ve got a nice global narrative, let’s hear it.
Reason jobs haven’t returned more quickly: Anti-business sentiment of administration. Small and mid-size businesses have been holding off new projects and hiring over concern about cost of Obamacare.
Will Congress reach agreement on fiscal cliff before end of year: Will pass temporizing bill that will spread the fiscal cliff out across 2013 and 2014 as a downward sloping hill.
Which party at blame for weak economy: Pre-2009 both parties. The momentum of that carried over. Current 4 years, Democrats including White House more to blame because impediments to growth have not been addressed. No budget from White House for 4 years.
How big a concern is the deficit: The most fundamental task of a civilization is to continuously produce a surplus (see Carroll Quigley, Evolution of Civilizations). Net national saving as share of GDP peaked in the 50s and has now gone negative.
Whose deficit ideas are more credible: Romney’s with focus on growing the economy to generate revenues without raising tax rates.
How does Obama’s performance on the economy rate: The lowest grade professors at Oxford give including double minus. Ideology has been the focus, not economic growth.
True or false – Did Obama’s stimulus plan work: As poorly put together as it was, it played a vital role in staving off a collapse of the financial system. Republicans , and 46% of the academics polled here, do not grasp that in a crisis the Keynesian multiplier is very, very large.
Paul Ryan’s budget proposal has been the only one on the table! What does that tell us?
Easiest federal budget program to cut is: Defense spending — though that is not the answer to the more vital question of which programs should be cut.
True or false – the global economy is better off than it was a year ago: False in that Europe, the US, and Japan have a larger and still rising debt burden. Debt ratings of all 3 are at historic lows for modern times.
True or false – the global economy will be better off a year from now than it is today: Depends on the outcome of the US election and on how the crisis in the eurozone is resolved. Both are a coin toss at this time. A pro-growth administration in the US and a managed-dismantlement of the euro currency would make this true. George Soros: ‘If the world could somehow persuade Germany to pull out of EMU, Europe’s never-ending crisis “would disappear in thin air”’
The biggest obstacle to global growth over the next year: The US regaining its economic footing. Otherwise real GDP growth in the US will fall further, and the likelihood of recession will rise significantly by yearend 2013.
Spain is where the crack in the dike is most worrisome.
Europe has entered a recession. Eurozone leading indicator down 18 consecutive months and on its low.
How big a threat does the euro crisis pose to the global economy: On 1 to 10 where 10 is worst, the threat is on the order of a 7.
How big a threat does China’s slowdown pose to the globe: On same scale it’s no more than a 3.
The IMF projects 3.9% global growth for 2013: This forecast will be too high unless the biggest obstacle(s) to growth are promptly addressed.
Will the euro currency survive the current crisis: Europe’s political elites are better than 50-50 likely to consolidate sovereignty in Brussels as the masses of the 17 nations no better understand their impending loss than US citizens understand the accelerating decline of the American empire. Odds are the euro survives through 2013 and perhaps a lot longer. The fate of the US and Europe are intertwined as though by an umbilical cord as they constitute Western Civilization.
Winners and losers from the global recession: Western civilization is the loser, upcoming civilizations on the periphery are the winners – China’s foremost.
Steven,
The ratio of Global Net Exports of oil (GNE*) to Chindia’s Net Imports (CNI) fell from 11.0 in 2002 to 5.3 in 2011. We can argue about what will happen from here, but the fact remains that the rate of decline in the GNE/CNI ratio has accelerated in recent years. At a GNE/CNI ratio of 1.0, the Chindia region alone would theoretically consume 100% of GNE.
I’m questioning the underlying premise that we can indefinitely maintain some level of growth in our “Wants” based economy, and as noted above, I especially question the future of our auto centric suburban way of life. In my opinion, we have only maintained a post-2002 low five year running average rate of growth in the US because of various tax cuts combined with massive deficit spending–funded by real creditors and by the Fed.
My primary concern is that a desperate–and I think largely futile–effort to maintain the Business As Usual “Wants” based economy is going to hinder our ability to maintain a “Needs” based economy.
*Top 33 net oil exporters in 2005, BP + Minor EIA data
To Jeffrey’s point, from Credit Suisse:
Campos decline rates: “the IEA says 12%”
The IEA says so. We have long argued that, due to a number of reasons, Campos production has not been performing as expected, thus declining faster than PBR’s historical 7-10% guidance. Last week, the International Energy Agency (IEA) published its Oil Medium Term Market Report and, for the first time we can recall, ran a specific decline rate analysis in the Campos basin with over 700 different wells. We provide key findings from the IEA below, keeping in mind PBR has already acknowledged its production will only show stronger growth from 2014.
12% decline rate was the annual decline rate for post-peak Campos wells in H1 2012, using IEA methodology. This number actually came down from c.20% decline in 2009-2011, though there is still a large variability. Worst quartile wells declined by more than 30%, while best performing wells declined by less than 8%.
Water cuts of c.60% are at surprisingly high levels, and mean that PBR is producing 50% more water than oil in the Campos basin (we though watercuts to be c.40%). This is a key leading indicator of future decline rates in the IEA’s view. High water cuts are particularly serious offshore, where liquid handling capacity is usually constrained. Petrobras has already embarked on subsea water separation and injection projects (in the Marlim and Albacora fields), though these are still prototypes.
The significance of these trends, in IEA’s view, imply that existing wells in Campos should decline at 25-35% next year (with a less steep decline thereafter). The IEA estimates that PBR’s new wells would have to add at least 130kbd every year (equivalent to one large FPSO) in order to keep production flat at 2011 levels. Given that 2012 will likely see only one or two platform additions (Cd Anchieta already producing, Cd Itajai risks delay to 2013 due to a fire in the FPSO), and the PROEF will only increase efficiency gradually, it is looking increasingly clear that production growth will indeed only come in 2014, if not later.
kharris: I would like a larger sample, but the WSJ survey is around 50, and the Philadelphia Fed’s Survey of Professional Forecasters has a little over 40. Yet we accord importance to the results from those surveys.
JBH: While NFIB identifies health costs as a top issue, it doesn’t say ACA is the issue. If you haven’t been paying attention, health care costs have been a concern for a while. I would argue ACA will lower costs relative to business-as-usual over the longer term.
JBH,
Excellent post!!
Two comments –
While there is no doubt that anti-business sentiment of the administration has stiffled job growth, that sentiment has actually been put into law concerning small businesses and if President Obama gets his way he will reduce the investment ability of pass-through businesses by a significant amount, including state taxes many pass-through businesses will see taxes at almost 60%.
Congress will not come to a resolution on the fiscal cliff and we will fall off. Because of that it is pointless to ask who is to blame. The most important question is what will be done after we fall off of the cliff. Will a new administration simply accelerate the fall or actually reverse the policies and laws that created the crisis?
President Obama has told us that he wants to cut defense and increase the prices on energy so costs on citizens will increase while government spending will decline. Second, we know that President Obama has stated clearly that he will raise taxes on pass-through businesses, individual taxes on those making over $200K/year.
I am not thrilled by Romney’s plan but compared to the intentions of the President if he is reelected – God help us!