In response to what I thought were straightforward renditions of the data indicating reductions in government spending, reader W.C. Varones writes: “Cutting government spending” is a real stretch.” In a (perhaps vain) attempt to convince him that indeed spending is declining, I present data from BEA and CBO (I am hoping that he hasn’t joined the Jack Welch view of government statistics gathering).
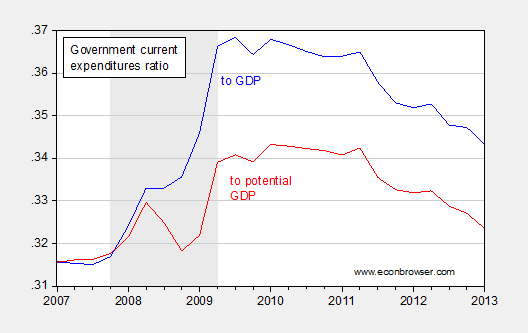
Figure 1: Share of government current expenditures (all levels) to GDP (blue), and to potential GDP (red). Source: BEA, 2013Q1 third release and CBO, Budget and Economic Outlook (February 2013).
Note that these government spending figures pertain to spending on goods and services, as well as transfers (and interest payments).
Sure looks like the gradient is negative to me, regardless of normalization. And despite protestations about the decline being relative to a high point, I will merely observe that the current ratio to potential GDP of 0.324 is less than that recorded in 1986Q3 (under President Reagan).
Sometimes, I wonder If we can’t agree that down is down, what hope is there?
Update, 7/1 11PM Pacific: Reader Jonathan asks about the composition of government consumption cuts versus transfer cuts. Figure 2 shows the breakdown.
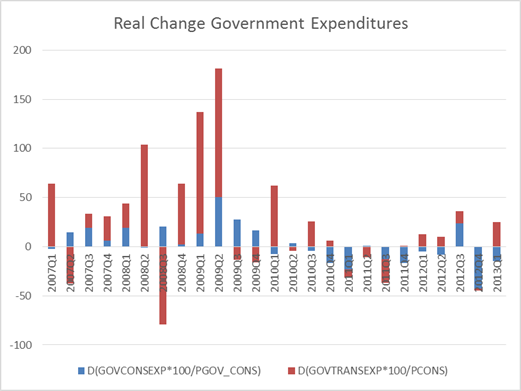
Figure 2: Change in real government consumption (blue), and real transfers (red). Government consumption deflated by government consumption deflator; government transfers deflated by personal consumption expenditure deflator. Source: BEA, 2013Q1 third release and author’s calculations.
most who object to government spending are objecting to the social insurance programs, which are included within PCE in GDP accounting..
is agreeing on the present value of government liabilities easier?
The Gods contend in vain so why does Menzie think himself greater than the Gods?
Menzie is greater than Varones so he will have to be content with that accomplishment.
Is govt spending declining in dollar terms?
A couple of comments. Notice two things. First Menzie is measuring expenditures to GDP. Let us say that the private sector increases by 10% but the government increases by only 5%. Based on Menzie’s calculations this 5% increase is a decrease in government expenditures. Second thing to notice is that, even using Menzie’s quationable ratio, the graphs do show thta compared to the massive TARP and Obama Stimulus programs spending has decreased, but compared to the Bush years spending is still pretty high, and the Bush years were higher than the boom years of the Clinton administration. I am not sure this proves much other than the fact that a Republican House of Representatives has held the increase in spending down. But I wouldn’t give the Republicans too much credit.
The President’s Budget shows outlays up about $140 bn for 2013 compared to 2012.
But these are pretty tight tolerances. If the economy does well, 2013 could conceivably come in a bit below 2012. On the other hand, if interest rates continue to rise, 2013 could well be higher.
Best guess: Spending to be broadly flat to moderately up.
Well, if I have to be innumerate, there’s no finer company I could ask for than folks like Ricardo and Steven Kopits.
Ricardo 2012q4, govt current exp = 5507bn, 2013q1, 5487bn, SAAR. That is “down” in my book. Don’t know in your alternate reality.
If GDP is increasing faster than government spending, the result will be a negative trend in the ratio of spending to growth. That doesn’t mean, in absolute terms, government spending has decreased from prior year or two years ago or five years ago [although it may mean that].
So the answer to who is correct may be: yes.
Bill at calculatedrisk has it right : it’s not about spending up or down, it’s about how quick down – that may or may not disturb the oscillating system.
Well Menzie, anyway, good luck with Ricardo a.o.
Minzie,
You didn’t read my post very carefully. The only comment I made that comes close to addressing QTR over QTR numbers was that the Republican House has held spending down.
You didn’t address my comment about your ratio, nor did you comment on spending today being above spending in the Clinton and Bush years.
You once again created a strawman and then beat him to a pulp. Good job!
Menzie, do you have a breakdown of spending by type? (I know it exists but I’m lazy.) My reason for asking is that many people argued Britain wasn’t engaged at all in austerity because spending measured in pounds remained stable (and grew a little). But the composition of spending shifted dramatically toward the social safety net while public investment spending dropped just as dramatically. We now see a near complete reversal in opinion so those who formerly argued austerity wasn’t real now accept the drop in public investment has hurt GDP.
That said, you can present all sorts of evidence about the share of government in the economy, from the ratio of government workers to population on, and point out these show government has shrunk as the country has grown … and it will be like talking to rocks. Stupid is as stupid does.
Menzie: You cannot convince people like Varones who see everything including data through the distorting prism of ideology!
Re: “Sometimes, I wonder If we can’t agree that down is down, what hope is there?” Well, the “I don’t believe the numbers / the numbers are academic, it’s the perception” position is a deliberate tactic designed to make it impossible to agree. They are going “deep stupid” in order to sterilize any logical and fact-based argument. In other words it’s smart to go stupid, rational to go irrational, since they know they can’t win in the intelligent / rational / logical domain.
Ricardo: You implied absolute dollar spending was still increasing. I provide evidence it is declining. (In real terms even more so.) You assert spending ratios were much lower in the Bush years. In 2008 (the last Bush year), the ratio to potential GDP was 0.324. In 2013q1, it was … 0.324. Sigh.
Baroness appears to be kicking your …..
Stretch an absolute spending chart so it starts a few decades ago, and draw me a trend line. Any trend line will do, log, linear, polynomial.
I’m sure government spending relative to the price of flash memory, gym socks and butane since 2000, but WTH cares?
KevinM: This from a guy who disbelieves in global climate change. Oh, well. On February 7, 2009, you wrote:
Please, could you follow up on not checking in any more, if you are going to write such opaque things. The last sentence in your last comment is not even a sentence…
Jonathan: See added Figure 2. I think it’s true that the cuts were more tilted to government consumption than transfers.
Menzie wrote:
You implied absolute dollar spending was still increasing. I provide evidence it is declining. (In real terms even more so.) You assert spending ratios were much lower in the Bush years. In 2008 (the last Bush year), the ratio to potential GDP was 0.324. In 2013q1, it was … 0.324. Sigh.
Oh, come on Menzie. I didn’t imply anything, neither absolute numbers or your ratio during the Bush and Clinton years. Perhaps you inferred that is what I said but if so it was your mistake.
I would have thought by now that you would understand that I see the flaws of GDP so would not refer to such a ratio in the Clinton, Bush, or Obama administrations to prove anything.
“I would have thought by now that you would understand that I see the flaws of GDP so would not refer to such a ratio in the Clinton, Bush, or Obama administrations to prove anything.”
To compare to “potential” GDP is even more laughable.
When the national debt is growing slower than 1% I’ll be convinced we’re spending less.
The thrust of this post decries the visible trend of reduced government expenditures since their historic high in 2009. The premise is that this has held back economic growth. This premise draws its rationale from Keynesian economic theory. Keynesian theory is a theory of the short-run. Indeed, few would argue that in the current environment a dose of proper fiscal stimulus would in the period in which it is applied raise growth. But there would be longer-term consequences of the opposite sign. And these are just flat not being recognized.
The more fruitful approach is to think from a celestial dome perspective about how to achieve maximum sustainable growth over the long-run for all Americans. All history informs us that no civilization (nation) has ever survived without putting aside a surplus. Deficit spending is the diametric opposite of surplus. This is not to say that deficit expenditure is always wrong. At certain rare historic junctures it is quite the appropriate thing to do. The most recent was in 2008-09 when the financial system was in jeopardy of collapsing. We are now four years beyond, however. The financial system has been saved. The application of the trillion dollars of stimulus enacted in 2009 has had its short-term salubrious effect. Growth, slow as it has been, has been lifted. But at the cost of driving the national surplus negative each of the past four years. Unprecedented since the Great Depression. Moreover, the debt ratio is still on the rise and is projected to remain very high into the distant future.
A new dose of fiscal deficit spending would: (a) drive the surplus further negative for years more, (b) take the debt ratio higher and on an exponentially rising trajectory once interest costs on the debt kick in as interest rates normalize, (c) take another slice of resources away from the private sector which is the economy’s foundation and ultimate source of all government spending, and (d) erode America’s long-term productivity, since true productivity is far greater in the private sector than in government. That there is no official measure of government productivity speaks volumes on this score. The BLS only computes business sector productivity. Moreover if the past is any guide, any new fiscal stimulus would be mostly wasteful as the funds would go to pork rather than to rational investment projects with long term payoff that (a) had clear-cut favorable benefit-cost ratios and (b) could not also have been done by the private sector in the first place.
Until the less-visible long-term in all its essentials is laid on the table along with the plainly easier-to-see short-term, it’s like two ships passing in the night.
Ricardo: You wrote:
To me, it seems that you’re saying if only I’d measure in absolute dollar terms, an increase would have been registered, and the data I provided indicated that was not the case. My apologies if I inferred what would seem to reasonable to most sentient people, and yet was not your implication.
Anonymous (6:39AM): Sorry, but is the blue line (ratio to GDP) declining or not? Simple question, hopefully a simple answer, at least for most of us.
Oh, for Pete’s sake, how can people argue about actual numbers?
– US government outlays are declining as a share of GDP. (And it’s a good thing, too–even 4.5% deficits are unsustainable).
– In dollar terms, Fed govt outlays were $336 bn in May, the highest since August 2012.
– For the 3 months ended May 2013, outlays averaged $307 bn, compared to $302 bn for the three months ending Dec. 2012, and $311 bn for three months ending May 2012.
– On a YTD basis, outlays averaged $304 bn, versus $306 bn for the same period 2012.
Everyone happy now?
Steven Kopits asked:
Everyone happy now?
🙂 LOL! 🙂
Steven Kopits US government outlays are declining as a share of GDP. (And it’s a good thing, too–even 4.5% deficits are unsustainable).
Just because something is unsustainable in the long run does not mean you shouldn’t do it in the short run. Borrowing to go to med school is not sustainable over the long run, but that doesn’t mean med students shouldn’t borrow today in order to become doctors tomorrow.
I don’t understand why you think it’s a “good thing” that outlays and deficits are declining when we still have a substantial output gap and the prime working age employment-to-population ratio has barely budged since the onset of the Great Recession. In terms of your personal life the effects of the Great Recession might be in the rearview mirror, but there are still millions of long-term unemployed out there and for them the recession is ongoing.
BTW, if you think a 4.5% deficit is unsustainable, then why did you support Romney? His tax plan locked in a structural deficit (as opposed to just a cyclical deficit) that would have been not far removed from 4.5% of GDP.
Slugs –
Oil consumption in Europe and the US is 17% below its peak level. That’s astounding.
We have spent $3.5 trillion on upstream exploration and production in the last seven years, and we have a feeble 5% increase in the oil supply to show for it.
In the previous seven years, we could have produced that volume for about $700 bn. So productivity in oil and gas E&P has dropped so badly, that we have incurred a global loss of $2.8 trillion in welfare in the last seven years. That’s right up there with the subprime mortgages, and the bailouts of any number of European countries. It’s a huge number, and it’s not an accounting entry. The money was actually spent trying to get oil out of the ground.
What I see in the US in 2013 is broadly the continuation of GDP growth trends we’ve seen for three years now. Indeed, it seems a bit better than last year.
So, I believe we are supply-constrained, not demand-constrained. I believe that increased government debt will not lead to increased prosperity. And I believe that the risks attendant to increased debt are real and substantial. Therefore, I believe fiscal consolidation is a good thing.
It’s not for a lack of empathy with the unemployed, but I think we have to start living within our means.
Kopits: what fraction of $3.5T was paid to the owners of rigs and other oil field equipment as excess rents due to equipment shortages, rather than actually on productive activity?
If you think fiscal consolidation is a good thing, I suggest we start by removing preferential tax treatment of unearned income like capital gains, and carried interest. I’m betting the multipliers are a LOT lower than on unemployment insurance (which no one receives without having worked).
Bena –
I would guess that excess profits (profits above normal profits) were 5-10% of the total mentioned. In addition, labor did very well, probably as much again.
Were this the thrust of the story, that would be comforting. Alas, the bigger part is the increased cost and complexity of extracting oil. And indeed, profits margins on the industry are declining, and so are P/E ratios. So the deeper problem is the collapse of capital efficiency in the business. An example: In 2008, Chevron had an upstream margin of $22 bn. It had the same margin in 2012, but oil prices were $15 higher in 2012. But that’s not the disturbing part. To produce that margin, Chevron employed $64 bn of capital in 2008; in 2012 it required $102 bn, a 60% decline in capital efficiency in just four years! That’s astounding. That’s what being post-peak means.
As for the carried interest, I am on the record as saying that it should be treated as ordinary income.
Kopits:Fair enough. Some low hanging fruit on the demand side: I updated my mental data banks on U.S. sectoral oil consumption. Power companies have been doing a good job decreasing remaining (largely islanded from the grid) petroleum consumption in generation(82% decline from 2005-2012, so that just 0.6% of oil is used in the power sector), but residential and commercial sectors are declining more slowly (still ~4.6% by heat content). For $70-100B given away we could eliminate that much more quickly while temporarily employing factory workers and residential construction tradesmen in this time of elevated unemployment. Given the domestic source of most non-petroleum energy and the foreign source of the marginal barrel of oil, this investment in fuel switching would improve the trade balance by roughly $30B/yr of net crude(I assume slippage in increased imports for PCE will be roughly offset by increased export of value-added as petroleum products). The only likely domestic losers are local distributors. The additional 0.9 million bpd of reduced demand would also have a salutory effect on import oil prices.
Note that 55% of oil consumed in the U.S. is not motor gasoline. There are other levers.
Absolutely right, Bena.
But underlying the initiatives you propose are, implicitly, the rates of efficiency gains possible in the economy. We can take all of the changes you suggest and aggregate them into an oil consumption/GDP statistic. That will cover everything: electric cars, better mpg, social re-organization, etc.
The question is, how fast can the economy adapt? How fast can efficiency improve? Jim has written on this, so have I (numerous times). Jim tossed out a 2.5% efficiency gain number, and I don’t have much more to tell you than that. Efficiency gains can certainly reach 2.0%–the historical record confirms that. For periods of time, we have seen efficiency gains as high as 3.8% without a recession. But I don’t think that pace can be sustained day in, day out. So I suspect Jim’s number (he really does have an uncanny sense of these things) is probably about right when considering the full business cycle. So let’s work with 2.5% as the efficiency gain “speed limit” for the economy.
Now, if we have to reduce consumption by 1.5% per year and efficiency gains average 2.5% per year, then GDP growth is going to be capped at around 1% per year.
And now you understand why I say that we are supply-constrained. I completely agree with you that we have to change our energy consumption and social organization. But the issue is how fast that can reasonably be achieved. If we accept Jim’s efficiency estimate and my estimates for reduced oil consumption, then the answer is, “Not fast enough”.
It seems then that oil is, and will remain, a binding constraint on economic activity.
If you accept this line of reasoning, the Keynesian position becomes much less tenable. The issue is not primarily a lack of aggregate demand, but a chronic shortage of transportation fuel. You can’t stimulate your way through this problem. You have to adjust to having less oil. Jeffrey Brown has made this point many times.
In this world (to address Slugs’ point), government spending is preventing adjustment. Therefore, fiscal consolidation is desirable i) to permit the necessary re-pricing of factors of production, and ii) to acknowledge the impaired productive capacity of the economy–you just can’t borrow as much anymore.
See the “No Vehicle in Household” chart for a nice illustration of what I mean by “supply-constrained”.
http://www.cnbc.com/id/100866481
My point is that government interventions are available to substantially increase the RATE at which we reduce our oil need. CAFE is increasing the slow drift rate, but crash programs have validity in the present circumstances.
Paying for people to eliminate petroleum consumption in residential and commercial space heating applications makes it happen much faster than waiting for them to bite the bullet due to price pressure. To the extent your supply contraint argument is correct(and note that I don’t consider it the primary factor in the current U.S. economy but a significant contributory factor), then there is economic benefit to others in eliminating ~100% of this demand over a couple of years. While some might argue that these “benefits” are simply pecuniary externalities, I would argue that particularly at the ZLB (given the consequent absence of Fed sterilization), and given the marginal barrel is imported, there are important Keynesian stimulus effects of reducing oil demand faster than required by price, but without curtailment. Money not spent by consumers on oil imports will largely be spent on American goods and services, with a high multiplier due to where the money will go. The nature of the good will increase the multiplier of the stimulus due to the capture of some of these externalities by other American consumers(since oil is a global market, only the price difference on remaining imports will be captured, on net, with American oil producers losing what consumers gain on domestic production), so long as we remain a net importer.
Another example of a lever the feds could easily and cheaply pull–making EPA Smartway mandatory (hardly onerous since the ATA recommends their members participate) and increasing the requirements, but funding the required upgrades by trucking companies (should eliminate the vast majority of rational objection for $50-100B). About 12% of U.S. oil demand is road freight. In the short-term (1-3 years) we could eliminate about 20% of that demand without curtailment if we did the above.
In the medium term we should be paying for cheap dual-fuel LNG conversions for locomotives and semi-tractors (LNG for price/emissions, diesel for range and availability). In the slightly longer term (when unemployment is lower) we should be moving freight market share to rail. One way to encourage that would be to add a fee to any freight leaving a currently or previously rail-served port by truck.
Kopits: to the extent that reduced household vehicle ownership is not driven by demographics (as some of it is), it’s driven by economics. I suspect most of the increase is due to job loss, not gas price.
I am arguing the causality in reverse. The price of oil is leading to job loss.
Your argument would be stronger, Bena, if the price of oil were below the historical carrying capacity of the US economy; if the capital efficiency of exploration and production expenditures were steady or improving; and if the oil supply were able to grow at its historical rate (ie. 0.75 x GDP growth — see Jim’s earlier posts on this).
None of these conditions is met. This would seem to make the causal relationship from oil to jobs, rather than from jobs to oil, more likely.
You are arguing a demand-constrained case; I am arguing a supply-constrained case. The data much more strongly support the latter view.
Kopits: I am actually arguing for a mixed case. I think high oil prices explain part, but not all, of the current economic weakness in the U.S.
This leads me to agree with you that increased oil efficiency would improve economic prospects markedly, but to disagree that fiscal consolidation wil do so.
I’m quite comfortable with the accuracy of both those views.
Assume a hypothetical case where the carrying capacity price of oil is exceeded in the U.S. economy. What is the mechanism by which it binds? Most oil use is consumption rather than input to production (this is even easier to understand if energy use in refineries is considered a loss in transformation rather than conflated with external secondary industrial demand for refined products). Although production inputs become more expensive, which certainly has effects on production, my contention would be that most of the binding mechanism relates to reduced PCE by folks who have less to spend after paying off their gas card. This reduced demand for other goods leads to reduced economic growth. Being an oil importer makes this significantly worse.
OK, now assuming the above scenario, look at alternative after-tax income distributions. It is my contention that carrying capacity would be higher if income were not concentrated. Revenue neutral tax reform which reduces inequality would improve the economy in this scenario. Fiscal expenditure which improved oil efficiency for low-income consumers would improve the economy in this scenario. Greater bargaining power for labor (whether via lower unemployment or a restored right of association), leading to increased labor income, would improve the economy in this scenario. Higher minimum wages would improve the economy in this scenario.
JBH, thank you for that excellent post.