…in the minds of the too-busy-to-consult-data, but have time to comment on blogs
Reader J.D. wrote in response to my last tabulation of shrinking government employment:
More related to the criticism is growth in government bureaucracy and the army of bureaucrats. So if you can strip out military, postal, and temp census workers (which I don’t have time to do myself at the moment), you’d get an even more accurate graph to either validate or contradict the argument.
So, here are plots of government and Federal employment (ex.-temporary Census workers), and Federal and ex-postal, respectively, so we can assess the view that government employment is expanded relative to 2009M01 (J.D.’s baseline) (Note: since the BLS series is civilian payroll employment, I didn’t need to strip out military).
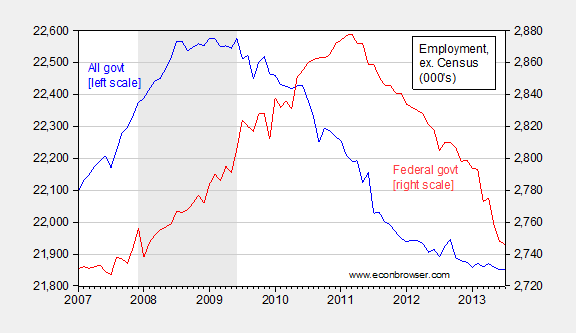
Figure 1: Government employment, all levels, ex.-Census workers (blue, left scale), and Federal employment, ex.-Census workers (red, right scale), in 000’s. Source: BLS.
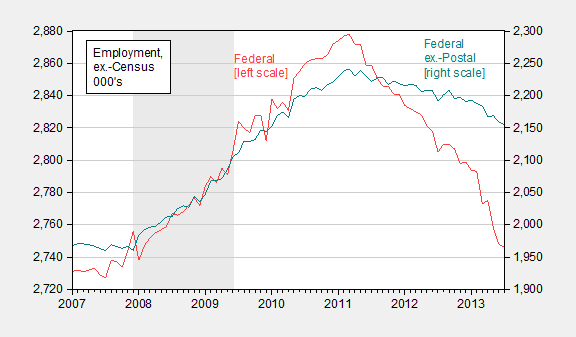
Figure 2:Federal employment, ex.-Census workers (red, left scale), and ex.-Census workers and ex.-Postal Service (teal, right scale), in 000’s. Source: BLS.
July statistics indicate Federal employment workers is 38,000 lower than when President Obama took office; excluding Postal Service, it is 107,300 higher (although it is unclear to me why one would exclude Postal Service; Heritage Foundation provides their rational here). Over this same period, the labor force is 1.6 million higher. The decline in Federal employment has averaged 9.7 thousand per month over the last three months (and excluding Postal Service workers, 4 thousand per month).
Of course, these figures are tabulations of employment, rather than hours worked. As highlighted in this article, hours worked have probably declined even faster.
Normalizing Federal employment by population yields Figure 3 (population data through June):
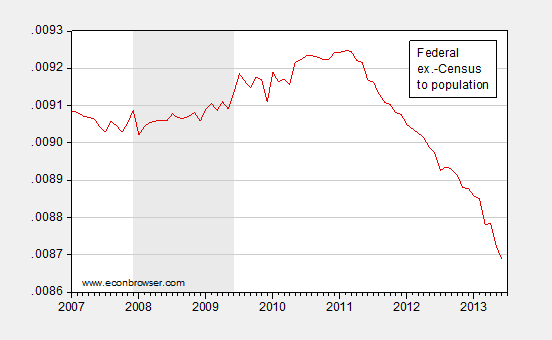
Figure 3: Government employment, all levels, ex.-Census workers, normalized by population. Source: BLS.
Update, 8/4 5:30PM Pacific: Here is a graph of employment since 1967, normalizing log values 1967M01=0, to show comparative Federal and private nonfarm payroll employment.
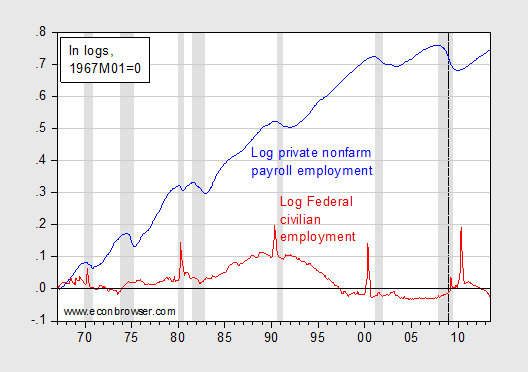
Figure 4: Log private nonfarm payroll employment (blue), and log Federal employment (red), 1967M01=0. Source: BLS, NBER, and author’s calculations.
Update, 8/16, 3:20PM Pacific: Rick Stryker has provided data to validate his assertion that Federal employment excluding employment not based on appropriations is still higher than when President Obama took office. Figure 1 illustrates the data he has graciously provided me.
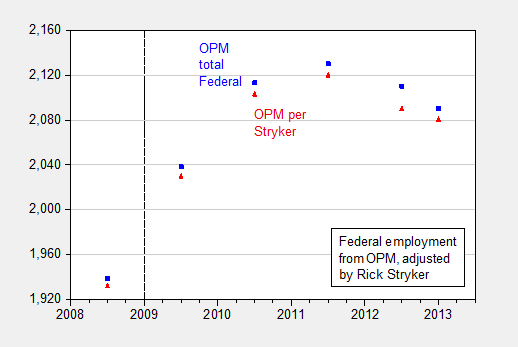
Figure 5: Employment according to Office of Personnel Management (blue square), and adjusted to remove agencies not dependent on appropriations (red triangles). Dashed line at 2009Q1. Source: OPM, and personal communication from Rick Stryker.
These figures are lower than, but follow the same pattern as, BLS measured Federal government employment ex.-USPS ex.-temporary Census workers.
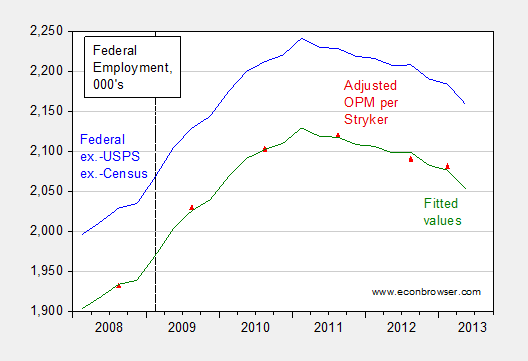
Figure 6: Federal civilian employment from BLS, ex.-USPS, ex.-temporary Census workers (blue line), OPM series excluding employment of agencies not supported by appropriations (red triangles), and fitted values using log-log relationship between BLS and OPM series (green line). Quarterly BLS series are end-of-quarter values. Dashed line at 2009Q1. Source: OPM, personal communication from Rick Stryker, and author’s calculations.
Figure 6 also shows the fitted values from regressing Rick Stryker’s preferred series on the BLS adjusted series (in logs, slope coefficient 0.97, adjusted-R2 = 0.99). Note that employment declines quickly in the quarters after March, when the sequester started being implemented. (OPM figures for June will be available in late September).
It is important to note the per capita trend; if 2013Q3 is like predicted 2013Q2, even using Rick Stryker’s preferred series, Federal employment per capita will be below levels recorded at 2009Q1.
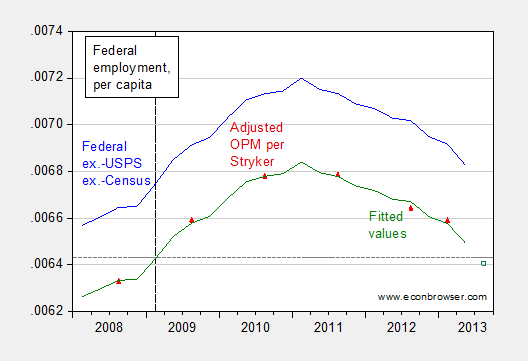
Figure 7: Federal civilian employment from BLS, ex.-USPS, ex.-temporary Census workers (blue line), OPM series excluding employment of agencies not supported by appropriations (red triangles), and fitted values using log-log relationship between BLS and OPM series (green line), all per capita. Quarterly BLS series are end-of-quarter values. Dashed line at 2009Q1. Source: OPM, personal communication from Rick Stryker, and author’s calculations
For those who believe that, for macroeconomic analyses, particularly with respect to impact on GDP via multiplier effects, overall government employment is relevant, then Figure 3 is relevant.
Since we are only seeing a few years, we see only very short term trends. How does this look for the last 20 years, 50 years?
Also, which government positions have been phased out?
Rusty: There is a St. Louis Fed database called FRED, which is freely accessible, and provides the data you request, back to 1939 (along with pretty much any other series you might want). Employment has been tending down since 1990, despite the substantial increase in population since then.
You can repeat this all you want but it won’t sink in.
1. Taxes are lower as a percentage than before, not higher.
2. Government is smaller as a percentage than before, not larger. (BTW, I think these numbers include Homeland Security.)
If I look at the FRED data to 1939, it looks like government employment has its big bulges under GOP Presidents. After WWII, a big fall under Truman and then a ramp up under DDE. Stable and then another bump up under Nixon (though beginning under LBJ). Stable and then a hump under Reagan and GHWBush. Declining under Clinton, smaller hump with the financial crisis and then declining.
Menzie,
The US Postal Service is an independent agency of the Federal government, not part of the federal government. Unlike the federal government, it finances itself from its own revenues and receives no tax payer assistance other than some very small subsidies.
The decline in Postal Service employment has nothing to do with sequester, austerity, or any policy that would affect federal government workers. The big drop in Postal Service employment has been caused by a drop in revenues, which in turn has been caused by both a 2006 law requiring the Postal Service to pre-fund retirement benefits and a decline in first class mail volume.
If we want to understand federal government employment trends, we need to exclude the Postal Service. Once we do that, we see the truth of course: federal government employment is up significantly since 2008.
Rick Stryker: I see. In order to prove that Federal government employment is not declining, we need to redefine Federal government employment such that it is not declining.
By the way, this CRS report notes that USPS can and has borrowed from the US Treasury.
Interesting chart compareing employment by McBride :
http://www.calculatedriskblog.com/2013/08/percent-job-losses-great-recession-and.html
Note the second dip in 1937 due to austerity, which brought us Hitler, WWII and the holocaust.
To get in the weeds a bit, in 2006-2008, during the last two years of the Bush administration, it was discovered that “contracting out” Government services was, “Surprise,” costing more than doing the work in house (fixed profits and the overhead of upper managements multi-million dollar salaries). There was also a problem in DoD, CIA, and State of contractors committing war crimes, and just plain other crimes in war zones with no accountability since they were no really subject to the UCMJ and logistical difficulty of prosecuting individuals for incidents in foreign countries (including active obstruction of justice by the employers and agencies). So many jobs in DoD, CIA, and DHS were brought “in-house.” This expanded the number of Government employees in these agencies. But EPA, DHHS, and Social Security did not expand under either Bush or Obama. Not only as a % of total employment, but in absolute numbers Federal employment has been falling since 1960. http://www.nextgov.com/cio-briefing/wired-workplace/2010/09/too-many-federal-workers/53775/
However, as with most right-wing zombie memes, this one just can’t be killed.
“If we want to understand federal government employment trends, we need to exclude the Postal Service.” I agree with this (we should exclude employees of all government enterprises, of which the Postal Service is by far the largest). But looking at trends in only the last five years doesn’t provide much perspective.
What I did:
Take the number of federal government employees, remove the number of Postal employees, and divide by total US population. These data are all easily available from 1960 to 2011.
Between 1960 and 1992 this ratio trends down, but is remarkably stable at around one federal employee per 100 Americans.
Between 1992 and 2000 the ratio drops sharply to around one federal employee per 150 Americans! It remains at that new lower level through 2007.
Between 2007 and 2010 the ratio increases to about one federal employee per 140 Americans.
At the beginning of 2010 the ratio leveled off again. (The value was one employee per 141 Americans at the end of 2011.)
So – yes, there was a period of increase in 2008 and 2009, but it was short-lived and small relative to the drop in the 1990s. In historical terms, we are at a very low level of federal government employment.
Rusty Also, which government positions have been phased out?
You can easily find this information at the OPM website:
http://www.opm.gov/policy-data-oversight/data-analysis-documentation/federal-employment-reports/historical-tables/executive-branch-civilian-employment-since-1940/
The short answer is that federal employment is falling in all the departments that conservatives hate and actually rose in the three departments that conservatives love (Defense, Homeland Security and the Veterans Administration).
Rick Stryker federal government employment is up significantly since 2008.
And we also see that it’s down significantly since 2011. And if you will check out the historical tables you will see that Executive employment steadily fell during the Clinton years (~450K reduction), and then steadily increased under the Bush 43 years (~200K higher). Then we had a recession. Executive employment continued to increase until 2011. Since then it has fallen.
Menzie The reduction in hours worked probably understates the real reduction. Prior to the furlough government workers typically worked a lot more hours than the 40 hours/week they were paid. In other words, government workers are no different than private sector workers and teachers who also put in a lot of uncompensated overtime, such as working at home. But under the laws governing furloughs bosses are not allowed to look the other way. In fact, under the furlough rules it’s a criminal offense for a federal worker to even turn on his or her government issued laptop or Blackberry outside of furlough adjusted duty hours. And it’s a criminal offense for a supervisor to knowingly allow a subordinate to stay late, come in early or do any work outside of furlough adjusted duty hours. So actual output will fall more than metrics based on compensated output would suggest.
So, the post office does not count as government employment tally, yet still counts as a big government boogyman for privatization fetishists?
Not unlike welfare and entitlement spending reactionaries, to whom defense spending is invisible.
The shift to consultants might explain a big part. Actually the charts show very little movement, just the scale is shrunk to highlight the small changes. Certainly government should be a declining share of GDP, since basically it is a public good, free consumption. More efficient workers and electronics has eliminated a lot of need, for example. I don’t think any lawyers use secretaries to type for them anymore. Thus, overall, it is clearly a good thing that we have less government workers. If government was smaller, then the impact of fiscal policy would be stronger. As it is, G is so big that the marginal demand impact of the recent huge deficits have been puny.
pete: “If government was smaller, then the impact of fiscal policy would be stronger. As it is, G is so big that the marginal demand impact of the recent huge deficits have been puny.” I regret that this statement makes no sense to me. Could you point to a model that yields this implication.
It might simply be Heritage excluded the PO because FRED offers that as an option on the first page of federal employment data. Why not seize the opportunity.
Menzie,
I did not make a tautological argument. My argument, that you did not answer, is that PO employment is not determined by appropriations and that the big decline in PO employment results from factors idiosyncratic to the PO and has nothing to do with the administration’s policies. We should therefore exclude PO employment if we want to understand what is happening to federal employment.
Rick Stryker: But Congressional actions do determine levels of employment, etc., by virtue of requirement of prefunding of retirement benefits (in part). The fact that changes in USPS operations must be approved by Congress belies your assertion that USPS is not governmental.
Rick Stryker PO employment is not determined by appropriations and that the big decline in PO employment results from factors idiosyncratic to the PO and has nothing to do with the administration’s policies.
This is true of many components of federal employment, not just the Post Office. It’s called Non-Appropriated Fund (NAF) employment.
http://www.nafjobs.org/about.aspx
And not all of them are low-skilled jobs. For example, NAF employment includes many lab workers, quality assurance inspectors, aviation inspectors, etc. And by law, all jobs associated with foreign military sales are paid for using funds not appropriated by Congress. But all of those jobs are included in OPM’s Executive branch employment numbers.
pete government should be a declining share of GDP, since basically it is a public good, free consumption.
It’s also true that as a society gets wealthier it tends to demand more public goods because public goods are normal goods. The wealthier you are the more you worry about property crime. The wealthier you are the more you care about clean water and clean air and safe food and flood control and education and public health and just about everything. And the wealthier you are the more you want to fight your wars with capital and technological inputs rather than labor inputs.
@Pete: “Certainly government should be a declining share of GDP”
This depends. If you look at the past hundred years, GDP has gotten a lot bigger, and so has government. But since 1970, their growth has decoupled. This might not be so great, for the reason 2slugbaits points out (wouldn’t wealthier countries want more public goods?). It’s also interesting to note that the remarkable slowdown in the growth of government coincides with the remarkable slowdown in median wages. While productivity has gone up hugely since 1970, median wages have been flat. It’s interesting that the divergence between productivity and median wage starts at about the same time as the divergence between size of GDP and size of government.
By the way, all this talk about postal workers seems like a silly distraction. The basic trends look similar to me either way.
I see menzie is as long suffering as ever
and still mixes it up
down here in the comment cages
he upholds a sterling standard
few
of his accomplishment and ability
still maintain
after some many years of bloggery
The fact that the USPO is classified as an independent establishment of the federal government is hardly unique. The Social Security Administration (SSA), the EPA, NASA, the TVA, the Federal Reserve etc. are also independent establishments. In fact there are approximately 70 independent establishments, and government corporations, in the U.S. government:
http://www.usa.gov/Agencies/Federal/Independent.shtml
Why didn’t the Heritage Foundation exclude them in its analysis also? Or did they only exclude the USPO because its employment is sharply declining?
How did I figure we’d still be here harping on this. As it appears, Menzie still does not comprehend the argument regarding the growth in government employment. So I’ll do my best to elaborate on the logic regarding what count’s as government and what does not:
In what ways do the military or post office have any administrative or other rule-making authority, whether under the Administrative Procedures Act or any other statutory source, to make broad rules that affect the economy in general? We’re talking alphabet soup agencies here: you know, those bureaus and agencies enforcing federal criminal law or who are constantly trying to adapt or implement policy to make our lives “better.”
Most service members are not rule-making bureaucrats nor law enforcement nor public policy enforcement. Neither really is the postal service. And while most people would concede they are government employees, most people wouldn’t say that they are a part of the law-enforcement/regulatory subset of govt.
This really isn’t that difficult a concept to grasp.
Sure, I’ll concede the military bureaucracy (i.e., non-uniformed DOD employees, especially those involved in procurement) should count, since they are often a proxy for domestic job creation and economic stimulus. But definitely not counted should be the uniformed members themselves (I do believe they are not deemed part of the civilian non-institutional population and therefore excluded from employment computations, which is why I stress you treat them the same in your analysis here–simply for consistency with widely accepted definitions of labor force computation).
Not to mention that the charts Menzie generated for this post in fact prove the point made against Obama. He grew govt. And you’ll notice on every chart how, minus some momentum into the first quarter of 2011, when the 112th Congress commenced, that growth came to a stop because the GOP got its hands on the federal purse when it recaptured the House.
Obama doesn’t get to take credit for the GOP turning off the govt employment spigot, nor does he get to claim he’s reduced the size of govt.
That is the meat and ‘taters of my initial criticism of Menzie. The argument is that Obama grew government when the GOP had no power. Once the GOP got power and turned rule from one-party to divided govt status, that federal hiring binge ended.
J.D.: None — none — of the series graphed include uniformed military. Nor were they in the previous post from whence I pulled your comments. I stress this just so you know what we are dealing with.
So because USPS makes no rules, then we shouldn’t include them in the government head count? Thank gosh all those mail fraud laws aren’t to be interpreted and implemented! Also, what about all those scientists at CDC? They don’t make rules. Should they be removed from the count? How about the folks counting the number of spotted owls? Please send me your time series and I will be happy to plot the series for all Econbrowser readers to consider.
J.D.: For your benefit, I have added Figure 4 to highlight the massive (!) expansion of Federal employment over the past 45 years. This is the official (BLS) measure, not the series you would want, but since I don’t have that magical series, I await your supplying of your preferred measure (along with documentation of how you generated the series).
Menzie,
You are doing a lot of semantic wriggling. Let’s define the question carefully. Conservatives at the Heritage Foundation and other places are asking whether more federal dollars have been used to hire more federal employees during the recession and the recovery. So here is the question they are asking:
Have more federal dollars been used to hire more federal employees since since the Administration too power?
In answering that question, we have to exclude any part of the federal government whose employees do not depend on federal dollars. That means that among the independent agencies we should exclude the USPS but not NASA or the CIA. To 2slugbait’s point, we should also exclude NAF employment and there may be other categories.
The answer to the question is indisputable: more federal dollars have been spent to hire more federal employees since 2009. The administration said they wanted to grow federal government bureaucracy and they have. Since 2011, that employment number has trended down, no doubt the effect of the Republican win in congress in 2010. But it’s still higher than when the administration started.
Rick Stryker: Then the $15 billion loaned by the US Treasury, plus the $11 billion in arrears to the same, are not the American taxpayers? Why is the projected debt of $45 billion of any interest to any taxpayer then? [a] Perhaps it’s just semantics as you say.
Menzie
You say ‘rational’ as in ‘provides their rational’.
You actually mean ‘rationale’. A rationale is a reason or justification.
By Menzie’s argument should we should include the auto industry–GM in particular–as part of the government workforce. Given the current price of GM, the taxpayer is on the hook for a large portion of the government/taxpayer loan to GM.
Menzie,
The fact that the USPS borrows from the Treasury is irrelevant to the question as I have posed it. I asked
“Have more federal dollars been used to hire more federal employees since since the Administration took power?”
Excluding the USPS, the answer is clearly yes. You want to include the job cuts from the USPS but then you would need to show the cut in federal disbursements that led to the cuts in USPS employment. You can’t show these cuts since they don’t and can’t exist. As I mentioned, the USPS operates on its own revenues and does not take federal money, other than small subsidies.
You want to bring in the fact that the USPS borrows from the Treasury. Like a private corporation, the USPS borrows, although unlike a private corporation it’s only allowed to borrow from the Treasury and only up to a limit. Like a private corporation, the USPS must pay the borrowed funds back from the revenue it earns.
I’ve asserted the USPS borrowing is irrelevant to the question as I’ve posted. Perhaps you’d like to explain how it’s relevant?
Rick Stryker: I just wanted to show the bizarre nature of your definition. Then is the Fed a separate agency by your definition? Don’t think it gets regular appropriations from the Congress. Does have oversight from Congress. Oh, kinda like…USPS! Why don’t you go through the statistics, and pull out all the agencies you deem “nongovernmental”, and send the series to me (along with documentation/spreadsheet) and I will display on Econbrowser (I promise!) for all to see and consider the plausibility.
Based on all the various criteria that have been suggested here’s the example of the kind of thinking I think that you would have expected people making this argument to do.
Take an independent establishment of the federal government, for example, say the Tennessee Valley Authority (TVA). Ask yourselves the following questions.
1) Is most of its employment outside of Washington DC?
Check. (According to the OPM the TVA only has five employees in the DC area.)
2) Is it largely free of law-enforcement and regulatory responsibilities?
Check.
3) Is it largely independent of federal funding?
Check.
Now repeat the exercise for the approximately 70 other independent establishments.
Why hasn’t this been done?
From what I can see, two reasons.
1) FRED doesn’t have the employment data for these agencies like it does for the USPS, so conservatives would actually have to consult the OPM webpage for the data and assembling it would require doing some good honest work. Given the degree of mental and physical laziness which most conservatives are subject to this means it will never ever happen.
2) Few if any of these agencies have seen a big reduction in employment since 2008. In fact employment at the TVA is up from 11,330 in January 2009 to 12,762 as of September 2012 (the most recent data available), or by 12.6%. Subtracting these agencies doesn’t support their argument so it’s best not to do it.
Menzie,
Remember, YOU are the one wriggling and engaging in semantics (because Styker says so, and whoever makes an accusation first wins!). The fact that it’s possible to define government employment in a number of different ways and that the common definitions show government employment falling is a side-issue, irrelevant. The important thing is that it may be possible (haven’t see the data series yet, but maybe is better than data when the data don’t support one’s point) to make up a definition of government employment in which employment is growing.
I’m pretty sure we are about to see “government employee” defined to mean “boarder guard” in a comment soon.
James Pethokoukis has obliterated the claims of Keynesian Obamanomics.
The UE rate was to be 5% by now under Obamanomics. It is far higher than that.
Menzie,
There’s nothing bizarre about my definition. It’s bizarre to take an unadjusted federal employment series as evidence for whether government has been expanded or not, especially when you don’t subtract the USPS, a large influence that’s not related to federal disbursements.
I don’t think the BLS data is granular enough to do what what you suggest. It looks to me like they provide federal employment with and without USPS and that’s about it.
To really do this, I think you’d need to build the series from the ground up by looking at each federal agency and pulling employment statistics from their annual reports, a laborious procedure.
For example, I took a quick look and picked a couple at random. For the Dept of Labor the employment levels are
2009 16,003
2010 16,903
2011 16,915
2012 17,151
2013 17,395 (projected)
For the Department of Education, they are
2009 3989
2010 4199
2011 4387
2012 4312
2013 4279 (projected)
Both cases went in the direction I expected. Interestingly, the Dept of Ed looks like the federal series with USPS subtracted, peaking in 2011 and then tapering off.
The Federal Reserve is an interesting edge case. I’d be inclined to include it since it finances itself through seigniorage. I was surprised to see that employment has dropped a bit.
2008 17,965
2012 17,724
To Mark Sadowski’s point, I would not include the TVA since it does not depend on federal disbursements. And I would not include the USPS.
Wish I had the time to do them all. Maybe somebody would like to try it?
Here is a summary of the data for all the major agencies of the federal government, from the OPM. 2slugbaits provided the link:
http://www.opm.gov/policy-data-oversight/data-analysis-documentation/federal-employment-reports/historical-tables/executive-branch-civilian-employment-since-1940/
As you can see, federal employment is up in general over the first term. If you think federal employment was going down in general, then where are those cuts coming from? USPS is driving the false result that federal employment is down.
(thousands)
Fiscal Year 2009 2010 2011
Total Executive Branch 2,094 2,133 2,146
Dept. of Defense 737 773 774
Total Civilian Agency 1,357 1,360 1,372
Agriculture 104 107 104
HHS, Education, Social 139 144 143
Homeland Security 180 183 194
Interior 75 70 77
Justice 113 118 117
Transportation 57 58 58
Treasury 109 110 108
Veterans 297 305 314
Other 283 265 257
Rick Stryker: If you’re going to subtract USPS, shouldn’t you subtract off all the NAF employment 2slugbaits noted in order to be consistent? Or is consistency merely the hobgoblin of small minds…
Menzie,
Yes, you are correct that an adjustment for the NAF jobs is necessary. I’ll have to guestimate the NAF jobs adjustment, since there is not a lot of info on them. 2slugbaits may want to comment.
First, NAF jobs affect the DOD, so that’s where we’ll need to adjust. I saw an estimate of 25K NAF jobs in the airforce and 44K NAF jobs in the navy. Didn’t see anything on army or coast guard. I’ll assume that there are also about 50K NAF jobs for them, for a total of 119K. There were a total of 774K total DOD jobs in 2011, so that’s 119/774 = 15%. The total change in DOD jobs between 2009 and 2011 was 37K. Assuming that NAF jobs move proportionately with DOD jobs, then the adjustment would be 15% X 37K = 5.7K. So, I’d subtract 6K jobs from the total increase.
Rick Stryker: Good start. Please also deduct the employment from these Federally owned corporations: 1. Commodity Credit Corporation (15 U.S.C. 714)
2. Export-Import Bank (12 U.S.C. 635)
3. Federal Crop Insurance Corporation (7 U.S.C. 1501)
4. Federal Deposit Insurance Corporation (12 U.S.C. 1811)
5. Federal Financing Bank (12 U.S.C. 2281)
6. Federal Prison Industries (UNICOR) (18 U.S.C. 4121)
7. Financing Corporation (12 U.S.C. 1441)
8. Government National Mortgage Corporation (12 U.S.C. 1717)
9. National Railroad Passenger Corporation (AMTRAK) (49 U.S.C. 241)
10. Overseas Private Investment Corporation (22 U.S.C. 2191)
11. Pension Benefit Guaranty Corporation (29 U.S.C. 1301)
12. Presidio Trust of San Francisco (16 U.S.C. 460bb)
13. Resolution Funding Corporation (12 U.S.C. 1441(b))
14. St. Lawrence Seaway Development Corporation (33 U.S.C. 981)
15. Tennessee Valley Authority (16 U.S.C. 831)
16. U.S. Postal Service (39 U.S.C. 101)
17. Valles Caldera Trust (16 U.S.C. 698-v4)
If you calculate the time series and email me, I will post.
Is there any data on the number of federal contract employees? Based on a couple of articles I found online, the number of contract employees rose from approximately 2 million in 2000 to about 10.5 million in 2011, even while federal employment held relatively steady at about 2.5 million. I presume most of the increase was for defense and homeland security. It would be enlightening to see a cost analysis of contract employees vs. direct hires. I note that Booz Allen said that Edward Snowden’s salary was $122,000, at 29 years old. That’s very close to the maximum on the standard GS scale.
To Dan:
You will need to do better than “based on a couple of articles I found online” without a citation before anybody can your claim about the number of contractors in the federal government.
That said, the number of contractors did increase in most agencies up to some point in time, in part due to A76 actions and in part just because those were the personnel decisions that were made. As noted by others, however, many contractors were “federalized” when agencies noticed that the anticipated cost savings of contracting did not materialize.
Concerning Snowden’s salary, The DC Area GS scale is the appropriate one to use. Contractor salaries and AD salaries do not have to align exactly with the GS scale, but they often do. Snowden’s salary is a hair below what you would get for being a GS-14 Step 6, which is pretty high for his educational level, but well below GS-15 Step 10.
To Rick Stryker:
An interesting contrast within the numbers you report is between DOD-DHS-VA on the one hand and All Other Agencies on the other. When you do that, the situation looks like this:
Or, in other words, Defense and Security related are up about 6%, and everything else is down about 2%. Now, in fact, some of the changes are due to the absorption of contractors, but the overall pattern seems pretty clear.
Menzie,
Actually, I should not have subtracted NAF employees, since they are not included in the data. TVA and the Postal Service are also excluded, as is the Fed. But I agree that the list you have, to the extent that they are included, should be subtracted. My guess is that the adjustments are not that large. From the website, here’s what the data contains:
Executive Branch coverage includes all agencies except the following:
Board of Governors of the Federal Reserve
Central Intelligence Agency
Defense Intelligence Agency
Foreign Service personnel at the State Department (included until March 2006)
National Geospatial-Intelligence Agency
National Security Agency
Office of the Director of National Intelligence
Office of the Vice President
Postal Regulatory Commission
Tennessee Valley Authority
U.S. Postal Service
White House Office
Other exclusions include:
Foreign Nationals Overseas
Public Health Service’s Commissioned Officer Corps
Non-appropriated fund employees
Legislative Branch coverage is limited to the following:
Dwight D. Eisenhower Memorial Commission
Financial Crisis Inquiry Commission
Government Printing Office
Medicare Payment Advisory Commission
Ronald Reagan Centennial Commission
U.S. – China Economic and Security Review Commission
U.S. Commission on International Religious Freedom
U.S. Tax Court
Judicial Branch is entirely excluded.
Throwaway bicycling,
In the data I reported, it looks like both defense and non-defense are up. Where do you get your data?
Dan,
That’s another interesting angle. Anecdotally at least, I’ve heard the number of contractors is way up. It would be nice to include that in the tally somehow. I looked at the Booz Allen website and was amazed to see how many formerly federal jobs have been outsourced.
Rick Stryker and Dan I don’t know about other departments, but DoD certainly did see a spike in contractors, but that has started to fade. Within DoD there was a big surge in government hiring during the late 1960s, but in the 1980s and 1990s there were various hiring freezes. This created an unhealthy age distribution. For example, about 10 years ago the mean age for workers at Anniston Army Depot (http://www.anad.army.mil/aboutANAD.shtml) was 54. Comparable age statistics for Corpus Christi Army Depot (http://www.ccad.army.mil/whatwedo.html). In the 2000s a lot of workers hired in the 1960s started to retire. When RAND Corp. looked at this they called it a “bow wave” problem. To smooth things out a lot of agencies rehired recent retirees as part-time contractors. So those contractors were supposed to provide a kind of bridge. Also, a lot of the recent new hires were brought in as temporary (NTE 5 years) employees. With the wars winding down and with the sequester many of those workers were released in April.
Rick Stryker asked:
Throwaway bicycling,
In the data I reported, it looks like both defense and non-defense are up. Where do you get your data?
Funny you should ask…I got it from your post at 4:40 PM. Specifically, my number for FY2009 DOD+DHS+VA is the sum of the three employment figures you provided, namely 737+180+297 = 1214. Then, my FY2009 Other Fed. (technically, should have been “Other Executive Branch”; possibly the source of your confusion?) was Total Executive Branch minus DOD+DHS+VA, or 2094 – 1214 = 880.
And so forth; the numbers are your numbers, divided into these two categories. Do please note that, as I have now stated three times, I have added DOD, DHS and VA together into one entity that I think better captures defense/security spending and congressional priorities towards that category. I do not have time to belabor the point, but a lot of VA spending these days is essentially follow on from Defense, and a lot of DHS spending is pretty clearly related to security issues as well.
So overall, security spending appears to be up, and everything else appears to be down.
If your numbers are to be trusted.
It would be interesting to see numbers for FY2012 and FY2013 here, for obvious reasons, although FY2013 numbers should really be adjusted for furloughs and other distorting factors, since the distortions created are not uniform across agencies.
Concerning the role of contracting, I am sure there are better data out there than “I read it on the Internet”, but it can be pretty tough in some cases to get information on total non-FTE positions in some agencies without diving pretty deep into the data.
Hi Menzie,
As I mentioned, the OPM numbers I cited excluded the postal service, the fed, NAF, and the TVA. I checked some of the others on your list to see if they might change anything significantly. It doesn’t look like it. I picked what looked like the biggest numbers and looked up the employment changes. For each case, I’ll give the URL source and page number so you can easily verify.
Amtrak:
2009 19,500
2010 20,026
2011 20,156
http://www.amtrak.com/ccurl/677/158/2011-Amtrak-Annual-Report-Final.pdf page 9
http://www.amtrak.com/ccurl/357/542/AmtrakAnnualReportRevised_2009.pdf page 5
FDIC
2009 6557
2010 9029
2011 9269
Note that 2010 and 2011 were approved headcount so likely bigger than what actually happened. 2009 is actual end of year headcount.
http://www.fdic.gov/about/strategic/report/2011annualreport/AR11final.pdf page 6
http://www.fdic.gov/about/strategic/report/2010annualreport/AR10chairman.pdf page 6
Export Import Bank
2009 365
2010 371
2011 376
Note that actual headcount was not given but I inferred it from the annual report, since authorization per worker was reported.
http://www.exim.gov/about/library/reports/annualreports/2012/files/exim2012_ManagementDiscussionAnalysis.pdf page 49
Ginnie Mae
2009 61
2010 70
2011 85
http://www.ginniemae.gov/inside_gnma/company_overview/budget_performance/Annual_Reports/annual_report11.pdf page 18
I couldn’t find employment changes for PBGC, but they are not likely to big, given that total employees are about 900.
http://www.pbgc.gov/about/jobs.html
After this, they get even smaller. For example, wikipedia reports that the Federal Financing Bank has 17 employees:
http://en.wikipedia.org/wiki/Federal_Financing_Bank
By far, the largest increase is FDIC with +2712, followed by Amtrak at 656, GNMA at 23, and Export Import bank at 11. That’s a total adjustment of just 3402.
Based on this, I think the OPM numbers are pretty good, with an adjustment of under 5K necessary. Moreover, when you look at the size of these adjustments, I think it implies that federal employment minus the USPS is a somewhat overstated but fair approximation to what actually happened to federal employment since 2009.
Throwaway bicycling,
Thanks. I see what you did. Indeed, the increases seem to be concentrated in defense and security. That’s a good point. It’s instructive to get into the weeds of numbers. Many conservatives have been focused on the increase in federal employment, which I think is real. But I think it will come as a surprise to conservatives to see the categories that have been increasing.
It’s consistent with what I’ve heard anecdotally about the consultants: they are concentrated in cybersecurity and intelligence.
To Rick Stryker:
I think the most illuminating new numbers to see here would be for contractors. The history of federal contracting is an absolutely fascinating topic, at least for some of us, and would contain some pretty big surprises for people across a wide spectrum of political ideologies.
You may be right that conservatives would be surprised to find that ex-security, ex-postal federal employment is down, but I am not exactly sure why they would be too surprised since most of the agency budgets have been very close to flat, the RMS side of those budgets flatter or dipping, and even without COLA since FY2010, the GS step system tends to make your payroll increase over time (absent huge increases in retirements). Absent some stuff related to recategorizing some contractor positions as FTEs, you are not going to see big increases.
And FY13 is a whole different world.
Menzie,
You’re misrepresenting your data.
Your charts depict Federal ex. Census ex. Postal. That means DOD is in fact included in your figures. Either that, or you’ve mislabeled your data. Why you would have done that, however, escapes me. I’ll take a good faith stance and simply chalk it up to simple error.
Also, you’re misrepresenting basic principles of U.S. law and lawmaking. Mail fraud is a crime, put in the criminal title of the United States Code by Congress through its lawmaking process. Violations of that crime are prosecuted by the Justice Department. Determinations of case facts and guilt are made in federal district courts. Care to shed light on where exactly in that process the USPS comes into that enforcement process other than reporting violations to the FBI? When is the last time you had a probing discussion with a postal employee? (Disclosure: If I worked for USPS, I’d be a third-generation-family employee there.)
And really? A comparison between USPS and CDC? USPS doesn’t have enforcement authority. CDC can use force to quarantine people, and NPS can use force against persons molesting those owls you mentioned. You’re odd attempts at counterexample are becoming amusing. Thanks for the laugh.
I can send you a rough Excel graph showing you what I’m talking about, but I want a binding legal promise you won’t alter the image or the data.
Final point, Menzie: Don’t hatchet that Thoreau quote. Consistency is not the hobgoblin of small minds. The actual quote begins “A foolish consistency…” Consistently applying a standardized concept of what is and is not the relevant item of your focus is not foolish. Consistently not doing simple checks of source materials on things like famous quotes would be foolish.
J.D. I understand civilians in DoD are in the series I plotted. Like “duh”. I wrote that explicitly in my August 4 comment, and is pretty clear (albeit implicit) in my original post.
My point of these examples is that I took a standard set of series (and standards usually exist for a reason), while you have selected what seems to me — and to many other readers — pretty arbitrary. You send me your excel file with the documentation attached, and I if I post it will be unchanged (but will be accompanied by your full documentation of how you constructed your ideal series). I await with bated breath to see if USDA ERS gets pulled out, for instance (by the way, if USPS doesn’t have any enforcement activity at all, who are these folks?).
Next Window Please
Thank you, Menzie and Rick Stryker for the deft way you both turned a potentially fruitless partisan debate into a thoughtful analysis of the available data. I’m eager to read further discussion.
Rick, I would like to raise the hurdle for you a bit. Keep in mind that Menzie titled this post “Ever Expanding Government Employment.” To me, this means you will need to make the case not only that there was a small (say, faster than GDP) net increase from 2009-2011, but also that it was as you suggested “up significantly” as part of a meaningful trend. The arguments like those from J.D. imply a dangerous, obvious and overarching expansion of the Federal government.
I also encourage you to take into account this chart, which puts the expansion of government employment in the context of the broader labor market. If you want to see it on a longer time scale, here’s the same data since 1939. See if you can find the creeping big government liberalism in it.
http://research.stlouisfed.org/fredgraph.png?g=ljn
Regards, Tom
Good, good. My proding has made you do some digging. And you found the maybe the % of postal employees who do have 0.6% of postal employees that can arguably be deemed law enforcement or regulatory governing officials.
*slow clap*
I think Rick’s methodolgy (i.e., what’s the most major source of the employee’s funding: tax dollars or service fees) is superior to mine, but you want data, so here you go (Although, I do recall I’ve given you most of this formula already):
BLS Series CES9091100001
Less: Transitory Census (unless you really want to include them): http://www.bls.gov/ces/cescensusworkers.pdf
Times 100,000
Divided by BEA Table 2.6, line 40.
The end result is federal govt employees per 100K U.S. residents.
That’s my back-of the envelope calculation, and by that calculation, fed. govt. employment markedly increased during Obama’s first two years in office, and only started to fall around March 2011, after the GOP recaptured the House. It’s only about now, 5 years into his administration, that fed govt employment is returning to where it was when he commenced his first term.
J.D.: We’ve already determined that per capita Federal employment ex.-Postal is higher than what it was at 2009M01 (implied by Figure 2, since we know population trends upward slowly). The point you made was that you wanted a measure of Federal employees with coercive, regulatory and enforcement powers. I’m still waiting for a consistent tabulation along those lines, with documentation for how judgments are made (now that we agree that part of USPS employment should be included in your measure).
By the way, people still do the *slow clap*? I thought that was only a cliché from movies a decade and a half ago.
Menzie and Tom in Wisconsin,
To answer this question more definitively, I built up the federal employment data by agency using fedscope at the OPM. I started in Sept 2008 and went through March 2013. Sept 2008 is the closest data available in the data to the start of the Obama administration. I also removed the agencies that Menzie listed. Here are the results for total federal employment:
Sept 2008: 1,932,043
Sept 2009: 2,029,893
Sept 2010: 2,103,117
Sept 2011: 2,119,948
Sept 2012: 2,100,300
March 2013:2,080,827
As you can see, total federal employment is 148,784 higher in March 2013 than it was in Sept 2008. Also, federal employment plateaued in 2011 and then moved down modestly, 19K by Sept 2012 and another 19K by March 2013.
I think this demonstrates that federal employment definitely climbed until 2011 and then has edged down a little bit. Again, it resembles the picture from total federal employment minus the USPS. Tom, to answer your question, this isn’t ever expanding federal employment, since employment stopped climbing in 2011. I do think the increase is significant in context: we had the largest GDP drop since the Great Depression with the unemployment rate rising rapidly at the same time federal employment was increasing.
Below, I list the agencies included in these numbers:
AF-DEPARTMENT OF THE AIR FORCE
AG-DEPARTMENT OF AGRICULTURE
AR-DEPARTMENT OF THE ARMY
CM-DEPARTMENT OF COMMERCE
DD-DEPARTMENT OF DEFENSE
DJ-DEPARTMENT OF JUSTICE
DL-DEPARTMENT OF LABOR
DN-DEPARTMENT OF ENERGY
ED-DEPARTMENT OF EDUCATION
HE-DEPARTMENT OF HEALTH AND HUMAN SERVICES
HS-DEPARTMENT OF HOMELAND SECURITY
HU-DEPARTMENT OF HOUSING AND URBAN DEVELOPMENT
IN-DEPARTMENT OF THE INTERIOR
NV-DEPARTMENT OF THE NAVY
ST-DEPARTMENT OF STATE
TD-DEPARTMENT OF TRANSPORTATION
TR-DEPARTMENT OF THE TREASURY
VA-DEPARTMENT OF VETERANS AFFAIRS
AM-U.S. AGENCY FOR INTERNATIONAL DEVELOPMENT
CU-NATIONAL CREDIT UNION ADMINISTRATION
EE-EQUAL EMPLOYMENT OPPORTUNITY COMMISSION
EP-ENVIRONMENTAL PROTECTION AGENCY
FC-FEDERAL COMMUNICATIONS COMMISSION
FQ-COURT SERVICES AND OFFENDER SUPERVISION AGENCY FOR THE DISTRICT OF COLUMBIA
FR-FEDERAL RESERVE SYSTEM
FT-FEDERAL TRADE COMMISSION
GS-GENERAL SERVICES ADMINISTRATION
IB-BROADCASTING BOARD OF GOVERNORS
LP-GOVERNMENT PRINTING OFFICE
NF-NATIONAL SCIENCE FOUNDATION
NL-NATIONAL LABOR RELATIONS BOARD
NN-NATIONAL AERONAUTICS AND SPACE ADMINISTRATION
NQ-NATIONAL ARCHIVES AND RECORDS ADMINISTRATION
NU-NUCLEAR REGULATORY COMMISSION
OM-OFFICE OF PERSONNEL MANAGEMENT
SB-SMALL BUSINESS ADMINISTRATION
SE-SECURITIES AND EXCHANGE COMMISSION
SM-SMITHSONIAN INSTITUTION
SZ-SOCIAL SECURITY ADMINISTRATION
AH-NATIONAL FOUNDATION ON THE ARTS AND THE HUMANITIES
AU-FEDERAL LABOR RELATIONS AUTHORITY
BD-MERIT SYSTEMS PROTECTION BOARD
BF-DEFENSE NUCLEAR FACILITIES SAFETY BOARD
BO-OFFICE OF MANAGEMENT AND BUDGET
CT-COMMODITY FUTURES TRADING COMMISSION
EC-OFFICE OF ADMINISTRATION
FL-FARM CREDIT ADMINISTRATION
FM-FEDERAL MEDIATION AND CONCILIATION SERVICE
FW-OFFICE OF SPECIAL COUNSEL
GW-INTERNATIONAL BOUNDARY AND WATER COMMISSION: UNITED STATES AND MEXICO
HD-U.S. HOLOCAUST MEMORIAL MUSEUM
HF-FEDERAL HOUSING FINANCE AGENCY
KS-CORPORATION FOR NATIONAL AND COMMUNITY SERVICE
LF-FEDERAL ELECTION COMMISSION
LT-U.S. TAX COURT
MC-FEDERAL MARITIME COMMISSION
MI-MILLENNIUM CHALLENGE CORPORATION
PU-PEACE CORPS
RF-FEDERAL RETIREMENT THRIFT INVESTMENT BOARD
RH-ARMED FORCES RETIREMENT HOME
RR-RAILROAD RETIREMENT BOARD
SK-CONSUMER PRODUCT SAFETY COMMISSION
SS-SELECTIVE SERVICE SYSTEM
TB-NATIONAL TRANSPORTATION SAFETY BOARD
TC-U.S. INTERNATIONAL TRADE COMMISSION
TN-OFFICE OF THE U.S. TRADE REPRESENTATIVE
AA-ADMINISTRATIVE CONFERENCE OF THE UNITED STATES
AB-AMERICAN BATTLE MONUMENTS COMMISSION
AN-AFRICAN DEVELOPMENT FOUNDATION
AP-APPALACHIAN REGIONAL COMMISSION
AW-ARCTIC RESEARCH COMMISSION
BK-JAMES MADISON MEMORIAL FELLOWSHIP FOUNDATION
BT-ARCHITECTURAL AND TRANSPORTATION BARRIERS COMPLIANCE BOARD
BW-NUCLEAR WASTE TECHNICAL REVIEW BOARD
BZ-CHRISTOPHER COLUMBUS FELLOWSHIP FOUNDATION
CC-COMMISSION ON CIVIL RIGHTS
CE-COUNCIL OF ECONOMIC ADVISERS
CF-COMMISSION OF FINE ARTS
CX-NATIONAL COMMISSION ON LIBRARIES AND INFORMATION SCIENCE
DB-PUBLIC INTEREST DECLASSIFICATION BOARD
DF-OFFICE OF THE FEDERAL COORDINATOR FOR ALASKA NATURAL GAS TRANSPORTATION PRO
DG-NORTHERN BORDER REGIONAL COMMISSION
DQ-DENALI COMMISSION
EO-MORRIS K. UDALL AND STEWART L. UDALL FOUNDATION
EQ-COUNCIL ON ENVIRONMENTAL QUALITY/OFFICE OF ENVIRONMENTAL QUALITY
EW-TRADE AND DEVELOPMENT AGENCY
FI-FEDERAL FINANCIAL INSTITUTIONS EXAMINATION COUNCIL
FJ-CHEMICAL SAFETY AND HAZARD INVESTIGATION BOARD
FK-FARM CREDIT SYSTEM INSURANCE CORPORATION
GE-BARRY GOLDWATER SCHOLARSHIP AND EXCELLENCE IN EDUCATION FOUNDATION
GG-OFFICE OF GOVERNMENT ETHICS
GO-VIETNAM EDUCATION FOUNDATION
GQ-ELECTION ASSISTANCE COMMISSION
GX-INTERNATIONAL BOUNDARY COMMISSION: UNITED STATES AND CANADA
GY-INTERNATIONAL JOINT COMMISSION: UNITED STATES AND CANADA
HB-COMMITTEE FOR PURCHASE FROM PEOPLE WHO ARE BLIND OR SEVERELY DISABLED
HP-ADVISORY COUNCIL ON HISTORIC PRESERVATION
HT-HARRY S. TRUMAN SCHOLARSHIP FOUNDATION
HW-U.S. INTERAGENCY COUNCIL ON HOMELESSNESS
IF-INTER-AMERICAN FOUNDATION
IG-COUNCIL OF THE INSPECTORS GENERAL ON INTEGRITY AND EFFICIENCY
MA-MARINE MAMMAL COMMISSION
NK-NATIONAL COUNCIL ON DISABILITY
NM-NATIONAL MEDIATION BOARD
NP-NATIONAL CAPITAL PLANNING COMMISSION
NS-NATIONAL SECURITY COUNCIL
OS-OCCUPATIONAL SAFETY AND HEALTH REVIEW COMMISSION
QQ-OFFICE OF NATIONAL DRUG CONTROL POLICY
RE-OFFICE OF NAVAJO AND HOPI INDIAN RELOCATION
RO-MEDICAID AND CHIP PAYMENT AND ACCESS COMMISSION
RS-FEDERAL MINE SAFETY AND HEALTH REVIEW COMMISSION
RZ-RECOVERY ACT ACCOUNTABILITY & TRANSPARENCY BOARD
TS-OFFICE OF SCIENCE AND TECHNOLOGY POLICY
UJ-JAPAN-UNITED STATES FRIENDSHIP COMMISSION
UT-UTAH RECLAMATION MITIGATION AND CONSERVATION COMMISSION
VD-PRIVACY AND CIVIL LIBERTIES OVERSIGHT BOARD
ZL-MEDICARE PAYMENT ADVISORY COMMISSION
ZP-U.S. COMMISSION ON INTERNATIONAL RELIGIOUS FREEDOM
ZS-UNITED STATES-CHINA ECONOMIC AND SECURITY REVIEW COMMISSION
ZU-DWIGHT D. EISENHOWER MEMORIAL COMMISSION
Rick Stryker: Good – I am glad we are all agreed Federal employment defined in the standard manner or in the way preferred by you (or even J.D.) is declining — which is the point of the title of the post.
Menzie,
My results confirm what the Heritage Foundation originally claimed. If you are now in agreement with the Heritage Foundation, then I suggest you post and let everyone know.
Rick Stryker: I await your emailing me of the spreadsheet, along with documentation (links to sources), per my request so I can assess. I will post the plot, along with my assessment.
By the way, you do recall that Heritage’s argument for excluding USPS was that it was dispersed, not that it was separate from the rest of government by virtue of not relying on the appropriations. Further, if the Federal government were to bail out the USPS, would we then need to redefine employment (again), to then include USPS? It’s looking like that is going to be likely sometime in the near future (recall $15 billion line of credit used, plus $11 billion in arrears). I think the answer is yes.
Menzie,
Not true on Heritage’s reason for excluding the USPS. You left out the key part. From their footnote,
“We exclude Postal Service employment because it is more similar to state and local employment in dispersion and is funded through postal revenues rather than taxes.”
A future bailout is not relevant to the question to what happened to federal employment in the past.
Rick Stryker: So in your argument, USPS employment had absolutely, positively, no relationship at all, in any conceivable state of the world, to expectations regarding what future measures the Federal government would take regarding the USPS debt and arrears. Just want to get that down on (virtual) paper.
Menzie,
I emailed you the employment data.
No, I don’t see why expectations of a future bailout could possibly be relevant. We just want to know what happened to federal employment–were more federal workers hired or fewer? It’s a simple question. And we need to exclude any agency that is self-financing.
It is time to ask if the topic of the post and comments is meaningful, other than to prove or disprove a claim by one party or another.
We all know that the Federal government uses funds in many ways, to provide income and services to U.S. residents in general and to provide wages and benefits to direct employees.
Looking at spending versus cash transfers, the spending can affect employment in all sectors. Purchases of goods/services to support the Fed gov’s operations and missions affect private employment, Fed employment, and state and local gov employment. A given mission and a given budget can be accomplished with many Fed employees or with relatively few Fed employees administering the work done by many non-Fed employees.
Is it inherently more/less desirable to have a person doing a job as a contract employee than as a Fed gov employee? Is it inherently more/less desirable to have research performed by state employees (at public universities), non-profit employees (at private universities), or private employees (at corporations)? Is it inherently more/less desirable to have veterans cared for by Fed gov employees at VA hospitals versus local gov employees at county and city hospitals, state employees at public university hospitals, private employees at non-profit hospitals, or private employees at for-profit hospitals?
If the effectiveness of the employment dollars at serving the government’s mission is not a function of the type of organization doing the work, why are you counting heads in just one type of organization?
The numbers can’t tell you if it is a positive or negative that Federal employment has gone up/down (depending on who defines Fed employment) since Obama took office. The numbers can’t tell you if it is a positive or negative that Fed employment has been dropping for the last 2.5 years.
Counting Fed heads is a diversion from the real topic looming overhead: what functions do we want the Fed government to serve/fund within the constraints of the amount of spending we will tolerate? That’s a tough question to answer, even for many who have an ideological stance favoring expansion or contraction of the Fed government’s mission (for an example, see the U.S. House, where avid fans of smaller government have found it difficult to agree on any substantial cuts in government spending that isn’t going to the poor and unemployed).
Because I favor a top-down view starting with the government mission rather than the down-in-the-weeds Fed employment numbers, I don’t understand the segregation of self-financing agencies. They serve a government mission, and they use government money to do so, even if the dollars don’t come from taxes or Treasury borrowing and aren’t part of the usual budget authorization and appropriation in Congress. Consider who would control the assets if one of the self-financing agencies ceased operation, or who would control the cash if, say, TVA were privatized.
I do not like the current President or his policies.
However, there are many statistics which those on the libertarian/ conservative right would applaud if a republican were President.
What is more baffling to me is why it is that Obama himself does not highlight these statistics. It is as if he does not consider them as important as many other things he chooses to emphasize.
Once more, Firesign Theater’s 1970’s comedy album, “Everything You Know is Wrong”, seems apt.
Rick Stryker: I have posted your series, plus my interpretation, as an update.
Menzie,
Thanks very much for posting the data. I agree that the adjusted series per capita is lower now than at the start of the Q1 09. However, there are alternative ways to judge the size of the federal employment increase. For example, the summary executive branch data at
http://www.opm.gov/policy-data-oversight/data-analysis-documentation/federal-employment-reports/historical-tables/executive-branch-civilian-employment-since-1940/
contains executive branch federal employee data by year that is essentially adjusted for self-financing government agencies. The data needs to be adjusted for 6 more agencies as I did above, but we know from the adjustments that they are small, on the order less than 10K. Thus, I’ll just use the series without any additional adjustments for a back of the envelope calculation.
If we compute the change in federal executive employment for the entire 8 years of the Bush Administration, we find an increase of 182K. And if we calculate the increase during the first 3 years of the Obama Administration, we get 186K. That increase during the years from 2009 to 2011 occurred with a very large drop in GDP and a substantial rise in the unemployment rate. From this point of view, it appears to be a substantial increase in federal executive branch employment.
This is more of a political point of course. I agree with you that if we are interested in the effects of the stimulus, the (federal – census) per capital is the relevant series.