Each time I post something on the environment, a number of readers admonish me to get back to economics. Well, it’s been obvious to many observers that the two are interlinked. Consider one graph from NOAA, and two others from Economic Benefits of Increasing Electric Grid Resilience to Weather Outages, a joint CEA and DOE report, released on Tuesday.
First, documentation of rising global temperatures, particularly on land.
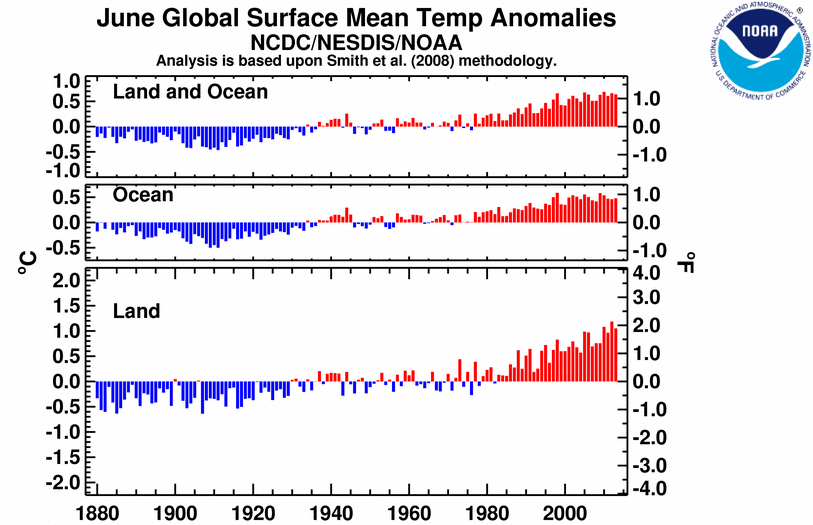
Figure 1: Source: NOAA.
Second, the weather related impacts on the US power grid.
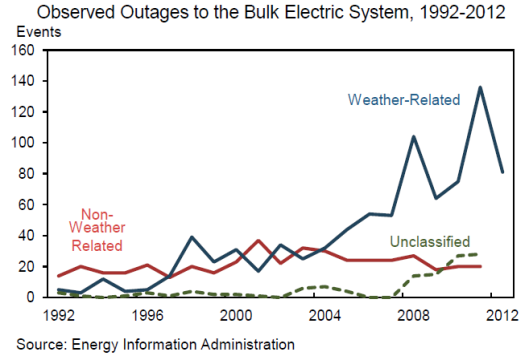
Figure from Economic Benefits of Increasing Electric Grid Resilience to Weather Outages (August 2013).
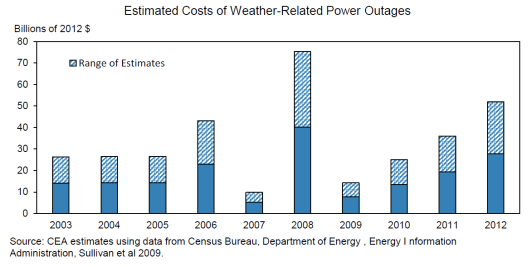
Figure from Economic Benefits of Increasing Electric Grid Resilience to Weather Outages (August 2013).
Here is one argument against human activity as a source of global climate change. A National Research Council/National Academy of Sciences perspective is discussed in this post.
Update, 8/16, 3:45PM Pacific: Reader Bruce Hall characterizes imminent temperatures in technical terms as “Whoop-dee-do!” I should have included in the post a depiction of the distribution of temperatures (so, including first and second moments), as I did in this post. To remind readers, here is again Figure 1-1, the evolution of the distribution of the Northern Hemisphere land Temperature Anomaly for Jun-Aug.
Source: NRC.
Note the support of the distribution is moving to the right and widening. It’s not just the mean temperature that is rising; variability is too.
I will further note that to me, this issue is not merely abstract; in 2001 in the G.W. Bush CEA, I was tasked to assess the macroeconomic impact of rolling blackouts in California (then my home state). In that case, weather was not the primary factor — rather it was the actions of Enron et al. [1] But the principle remains — the grid is important to economic activity.
Update, 8/17, 1:45PM Pacific: Since Econbrowser has a large audience of people interested in economics, I thought it useful to post estimates of the human-activity-related component of global climate change (on average, warming), from a well-known econometrician. From Kaufmann, Kauppi, and Stock, “Emissions, Concentrations, and Temperature: A Time Series Analysis,” Climatic Change (2006):
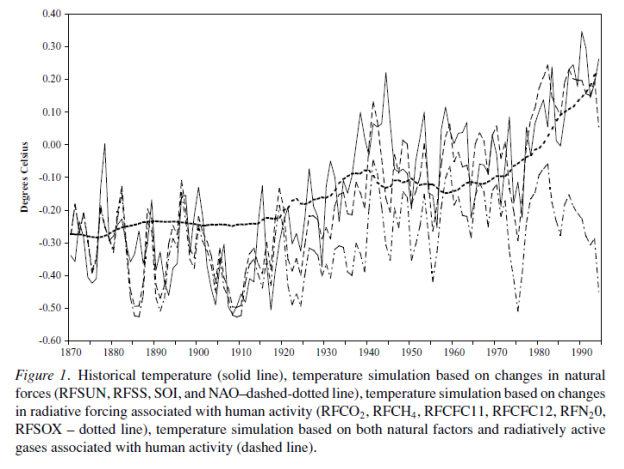
Figure from Kaufmann, Kauppi, and Stock, “Emissions, Concentrations, and Temperature: A Time Series Analysis,” Climatic Change (2006).
The graph can be read as follows: Solid gray line is actual, gray dot-dash-dot line (the one plunging) is the component of temperatures due to natural factors, gray dash line is fitted values, and the black dotted line is the component due to human activity. The predicted values are generated from a fairly simple four equation simultaneous equations model, so economists can understand the approach.
For those who might not be aware, James Stock is well known econometrician, who has contributed to the unit root testing, cointegration and macroeconometrics literature. (He’s ranked 32 at IDEAS, if you were doubting his credentials.)
I don’t think anyone can argue with increasing the capacity and reliability of the power grid. That would be a far better use of taxpayer dollars compared to propping up failing green energy companies owned by Obama cronies.
I read the report until I got to this paragraph – Scientific research predicts more severe hurricanes, winter storms, heat waves, floods and other extreme weather events being among the changes in climate induced by anthropogenic emissions of greenhouse gasses.I have argued that IAMs (climate models) are of little or no value for evaluating alternative climate change
policies and estimating the SCC(social cost of carbon). On the contrary, an IAM-based analysis suggests a level of knowledge and precision that is nonexistent, and allows the modeler to obtain almost any desired result because key inputs can be chosen arbitrarily.
I noted on another site mentioning climate analysis by the University of Michigan that the entire “global warming” since 1880… a very cold period by the way… is equivalent to the climate difference between the University of Michigan in Ann Arbor and the University of Michigan in Flint.
Whoop-dee-do!
It’s about the same thinking as declaring how the Obama administration has been so successful at getting the U.S. economy on track… by starting the analysis in with January 2009 data and declaring tremendous growth.
The charts and statistics are not exactly lying, they are simply obfuscating the truth.
The win win solution is to take money away from “green energy” rent seeking boondoggles and then use that money to harden the electric grid against weather and Carrington events.
Bruce Hall declaring how the Obama administration has been so successful at getting the U.S. economy on track
This is a straw man. No one is arguing that the economy is on track. Why else do you think some of us keep hammering on the number of long-term unemployed and the continuing need for fiscal stimulus in light of expected “tapering” and the ZLB? The Administration should be given credit for stopping the bleeding and avoiding a 1930s style depression, but that’s about it. Given the history of financial recessions, this recovery is perhaps a little better than what we had a right to expect, but not a whole lot better.
…is equivalent to the climate difference between the University of Michigan in Ann Arbor and the University of Michigan in Flint.
The two towns are 54 miles apart. Since the 1970s climate change has caused mid-latitude climate to advance north about 3 miles per year. So the correct starting point would be 1995, not 1880. Seed and plant catalogs recognize this. Find an old copy of a seed catalog from the 1970s or 1980s and compare where zones 4 and 5 were back then to where they are today. And the next time you’re at the grocery store check out the “Made in Canada” label on the maple syrup bottles. A lot of syrup production has advanced north from Vermont to Canada because the Sugar Maple tree line has advanced north. Apparently Mother Nature has already made up her mind on the global warming debate.
tj If you want to argue that it’s better for the government to invest in pure research and prize offerings rather than investing in specific industries and particular solutions, then fine. That’s a reasonable argument with a lot to recommend it. But you’ve really got your facts wrong regarding Solyndra. First, the Solyndra loan was arranged by the Bush Administration. It was something that the Obama Administration inherited. The loan request was initiated in Dec 2006 and in Jan 2009, just a few days before Obama was inaugurated, the Bush Administration tried to grant Solyndra conditional loan approval. The conditional loan was approved a few weeks later…before Obama’s DoE team was in place. Second, the reason the project failed is a good news story. Solyndra didn’t go belly-up because of outrageous executive salaries and corruption (or at least no more outrageous executive salaries than most companies), but because rapid technological advances and competition made Solyndra’s solution uncompetitive. Third, while it is true that some of Solyndra’s executives were Obama supporters, it’s also true that Solyndra’s largest financial backer, the Walton family (a.k.a., Madrone Capital Partners), were Bush and McCain supporters. Lastly, while most of the DoE loan to Solyndra was lost, overall the DoE has a pretty good track record of picking winners. Much better than Bain Capital. Only 1.3% of DoE’s loan portfolio has gone bad.
Regarding Pindyck’s paper. You should have read the paper instead of the abstract, because you are completely misrepresenting Pindyck’s actual argument. To quote from Pindyck:
“My criticism of IAMs should not be taken to imply that because we know so little, nothing should be done about climate change right now, and instead we should wait until we learn more. Quite the contrary. One can think of a GHG abatement policy as a form of insurance: society would be paying for a guarantee that a low-probability catastrophe will not occur (or is less likely).”
Pindyck’s view has moved a lot closer to Weitzman’s position, which is that we should worry about tail probabilities in a world of uncertainty of the mean estimates (as opposed to variability around the mean). Again, to quote from the Pindyck paper:
“Perhaps the best we can do is come up with rough, subjective estimates of the probability of a climate change sufficiently large to have a catastrophic impact, and then some distribution for the size of that impact (in terms, say, of a reduction in GDP or the effective capital stock).
The problem is analogous to assessing the world’s greatest catastrophic risk during the
Cold War — the possibility of a U.S.-Soviet thermonuclear exchange. How likely was such
an event? There were no data or models that could yield reliable estimates, so analyses had to be based on the plausible, i.e., on events that could reasonably be expected to play out, even with low probability. Assessing the range of potential impacts of a thermonuclear exchange had to be done in much the same way. Such analyses were useful because they helped evaluate the potential benefits of arms control agreements.”
In other words, Pindyck is calling for a war against warming in the same way that we fought a cold war against the Soviet threat. Got it now?
“Each time I post something on the environment, a number of readers admonish me to get back to economics.” this is merely an expression of a full lack of understanding the integrated nature of economics and the environment. This is becoming increasingly apparent in a variety of circumstances – there is no economy without a functioning environment. Simply put – they are dependent upon each other in a variety of ways.
There have been claims of a consensus on climate change for decades. Finally, there is actual andlysis by Lianne M. Lefsrud of the University of Alberta, Canada and Renate E. Meyer Vienna University of Economics and Business, Austria and Copenhagen Business School, Denmark
The consensus is in – 64% do not believe that climate change will havesignificant impact on their lives while only 36% believe that it will.
Excerpt:
Comply with Kyoto – The largest group of APEGA respondents (36%) draws on a frame that we label ‘comply with Kyoto’. In their diagnostic framing, they express the strong belief that climate change is happening, that it is not a normal cycle of nature, and humans are the main or central cause.
Nature is overwhelming – The second largest group (24%) express a ‘nature is overwhelming’ frame. In their diagnostic framing, they believe that changes to the climate are natural, normal cycles of the Earth.
Economic responsibility – Ten percent of respondents draw on an ‘economic responsibility’ frame. They diagnose climate change as being natural or human caused. More than any other group, they underscore that the ‘real’ cause of climate change is unknown as nature is forever changing and uncontrollable.
Fatalists – Fatalists’, a surprisingly large group (17%), diagnose climate change as both human and naturally caused. ‘Fatalists’ consider climate change to be a smaller public risk with little impact on their personal life.
Regulation activists – The last group (5%) expresses a frame we call ‘regulation activists’. This frame has the smallest number of adherents, expresses the most paradoxical framing, and yet is more agentic than ‘comply with Kyoto’. Advocates of this frame diagnose climate change as being both human and naturally caused, posing a moderate public risk, with only slight impact on their personal life.
Enviromental whackos live the good life.
I wonder how much of your “global warming” tax dollars went into those boxes of gourmet food?
Bruce – just a random question – why wouldn’t you start the analysis with January 2009 data? When would you want to start the analysis?
Bruce,
Hate to point this out to you, but the Obama Administration took office in January 2009. The Administration before it was from a different party.
If you are saying that they can’t take credit for what has occurred strictly starting with the calendar begin date of their Administration, then how are you logically able to state that they must bear responsibility for any economic changes at all since that time period? It is a wins I win, tails you lose argument that you are making.
When Ricardo tells us that: “The consensus is in – 64% do not believe that climate change will havesignificant impact on their lives while only 36% believe that it will.”
He neglects to inform us that the percentages come from a survey of members of the Association of Professional Engineers and Geoscientists of Alberta, a province dominated by the oil and gas exploration and extraction industry.
2slugs
Solyndra? I never mentioned it. There are plenty of others. Why do you think I care if Bush had anything to do with it? I’m no Bush defender.
Pindyck demonstrates that climate models are not to be used for guesstimating Social Carbon Costs. He has an opinion on risk management.
Can you see the logical inconsistency here? Think about it. The output of flawed climate models is not be trusted, yet the alarmist view that global warming is caused by man and is catastropic is based on the flawed models !
How far do the “ensemble” of models have to deviate from reality before the alarmists admit they need to throw them out and start over?
Ricardo
Are you serious? That paper is a survey of Alberta petroleum engineers? It is incredibly surprising that petroleum engineers don’t believe in climate change!
Cherry pick much?
Also, that is published in a Management journal. Not exactly a bastion of scientific documentation.
The immediate danger from climate change, not just to the economy but to civilization, is likely to be regional extremes that hurt agriculture. The problem with climate change is that, while the increase in mean heat is rather slow and appears to give us time to try to deal with it, the increase in extreme events is likely to hit us within a few decades (if increased rainfalls and droughts aren’t already the harbingers). Extreme in oscillations will come much sooner, because that is what tends to happen in all other complex systems under “external forcing” that we have observed. Whether it is more wildlife predators or more code lines in software, the effect is similar. It is always precisely unpredictable, but much more likely. Illustration here:
http://www.youtube.com/watch?v=SIvcQTXdjTg
tj Solyndra? I never mentioned it. There are plenty of others.
Well, actually there aren’t. The rest of the major DoE programs have been fairly successful.
As I said, you have completely misunderstood Pindyck’s paper. Let me help you out. Wherever you see Pindyck using the acronym IAM, substitute the words “Nordhaus’ DICE/RICE model.” And if you had bothered to read the paper, you would have known that most of the variables that Pindyck is talking about are the economic variables, not the climate model variables. In fact, I would argue that the “M” in “IAM” should really stand for “Mechanism” rather than “Model.” For example, how you set the discount rate has huge implications concerning welfare estimates of future generations. Pindyck takes it as a given that there is global warming. His concern is about the usefulness of the economic models that try to integrate the costs of global warming.
they need to throw them out and start over?
Again, you missed the point. What he’s arguing is that starting over is both pointless and is not an option because it is inherently impossible to accurately model the economic costs of global warming…at least on a macro scale. He might agree that the IAMs should be thrown out, but he is not saying we should suspend abatement measures until we get good IAMs because we will in fact never get good IAMs. Put another way, Pindyck is saying that we should forget about economic models entirely and just worry about risk management strategies. Pindyck is actually advocating higher carbon costs than what most IAMs would suggest.
Over the last few years Pindyck’s position on IAMs has evolved. Back in 2009 he had some problems with them, but still thought they might be useful. By 2010 he had moved to the position that IAMs focused too much on how climate change affects GDP levels rather than growth rates. Now he has more or less come around to something very close to Weitzman’s view, which is to worry about plausible catastrophes at the low probability tails. This is pretty much the standard view in risk analysis under radical uncertainty.
And Menzie’s observation about the costs of weather induced electrical outages is just another data point that should concentrate our minds on tail probabilities. Pindyck is talking about macro IAMs. There are plenty of economic models at the micro level that are reliable. For example, look at some of the work in agricultural economics. The response of commodity crops to heat is well understood.
2slug:
“Since the 1970s climate change has caused mid-latitude climate to advance north about 3 miles per year.”
The 1970s were another cyclical cold period. As I said, if you pick a low point in cyclical variation, you will always have an upward trend.
Seed catalogs aside, the 1° warming since a very cold period of the 1880s is about the difference between the climate of Ann Arbor and Flint. Just check average temperatures.
No one is arguing that warming hasn’t occurred from trough periods. That would be as nonsensical as arguing that human intervention is responsible for cyclical warming.
Bruce,
Re: Solyndra
I think it would have been important to tell the entire timeline if you desire to make it political and attempt to push the “fault” to Bush. As I understand it, the loan guarantee was approved in Feb 2009 but, a restructuring of the loan took place in 2011 contrary to the terms of the 2005(?) law which created the program. The investors’ claims to Solyndra’s assets, in the event of bankruptcy, ranked ahead of the government’s claims. Section 1702 (?) of the law states, “the [guaranteed] obligation shall be subject to the condition that the obligation is not subordinate to other financing.”…….http://www.politifact.com/truth-o-meter/statements/2011/nov/17/david-plouffe/solyndra-loan-george-w-bush-david-plouffe/
Menzie, just a reminder to take a close look at your own NOAA chart, and compare it to the other long range “official – (definition provided just for 2slugs)” data sets. http://woodfortrees.org/plot/gistemp/plot/hadcrut4gl/plot/rss There is a clear periodicity in the data. Moreover, the recorded data start from that pesky Little Ice Age period of cold temps. Even so we see folks obsessing over the very minor less than ~0.8C change in average temps. Alarmists are still present concerns which are based upon data start from a cold period — end at a warm period of the latest phase — pray that there is no shift back to a cold phase as we had in the 30 year period ending ~ 1979.
Bruce Hall has the difference in the correct context: “… is equivalent to the climate difference between the University of Michigan in Ann Arbor and the University of Michigan in Flint.” BTW, no one actually claims there is no human influence in the warming record. UHI and land use are the two major causes for human impacts.
I’ve said it before, and I’ll say it again.
A huge, multi-trillion dollar program to deal with Climate Change, backed enthusiastically by the GOP, will begin when the sea side villas, beach community high-rises, and oceanfront compounds of the ultra wealthy begin to be threatened by rising sea levels.
At that time we will get to hear radio talk shows shouting that the enormous sacrifices that must be made, especially those made by lower income groups and minorities, will not be in vain. The struggles of the .01%s to hold back the all-consuming and merciless tides will be featured prominently in infomercials from Americans for Prosperity, and ALEC will formulate aid bills to effectively transfer the costs to those who could never possibly get past the guardhouses and razor wire surrounding these places (unless they were wearing white uniforms).
Why pick a bible-thumper denier rather than a skeptical scientist? Denying global warming is a straw man as “most skeptics as well as most alarmists believe humans have caused some global warming. The issue of contention dividing alarmists and skeptics is whether humans are causing global warming of such negative severity as to constitute a crisis demanding concerted action.”
http://www.forbes.com/sites/jamestaylor/2013/05/30/global-warming-alarmists-caught-doctoring-97-percent-consensus-claims/
97% consensus is overwrought. Misclassified papers from physicists, astrophysicists, a “sea-level scientist”, etc. (not petroleum engineers), and all peer-reviewed.
http://www.populartechnology.net/2013/05/97-study-falsely-classifies-scientists.html
Lastly, you rightly delve into the assumption underlying complex macro models and the false precision that is sometimes claimed, yet you accept (vastly more complicated) climate models’ results uncritically. That seems strange.
For those of you who get caught up in the global warming debate on this economics blog, I’d refer you to this chart so that you can see both the magnitude and cyclical nature of global temperatures. [source cited on chart]
http://bobtisdale.files.wordpress.com/2013/07/figure-35.png?w=640&h=414
This is from a post here:
http://wattsupwiththat.com/2013/07/25/part-1-comments-on-the-ukmo-report-about-the-recent-pause-in-global-warming/
Once again, my reaction is whoop-dee-do.
“Climate change” will indeed have a significant effect on economic activity in the decades ahead, only put me down for the record as expecting mid-latitude cooling for at least the next 2-3 solar cycles (~22-33 years), not unlike the period of the 1790s-1820s, i.e., Dalton Minimum.
The convergence of the Gleissberg and Suess/de Vries cycles (interplanetary orbital effects on solar equatorial and geophysical forcing and the potential effects on the average number of sunspots and the Earth’s underwater volcanic activity, which in turn affects ocean temperatures) could coincide with a period of cooling that will exacerbate emerging resource constraints associated with population overshoot, Peak Oil, loss of arable land, deforestation, collapsing fisheries, and water shortages.
As Peter K. implies above, the ecological system is NOT a subset of “the economy”, as economists are trained to assume, but rather the converse, including the climate of the ecosphere.
http://sef.umd.edu/files/ScientificAmerican_Daly_05.pdf
http://steadystate.org/wp-content/uploads/Daly_SciAmerican_FullWorldEconomics%281%29.pdf
Compared to 100-200+ years ago, we now live in what Herman Daly describes as a “full world” inhabited by 7 billion people, which is 10 times more than when the Industrial Revolution began, and 7 times more since the onset of the Fossil Fuel Era, which is likely ending.
http://steadystate.org/wealth-illth-and-net-welfare/
http://www.theeuropean-magazine.com/356-daly/357-the-end-of-growth
Instead of productive and renewable physical and natural capital wealth, global mass-consumerism and the imperative of perpetual growth of population, resource consumption, and waste on a finite planet is creating increasing “illth” and its prohibitive cost to future growth or real GDP per capita and well-being.
http://exergy.se/ftp/exergetics.pdf
http://needsandlimits.org/
No legitimate “science” of economics would ignore, or externalize, the thermodynamic/exergetic limits of the ecological capacity of the planet to support the needs, viability, and sustainability of its living organisms. Without a deeper understanding of the ecosystem’s limits, we do not have a comprehensive accounting of the actual costs to the ecosystem of our needs and wants.
One of the self-limiting aspects of capitalism (or socialism, which relies on capitalism’s surplus) is that it has a blind spot regarding the mathematical fact that perpetual growth of resource extraction, investment, production, profits, and capital accumulation is impossible; therefore, by definition, capitalism’s perpetual growth per capita will end (is ending). Capitalist owners, managers, and politicians are conditioned that human wants are limitless and thus so must be the pursuit of resources, markets, profits, capital accumulation, etc. This is ecological and civilizational suicide.
Capitalism has become a caricature of its self-destructive nature, becoming a global system of resource extraction and turning the planet into a waste dump.
Just a reminder of what the reality is from Steve Goddard:
-Coldest summer on record at the North Pole
http://ocean.dmi.dk/arctic/meant80n.uk.php
–Record high August Antarctic ice extent
http://nsidc.org/data/seaice_index/images/daily_images/S_stddev_timeseries.png
–No major (category 3-5) hurricane strikes for eight years
http://www.aoml.noaa.gov/hrd/hurdat/All_U.S._Hurricanes.html
–Slowest tornado season on record
http://www.spc.noaa.gov/wcm/torngraph.png
–Second slowest fire season on record
http://www.nifc.gov/fireInfo/nfn.htm
–Highest August Arctic ice extent since 2006
http://ocean.dmi.dk/arctic/old_icecover.uk.php
–Four of the five snowiest northern hemisphere winters have occurred since 2008
http://climate.rutgers.edu/snowcover/images/nhland_season1.gif
-No global warming for 17 years
http://www.woodfortrees.org/plot/rss/from:1997/plot/rss/from:1997/trend
CoRev Your Only-America-Counts bias is showing. The NOAA numbers you cite only include hurricanes that hit US shores. Hurricanes don’t really care about political boundaries. You should be looking at hurricanes in the Atlantic basin. And guess what? Hurricane activity is trending up, although there are some clear cyclical responses within the trend. Whether the number of hurricanes increases or not as a result of global warming is unclear (some of the models predict fewer but more intense hurricanes). Warmer ocean waters produce two different effects that work in opposite ways. Warmer waters provide more energy, which increases hurricane activity and intensity. On the other hand, a warmer troposphere and more wind shear tend to weaken hurricane activity. Both are possible under global warming. One NOAA model predicts fewer but more intense hurricanes in the 21st century.
http://www.gfdl.noaa.gov/global-warming-and-hurricanes
-No global warming for 17 years
Please get yourself some real time series software, and then take a course in time series analysis. You might learn that there has been global warming over the last 17 years. Here’s one of the good commercial package that I use work all the time:
http://www.eviews.com/home.html
If the price is too much for you and you don’t want to bother with R programs, here are some very good free programs with excellent econometric credentials. They also have the Econometrica seal of approval.
http://gretl.sourceforge.net/
This one is very intuitive and easy to use.
Dave Giles http://davegiles.blogspot.com/ is a big fan of both EViews and GRETL.
I also recommend this free software:
http://www.jmulti.de/
If you’re new to time series analysis, then I also recommend buying the book that goes with JMulTi. The book uses datasets and examples that come loaded with the program.
2slugs,when the data fail to support the story line, change the story? Failing to remember all the claims re: Katrina and Super Storm Sandy, all US, now we must expand the area of concern? With that comment you failed to understand how badly wrong, as evidenced above, was the past few years’ claims for increased “Extreme Weather Events”.
BTW, why are you so worried about the short term trend being wrong. Most of us just accept that there is a hiatus in the warming. AGAIN! Even Kevin Trenberth has commented upon it several years ago: “http://stevengoddard.files.wordpress.com/2013/08/selection_006.png
2slugs
I’m glad you and Pindyck share the same opinion. I have no problem at all with preparing risk assessments of global warming. The problem is in treating man-made CO2 as a climate control knob. It simply will not work.
You cited some time-series results that show statistically significant global warming over the past 17 years. Your claim is hollow with nothing to back it up. Share your results, I’m sure Menzie will post a chart for you.
Notice above all the evidence that refutes the claim that variation in man-made CO2 emissions are driving climate change. Climate model predictions simply do not match reality on a consistent basis. Sure, they get some things right, but so does a coin flip.
Here’s a link to a Global Warming Hoax for Dummies video. Pretty entertaining.
http://www.youtube.com/watch?feature=player_detailpage&v=nq4Bc2WCsdE
The statistics on CC are plenty of suspictious. To believe that IS a consequence of human action is dubious.
But the worst is to think that it is posible to revert the effects.
Menzie, you are getting boring with your AGW hoax.
(CC is real of course, but sun does not care about mankind).
Pls. find something serious via
http://www.youtube.com/watch?v=vZ9myHhpS9s
Totally hilarious to visit a site on economics and reading the comments where pretty much everyone has zero scientific knowledge of climatology, yet, peremptorily declare that CC is a hoax.
Strange how those who are in charge of protecting this nation (the US military) truly believe in the devastating effects of MAN MADE (yes Johannes…I’m lookin at ya right now!) climate change.
But those who think they know and only use money to make believe they are capable of critical thinking come here and spew tired denialist talking points.
So, I ask you: Why do you hate America so much?
CoRev all US, now we must expand the area of concern?
What part of global warming do you not understand?
Regarding snow cover and arctic sea ice, here’s what NOAA says:
The Arctic continues to warm; sea ice extent reaches record low: The Arctic continued to warm at about twice the rate compared with the lower latitudes. Minimum Arctic sea ice extent in September and Northern Hemisphere snow cover extent in June reached new record lows.
http://www.noaanews.noaa.gov/stories201/20130806_stateoftheclimate.html
And NOAA tells us that 2012 was among the 10 warmest years on record, with June 2013 being the third highest June land temperature on record.
tj Let me remind you that you were the one who first cited the Pindyck paper, not me. After I pointed out how Pindyck was not saying what you initially thought he was saying, now you want to distance yourself from the paper. Is that how it works in your world?
You cited some time-series results that show statistically significant global warming over the past 17 years. Your claim is hollow with nothing to back it up. Share your results
Okay, that’s fair enough. Let’s use the NOAA data from July 1996 through June 2013; i.e., the last 17 years. Let’s do a quick ADF check. We can reject a unit root in levels with a constant or with a constant and a trend. We accept a unit root without a constant. Since you’re hypothesizing no trend, let’s start with a simple regression against a constant (i.e., the simple mean). This doesn’t look so good and flunks almost every test. So now let’s try one order of differencing and one MA lag (i.e., ARIMA(0,1,1)) and no drift term. This is just simple exponential smoothing. Not bad, but we might do better with the Box-Jenkins Airline model (i.e., ARIMA (0,1,1)(0,1,1) and no drift term) in order to account for seasonality. Hmmm…not as good. The AIC increases from -379.3 to -340.1 while the LogL falls from 191.6 to 178.0. While the exponential smoothing model does better than the Airline model without drift, one disturbing point is that the residuals from the exponential smoothing model rather decisively flunk the J-B normality test. So you might be right that a constant model fits the data well and there is no trend. So your claim about no warming is plausible. But let’s look a little deeper. Failing to account for seasonality in the data would probably strike most people as a serious problem with the simple ARIMA(0,1,1)model. Let’s recall that we were able to reject the unit root with either a constant or a trend and constant. Running a simple model with seasonal dummies, a simple linear time trend and two AR terms to eliminate any autocorrelation gives us a pretty good model. All of the seasonal dummies are highly significant. The two AR terms are also highlight significant, with the sum safely below 1.00. The time trend is positive and has a p-value of 0.0584, which is significant at the 0.10 level and on the cusp of significance at the 0.05 level. The AIC of -376.2 is slightly higher than the AIC in the ARIMA(0,1,1) model; but the LogL is quite a bit higher at 204.1. Furthermore, the residuals for the trend model are normally distributed.
Now there’s a lot of art to time series analysis, but I would argue that a trend model with seasonal dummies and two AR terms is a better model than the ARIMA(0,1,1) w/o a drift term and assumes no trend in the data. My side of the argument becomes even stronger when you backcast out of sample. You can torture the data to show that there is no warming trend over the last 17 years, but in order to do so you would have to convince people that seasonality in the temperature data is irrelevant and that we shouldn’t worry about residuals that are not normally distributed. And even the autocorrelation function statistics for the “no trend” model get a little worrisome. If I had to bet the farm one way or the other, I’d bet on the trend model.
2slugs says: “And NOAA tells us that 2012 was among the 10 warmest years on record, with June 2013 being the third highest June land temperature on record.” So let me explain a point I learned at the feet of a learned climate scholar: “What part of global warming do you not understand?” Dr Mark Serreze calls the Arctic is the “canary” http://www.bing.com/videos/search?q=+Arctic+is+canary+in+the+coal+mine&mid=4223F8E95243CD845F344223F8E95243CD845F34&view=detail&FORM=VIRE1. How do you interpret the Arctic temp data? http://ocean.dmi.dk/arctic/meant80n.uk.php
If the Arctic is the “canary” then this year it is for freezing.
Arctic sea ice extent still very low:
http://www.ijis.iarc.uaf.edu/en/home/seaice_extent.htm
http://www.accuweather.com/en/weather-blogs/climatechange/the-latest-on-this-years-arcti/15914658
Ditto for Arctic ice volume:
http://psc.apl.washington.edu/wordpress/wp-content/uploads/schweiger/ice_volume/BPIOMASIceVolumeAnomalyCurrentV2_CY.png
A minor decline in summer air temperatures (coldest in 7!!!!! years!!!11!) is wholly unremarkable. Furthermore, the annual charts going back many years show that the warming anomalies have been greatest in winter. Summer temps have held much closer to the multi-decade average.
Declines in ice volume, in contrast, represent large absorptions of thermal energy.
Declines in ice coverage increase the amount of solar radiation trapped within the atmosphere.
2slugs, care to discuss seasonality in a “Global Averaged” data set that is actually anomalies. Kinda a strange concept to be talking about seasons, eh?
1)CO2 concentrations are higher than anytime in human history. That is directly attributable to human activity. Whatever the likely path of climate events associated with that rise, a conservative worldview will recognize that uncontrolled, unprecedented and drastic experiments with the atmosphere of the human race’s only biosphere seem like an inadvisable risk.
2)There are good and sufficient non-climate reasons to take almost every action which would be prescribed by climate theory. De-forestation, loss of soil organic matter, and depletion of, harvesting of, and combustion of fossil fuels all have significant non-GHG downsides. Climate is neither irrelevant nor moot, but it is not an argument which could be dispositive for the deniers’ case against looking past the ends of their noses.
3)Instead of spending the earth’s patrimony like a drunken sailor, perhaps some prudent investment is warranted in offsetting the effect on their habitat of the uncoordinated activities of billions of stupid primates.
4)As a senior utility engineer, let me disagree a bit with the implication here that greater weather -related outages primarily reflect greating forcing effect by weather. While that is likely true to some degree, don’t confuse weather-related with ‘equipment in good condition that only failed due to extraordinary weather’ my gut says this is more about grid conditions (the average age of grid assets continues to increase, and state regulation of maintenance activities continues to decrease, and intervenor obstacles to grid additions and updates continue to increase). In either event, a prescription for ‘hardening’ of the grid is certainly appropriate in my view.
5) Effective and efficient state and community oversight needs to be restored (intentionally wrecking this competitive American advantage to allow increased rent seeking by corporate interests is one of the worst sins of the deregulation era). One of the best prescriptions for hardening the grid is reducing the load on existing assets so that existing redundancy is more adequate. I strongly support energy efficiency and demand response efforts. Another grid hardening activity is increasing the diversity of generation assets. As an example, remember the many gas plants in Texas that tripped off due to the effects of record cold weather, such that a large-scale blackout would have occurred absent wind generation? Of course, properly designed (as assured by regulators for the benefit of the entire grid and not the narrow interests of the plant owner) generation assets would not have tripped off, but these were merchant plants in Texas, and the economists INSIST that vertical integration of generation with wires companies is not a natural monopoly. Interestingly, Texas (ERCOT) currently has inadequate generation to provide sufficient physical redundancy to keep the lights on for foreseeable contingencies (the only major part of the U.S. Grid to share that distinction with various 3rd world countries). So far, the deregulationists have been lucky.
6)Don’t miss the part about ‘efficient’ regulation. Not just merchant generators and utility companies are taking advantage of weakened regulators. Others are also taking advantage of the lack of decisive and principled regulation. Exemplifying this is the recent decision in California to require the unprecedented undergrounding of 500KV transmission line where the only obstacle to overhead was NIMBY’ists objections to the already approved and completed rebuild of existing utility transmission towers in a 100 y.o. utility right-of-way. This transmission upgrade significantly strengthens the entire SoCal grid by diversifying which areas of generation or gen import can feed which areas of load, but delays and costs are and will be considerable. Another similar situation, for re-construction of existing subtransission lines, has languished partially constructed for 15 years due to the vehement objections of monied NIMBY’ists. Meanwhile, most of one SoCal county will be subjected to an outage of days if not weeks if a mudslide occurs in the right spot anywhere along many miles of 220kV transmission towers.
Menzie Chinn
May I recommend you examine the source temperature data and compare that to models.
See Anthony Watts presentation etc.
For details see:
New study shows half of the global warming in the USA is artificial with the draft and presentations.
Why are ALL the model projections based from 1979 systemically biased about 2 sigma higher than current reality, rather than being normally distributed about the temperature? See
Roy Spencer STILL Epic Fail: 73 Climate Models vs. Measurements, Running 5-Year Means
For the impact of extreme weather, see:
Wealth and Safety: The Amazing Decline in Deaths from Extreme Weather in an Era of Global Warming,
1900–2010 Indur M. Goklany
David L. Hagen: I commend you to this analysis (gated paper here), re: allegedly illusory temperature increases.
I took the time to read the report. Color me unimpressed. From a utility engineer standpoint, it reads like something a bright high-school student might write with access to a mish-mash of poorly understood sources. Although numerous good points are made, whoever had executive control of content clearly doesn’t actually know what he or she is talking about.
This does not change the fact that our power grid does need major reliability improvements.
Clearly 3B or so people probaly would rather have a higher current standard of living. An effective carbon tax would lead to increased starvation. Ain’t gonna happen globally. Should it happen in the U.S.? Why? Very small effect on global carbon output. Now, if you want to cut income taxes, eliminate the payroll tax, and put some $2 a gallon tax on gas, fine. That will increase growth in the US, but not affect global carbon.
Suppose the magical UN fairy could tax carbon globally. Then clearly the poor would suffer the most, but at least their descendants would not suffer from global warming…I guess that is the calculus.
Ottnott asserts: “Declines in ice coverage increase the amount of solar radiation trapped within the atmosphere.” Trapped within the atmosphere? Perhaps some small amount, but the real “trapping” occurs in the oceans.
This inclusion of the oceans’ heating then shows how the various ocean cycles impact heat transfer around the planet. These cycles are still not well understood, if even all are recognized. The Pacific Decadal Oscillation is still a relatively new found phenomenon.
These ocean phenomena are not covered well in most of the climate models. Accordingly, they do not project climate changes, especially temperature, well over longer periods. These periods are what we are being assured are problematic, due solely on analysis of these model outputs.
Menzie, I am assuming you are being sarcastic. If so, did you miss this in your referenced paper? ” According to these classifications, urbanization accounts for 14–21% of the rise in unadjusted minimum temperatures since 1895 and 6–9% since 1960.”
followed by this explanation: “The USHCN version 2 homogenization process effectively removes this urban signal such that it becomes insignificant during the last 50–80 years. In contrast, prior to 1930, only about half of the urban signal is removed. Accordingly, the National Aeronautics and Space Administration Goddard Institute for Space Studies urban-correction procedure has essentially no impact on USHCN version 2 trends since 1930, but effectively removes the residual urban-rural temperature trend differences for years before 1930 according to all four urban proxy classifications.” Why did they not add — we think because we did even another study based upon some of the same parameters of the “homogenization” process?
And that’s the science we are relying upon to determine that fractional rise in temperatures over the past 130+ years.
Why are you and 2slugs not skeptical about this time series analysis.
CoRev The surface of the globe is not homogeneous. The northern hemisphere has more land and less ocean than the southern hemisphere. So that’s the intuitive rationale. From a modeling perspective it’s a little hard to ignore t-statistics greater than 3.00.
2slugs, I see you ignored the comment re: seasonality. Why? Basic errors like this are replete in your understanding filtering into your egotistic and antagonistic comments.
Menzie and 2slugs here http://wattsupwiththat.com/2013/08/17/monthly-averages-anomalies-and-uncertainties/#comments is an interesting discussion of the statistics associated with calculating average temps. It is centered on the latest attempt, the BEST approach.
Read it and especially the comments. Together you might better understand how your support of the simple catastrophic projections is dangerously wrong. Gotta watch those tails!!??!!
CoRev Do you really not understand why they adjusted for urban head islands in the way that they did??? Hint: it has to do with the altitudes of the newer stations.
Menzie I’ve noticed that on both sides of the debate there is an expectation that because we experience one extreme weather event we should expect another extreme event next year. So, for example, CoRev thinks it’s important that because Hurricane Katrina hit hard in 2006 and there were no large hurricanes to hit the US in 2007, therefore global warming must be a hoax. But when I look at your 8/16 3:45PM update it strikes me that we should probably not expect that extreme events in one year would predict an extreme event in the next year. In other words, folks on both sides, but especially on the denial side, are confusing the spread in volatility with autocorrelation. When I look at your graphs the visual evidence suggests that the distribution is becoming more platykurtic, which is the opposite of what we would normally expect if volatility is becoming more clustered and autocorrelated. ARCH errors are generally associated with leptokurtic distributions. So what we should expect is volatility, but not necessarily volatility that is conditionally heteroskedastic. So CoRev‘s comment about no large hurricanes following Katrina is pointless. I might be misremembering things, but I seem to recall that long ago you wrote a paper on the coincidence of leptokurtic distributions and GARCH errors. Any off-the-cuff thoughts?
Here’s Richard Muller who led the Berkeley study that many had high hopes it would disprove climate warning/change. nytimes.com/2012/07/30/opinion/the-conversion-of-a-climate-skeptic.html
He’s proved to his satisfaction that warming is real and that humans are almost entirely the cause and that it will continue.
He also says the difficult part is agreeing across the political and diplomatic spectrum about what can and should be done.
If Richard Muller, great friend of Watts up with that, is convinced, so am I.
2slugbaits: I’ve never heard of ARCH/GARCH effects showing up in annual weather data. Daily/weekly data, yes, not annual. Hence, I would not expect clustering of extreme events at that frequency.
I have added at the end of the post a graph from paper by Kaufmann, Kauppi, and Stock (2006), which might persuade those who are suspicious of large scale multi-equation climate change models. (Of course, it will not convince anybody who naturally disbelieves econometrics).
2slugs, ARCH/GARCH, seasonality and now altitude? Kinda searching for a story, eh?
Care to revisit that seasonality issue with anomalies?
CoRev: I think 2slugbaits was saying there weren’t ARCH/GARCH effects in annual temperature data.
Menzie, I understood what he was trying to say. He is searching but still lost.
CoRev wrote:
“Ottnott asserts: “Declines in ice coverage increase the amount of solar radiation trapped within the atmosphere.” Trapped within the atmosphere? Perhaps some small amount, but the real “trapping” occurs in the oceans.”
I’m a former Mech Engr. The atmosphere is the boundary of the system of interest. Sorry for the lack of clarity.
Whether the additional energy initially shows up as warmer water, melting ice, or higher air temps will not matter over the longer term.
Your point that the ocean cycles are not well understood or completely recognized is not one that should be reassuring to anyone. Unless you have some reason to believe that the unknowns about the ocean cycles will provide a net cooling effect counter to any temperature forcing due to human activity, then the increased uncertainty increases the riskiness of climate change.
Your point that the the imperfect knowledge of ocean cycles, as encoded in climate models, means that they can’t project temperature changes well over longer periods is baseless for 2 reasons. First, you have no alternative model to demonstrate that better understanding and encoding of ocean cycles will significantly alter the temperature calculations. Second, it is over the longer term that the specific spatial distribution of excess heat retention decreases in importance.
Ottnott, let’s start with the definition of “trapped” in a time sense. None of the energy is actually trapped. Its release via radiation, convection and conduction is slowed, but not trapped. It is always released. Earth’s very efficient at maintaining temperature equilibrium within ~15C regardless of atmospheric makeup. http://www.geocraft.com/WVFossils/PageMill_Images/image277.gif
You also claim: “Whether the additional energy initially shows up as warmer water, melting ice, or higher air temps will not matter over the longer term.” With the above definition of trapped = delayed in mind, all your devices for delayed release is different in timing. Since we are measuring/calculating temperature change (over time) how the heat is stored and released is very important due to each media’s efficiency.
Since I am discussing efficiency then the water/oceans (in all of its states) is far more efficient since most of its heat transfer is via slower actions, conduction and convection, versus radiation which is nearly instantaneous.
To me the biggest failing in climate science is the concentration on GHG-based green house effect while ignoring the more efficient water-based effects. Even water vapor, the most prevalent GHG, is often treated as a constant. It is not, and the impacts of H2O are far more time expansive than GHGs. Remember change over time is what we are trying to determine.
So, your comments re: the ocean (cycles) is foolishly naive. They are the drivers of climate, and any change in understanding of them will effect the science. That science is embodied in the models, and they are failed today when compared to reality.
If you disbelieve the impacts of the oceans, look at the temp records and see the impacts of the various ocean effects, AMO, PDO el/la Nina/os, etc. and those are just the well known and recently defined properties.
CoRev:
Having revealed that I was a former Mech Engr, I thought you could have saved yourself the effort of making me aware of the existence of heat transfer.
And, I suppose you must play your little games, but there was nothing in what I wrote that indicated disbelief in “the impacts of the oceans”.
What I disbelieve, due to the absence of evidence, is that the unknowns about ocean cycles should give us any comfort about the risk of anthropogenic climate change.
And, I will further note that ocean cycles, like all the other natural cycles the denialists like to cite, will continue to coexist with anthropogenic warming.
Denialists like to seize upon whatever cycle (sunspots, etc.) is momentarily supportive of their argument that the measured warming is all or mostly a natural cycle. They then abandon that cycle when the climate scientists patiently explain: the models already incorporate the cycle; or, the cycle that the denialists credit with large impact on the climate in a certain period of time mysteriously shows no such impact in previous cycles; or, the models don’t incorporate the cycle, but the impacts can be estimated well and are minor; or, the cycle is relatively short and unrelated to long-term climate change; etc.
Denialists earn that name by failing to follow their criticisms up with real science (well, they did try with funds for the Berkeley Earth Surface Temperature project, but BEST ended up rejecting the denialist stance and confirming that warming was real and not an artifact of errors or of land use changes around temperature stations).
Ottnott, I see you have now shifted to name calling, Denialists. Since the comment was addressed to me, I take it as a personal description. So, enlighten me, other than disagreeing with your personal interpretation of climate science, just what am I in denial about?
OTH, I can decipher from your comments that you believe the science is sound, and well represented in the models. That the models well represent how H2O, in all its forms, impacts climate. I also interpret your comment re: heat transfer to indicate you believe that we could have temperatures change greater, perhaps runaway, than the ~15C range we see in the literature. I can further conclude that you do not believe in climate cycles.
Furthermore, I see that you have not refuted anything I said with anything other than opinion. When you say: “And, I will further note that ocean cycles, like all the other natural cycles the denialists like to cite, will continue to coexist with anthropogenic warming.” Please define a range for each of the coexistent natural/anthropogenic warming.
I have a real 4-year old to take care of at home.
His inability to use logic is real, not faked.
Bruce Hall, at August 15, 2013 08:15 PM wrote:
And I suppose this notion was done by you to suggest that, if the increase of the globally averaged temperature since 1880 has had about the same value as the difference between the climatological mean temperatures of two locations in Michigan, it can’t be a big deal.
If this was a valid line of argument, one consequentially should also say that a climate change from Last Glacial Maximum conditions 21,000 years ago, when large parts of the Northern Hemisphere were covered by kilometers-thick ice shields, to present day climate conditions is not such a big deal, either. After all, the difference in the global mean temperatures of the two climate regimes, glacial and inter-glacial, is not larger than the difference in the climatological mean temperatures between Ann Arbor, MI (about 10 deg C.), and Birmingham, AL (about 17 deg. C)
Bruce Hall, at August 16, 2013 12:11 PM wrote:
Here is a graphic of the globally averaged temperature at surface since 1880:
http://data.giss.nasa.gov/gistemp/graphs_v3/Fig.A2.gif
Looking at this graph, how can anyone claim with a clear conscience that the temperatures around 1970 were at a “cold” cyclic trough (what is “cold” supposed to mean in this context, anyway?), and the global temperature had merely shown a cyclic behavior since 1880?
Bruce Hall, at August 16, 2013 01:44 PM wrote:
Only, one has to read this graphic correctly. This graphic doesn’t show what you claim, the magnitude of the temperature. Instead, it shows how the 16-year surface temperature trends changed over time (I just assume Tisdale has treated the data correctly). The trends were positive between about 1910 and 1950, and since about 1980. Between 1950 and 1980, the trends fluctuated around 0. The overall trend since 1880 has been positive, though.
Yeah, well. It’s not a scientific reference. It’s just an opinion article from a “skeptic” opinion blog.
CoRev, at August 16, 2013 12:41 PM, wrote in support of Bruce Hall:
According to whom? According to your favorite AGW-“skeptic” in his/her opinion blog?
2slugs
Thanks for your analysis, it’s interesting. The earth has experienced a warming trend since emergin from the little ice age over 200 years ago. The fact that you can tease a small upward trend out of the NOAA dataset is not surprising.
I wasn’t distancing myself from Pindyck, just noting that there is a difference between demonstrating one result, then having an opinion on another. I put more weight on the demonstrated result.
It’s well-understood that “something has caused a trend change in temperature anomalies. For example, you, and the authors Menzie cited above (in a follow-up paper) attribute the lack of warming to sulfates/aerosols.
Note that the in the follow-up paper, the authors say “it has been unclear why global surface temperatures did not rise between 1998 and 2008.”
Judith Curry provides a nice critque of the paper and makes the point that it would be difficult for sulfates to explain the lack of warming from 1998 – 2008 because sulfates only show an increase from 2004 – 2007 in their data set. It appears they also use a regional sulfate data and extend it globally, even though the residence time of sulfates is to short to permit the use of a regional data set for a global analysis.
The point is that incomplete models with omitted variables and errors in variables render many results invalid. Yet we continue to use these flawed models and results to drive policy.
Judith Curry-
This paper points out that global coal consumption (primarily from China) has increased significantly, although the dataset referred to shows an increase only since 2004-2007 (the period 1985-2003 was pretty stable). The authors argue that the sulfates associated with this coal consumption have been sufficient to counter the greenhouse gas warming during the period 1998-2008, which is similar to the mechanism that has been invoked to explain the cooling during the period 1940-1970.
I don’t find this explanation to be convincing because the increase in sulfates occurs only since 2004 (the solar signal is too small to make much difference). Further, translating regional sulfate emission into global forcing isnt really appropriate, since atmospheric sulfate has too short of an atmospheric lifetime (owing to cloud and rain processes) to influence the global radiation balance.
The alternative explanation is natural internal variability associated with the ocean oscillations. Since 1999, the Pacific Decadal Oscillation has been shifting from the warm phase (warm phase since 1976) to the cool phase, and has been mostly in the cool phase since 2007. A cool PDO is associated with more frequent La Nina events, which are associated with globally cooler temperatures. The climate model studies cited by the authors do not do a convincing job of ruling out natural internal variability as an explanation, either for the cool period since 1998, and the earlier cool period during 1940-1970.
http://climateobserver.blogspot.com/2011/07/dr-judith-curry-explanation-for-lack-of.html
Ottnott, I am many (17+) times older than your 4YO. Your arguments are unsupported, and come across as those to a 4YO. Cause I say so is not support! G’day to you.
Jan P. Perlwitz says: “According to whom? According to your favorite AGW-“skeptic” in his/her opinion blog?” in my support of Bruce Hall’s comment re: current warming defined as the climatological difference between An Arbor and Flint, MI. But, Jan, a recent commenter made this succinct point re: the narrow range of actual inter-glacial temperatures: “After all, the difference in the global mean temperatures of the two climate regimes, glacial and inter-glacial, is not larger than the difference in the climatological mean temperatures between Ann Arbor, MI (about 10 deg C.), and Birmingham, AL (about 17 deg. C).” Important? Absolutely, since we exist very well in both those extreme regimes.
Jan, I think you thought you were making a cogent point, but in fact you just emphasized the extremity of the alarmist position(s). Amazing the terror induced by that fractional ~0.8C rise from the last major cold period.
BTW, while I am discussing predictions, let us not forget the one about to fall flat of an ice free Arctic in 2013.
For those who use sulfates to explain the drop in temperature, here is a recent study that indicates a decline in sulphur emissios since 2005.
While global sulfur dioxide emissions have generally declined since the mid 1970s, the upturn in emissions from 2000 to 2005 (Smith et al2011) raised the possibility that increasing aerosol forcing might be offsetting recent warming from increasing greenhouse gas concentrations. We find here that this increase was short lived.
image – http://ej.iop.org/images/1748-9326/8/1/014003/Full/erl441620f2_online.jpg
source – http://iopscience.iop.org/1748-9326/8/1/014003/article
Whe you add volcanic/natural emissions, the data indicates a decline from 2004/5 to the present, so it seems sulfates do not provide an explanation for the failure of the climate to warm as predicted over the last 15 – 20 years or so.
NASA GISS: Stratospheric Aerosol Optical Thickness
This is a function of both anthropegenic and natural forcings.
http://data.giss.nasa.gov/modelforce/strataer/
CoRev, at August 16, 2013 04:27 PM, copied some “Steven Goddard”:
Here, we have one of the AGW-“skeptic” talking points, which is just an illustrative example of the dishonesty or incompetence of “skeptics” like “Steven Goddard”.
Here are the trends in Kelvin per decade since 1995.75 (about 17 years), together with the intervals for the two standard deviations and the exceeded significance threshold probabilities, for the major temperature data sets of the surface and lower tropospheric temperature (http://www.skepticalscience.com/trend.php):
Trend+/-2 sigma Significance
GISTEMP: +0.104+/-0.115 larger 90%
NOAA: +0.084+/-0.109 larger 85%
HadCRUT4: +0.093+/-0.114 larger 85%
RSS: +0.034+/-0.191 not significant
UAH: +0.122+/-0.192 larger 75%
Land only data:
BEST: +0.189+/-0.234 larger 85%
NOAA: +0.209+/-0.174 larger 95%
Thus, all the data show a surface or tropospheric warming trend for the recent 17 years. The warming trends are all statistically significant of varying degree, depending on the data set, except the RSS data set, where the trend estimate deviates to the low side compared to the other data sets. Note, that “Goddard” and CoRev have chosen exactly this data set for the assertion of “no global warming”, ignoring all the other data. It’s called cherry-picking. Note also, that the UAH lower tropospheric data, provided by Spencer and Christy, have the largest trend estimates compared to the others, although the statistical significance is lower than for the surface data sets. This is because the temperature variability in the troposphere is larger than at the surface.
Then there is the statistical argument. Even if in none of the data sets any statistically significant trend was detected, which is not the case, as just shown, one could not validly draw the conclusion that there wasn’t any trend, as long as one couldn’t exclude the possibility that the non-detection of the trend was just due to an insufficient sampling of the data. For any time series, consisting of both trend and fluctuations, one always can find time periods for which the trend is not statistically significant, even if a trend is present, if one chooses the time period only short enough.
Additionally, global warming is not only the increase in the surface and tropospheric temperature. There are other indicators of continuing global warming, like the decrease in the polar ice caps, or the increase in the ocean heat content. No “hiatus” in the increase of the ocean heat content to be seen for the upper 2000 m (some slowing in the upper 700 m, though):
http://www.nodc.noaa.gov/OC5/3M_HEAT_CONTENT/
From a physics point of view, the increase in the ocean heat content is of more relevance for the reality of global warming than the surface/tropospheric temperature trend, since about 90% of the energy additionally available due to the perturbation in the radiation balance coming from greenhouse gases goes into the oceans. The oceans heat the atmosphere. The heat exchange is a non-linear process, though. It’s just a matter of time until the troposphere will catch up with the continuing ocean warming.
As for the other data shown by you, none of them are in contradiction to continuing global warming, even though you want to suggest otherwise.
CoRev, at August 19, 2013 11:25 AM, wrote:
Regarding the difference between glacial vs. interglacial climate regimes:
So, what are you saying? You agree with a statement according to which a climate change from present day conditions to conditions like during the last glacial, when the global mean temperature was 5 – 7 deg. C lower and large parts of the Northern Hemisphere were covered by kilometer-thick ice shields, wouldn’t constitute a large climate change, and it wouldn’t be big deal for human civilisation, since such a global temperature change wasn’t larger than the difference between the mean temperature of Ann Arbor, MI, and Birmingham, AL?
Who claims “terror” coming from an increase of 0.8 deg. C? You apparently are making things up. What is your intention with doing this?
So, someone made this prediction. Who did this and where (proof of source, please)? And this is relevant why?
You haven’t answered my question according to whom “UHI and land use are the two major causes for human impacts.”
tj, at August 19, 2013 10:28 AM, wrote:
The authors of the follow-up paper (Kaufmann et al., PNAS, 2011, doi:10.1073/pnas.1102467108) do not claim a “trend change”. However, since you obviously claim a “trend change”, what is the scientific evidence that there has indeed been an actual “trend change”, compared, let’s say, to the highly statistically significant warming trend since the mid 1970ies? An actual trend change would be something to be established applying some meaningful statistical metric.
Note, that this is good example for applied quote mining, as I am going to show further below.
You cite a critique of the paper by Judith Curry:
This “nice critique” by Judith Curry is actually a misrepresentation of what the paper really says. This becomes already clear when one takes the abstract of the paper:
Given the widely noted increase in the warming effects of rising greenhouse gas concentrations, it has been unclear why global surface temperatures did not rise between 1998 and 2008. We find that this hiatus in warming coincides with a period of little increase in the sum of anthropogenic and natural forcings. Declining solar insolation as part of a normal eleven-year cycle, and a cyclical change from an El Nino to a La Nina dominate our measure of anthropogenic effects because rapid growth in short-lived sulfur emissions partially offsets rising greenhouse gas concentrations. As such, we find that recent global temperature records are consistent with the existing understanding of the relationship among global surface temperature, internal variability, and radiative forcing, which includes anthropogenic factors with well known warming and cooling effects.
Differently to what Judith Curry claims, the conclusion of the paper is not the sulfates coming from Chinese coal consumption by themselves have been sufficient to counter the radiative forcing by the greenhouse gases. Instead, according to the authors, negative forcing from sulfur emission has been a factor in addition to declining solar insolation and El Nino/La Nina variability. All factors taken together can well explain the temperature variability between 1998 and 2008. The initial statement from the abstract as quote-mined by you was just the starting point of the paper, since the authors give an answer to the question. According to the authors, the “hiatus” is consistent with our understanding of the workings of the climate system.
tj, at August 19, 2013 11:32 AM, wrote:
Who uses sulfates to explain “the drop in temperature”? What drop in temperature?
David L. Hagen at August 17, 2013 07:44 PM, asked:
Note, those claims about “Epic Fail” of the models are not based on any scientific references. These are just assertions made in an article in an opinion blog, where scientific standards are not valid. There is no reason to believe anything of this at face value. I prefer to wait until the ones who have made these assertions in the blog posting present actual results in a peer-reviewed scientific study, where the assumption, the methodology and the data selection for the analysis are properly explained.
Jan says: “Here are the trends in Kelvin per decade since 1995.75 (about 17 years),…”. 17 No! It’s about 18, if that matters mathematically/trends. I really don’t; care as it shows a sloppiness in thought.
Jan also claims that using the RSS data set is cherry picking after miscalculating his own end date. Yes, end, since we are stating from today and working backwards. Using this calculation all the data sets show a zero trend for some significant period. Moreover Dr Santer made 17 years significant, and NOAA made 15 years.
Jan, continuing with the sloppy thinking meme, created a poorly constructed strawman argument re: Birmingham and Ann Arbor climate regimes. Then later redefines his strawman to be: “…a climate change from present day conditions to conditions like during the last glacial, when the global mean temperature was 5 – 7 deg. C lower and large parts of the Northern Hemisphere were covered by kilometer-thick ice shields, wouldn’t constitute a large climate change,…”. Sloppy!
You also asked who predicted the 2013 Arctic Sea Ice loss, it was Prof. Wieslaw Maslowski, another Fed Govt researcher.
Finally, re: UHI and land use impacts. These are actual measured phenomena. The physical impacts of ACO2, and other AGHGs are still not measurable only derived. So “major” means well defined, and measurable.
Menzie Chinn
Re Econometrics & anthropogenic warming, see:
McKitrick Ross R. (2013) Encompassing Tests of Socioeconomic Signals in Surface Climate Data. Climatic Change doi 10.1007/s10584-013-0793-5.
“I give two examples, one replicating a Parker-style equivalence between nighttime minimum trends in calm and windy conditions, then showing that this persists in a temperature data set that can be shown to be correlated with population growth. I also replicate the BEST-type results that rural trends are slightly greater than those of urban areas, and show that this result appears in a restricted subset of a larger model in which socioeconomic growth is significantly correlated with temperature trends. In both cases the restrictions necessary to yield the model that supposedly shows no data contamination are rejected.”
On surface temperature data, Watts quantitatively addresses the temperature quality. See the full paper & Figures:
Watts-et-al_2012_discussion_paper_webrelease (PDF)
Watts et al 2012 Figures and Tables (PDF)
The high anthropogenic impact alarm is belied by the severe Type B error (aka “systematic error”) shown by ALL the 1979 model projections running hotter than the current global temperature, rather than being normally distributed about the recent temperature. See
Roy Spencer STILL Epic Fail: 73 Climate Models vs. Measurements, Running 5-Year Means
Those models do not pass the scientific method “smell test”!
See Richard Feynman on the scientific method : “if (the model) disagrees with experiment, it is wrong”.
CoRev, at August 19, 2013 03:53 PM, wrote:
Oh, oh. You are right! We are already in 2013! I give you that, and I apologize for my mistake. Here are the trends in Kelvin per decade from 1996.75:
Data set Trend Significance
GISTEMP: +0.079+/-0.124 larger 75%
NOAA: +0.053+/-0.115 not significant
HadCRUT4: +0.058+/-0.120 not significant
RSS: +0.003+/-0.208 not significant
UAH: +0.096+/-0.211 not significant
Land only data:
BEST: +0.131+/-0.257 larger than 1 sigma
NOAA: +0.157+/-0.188 larger than 90%
All trend estimates are still positive, although the overall significance is clearly weaker. It shows, though, that one year of additional data can make a big difference.
The claim of “no global warming for 17 years” is still not valid, for the same arguments I made before. I don’t see any refutation of my arguments by you.
As I said before, for any time series that is composed of a trend and fluctuations, one can find a time period for which the trend is not statistically significant, without any exception. This is true going back starting from present day, or one can partition any time series in sufficiently small intervals, and then the trend in each of the separate intervals is not statistically significant. Therefore, it’s not statistically or scientifically valid reasoning to conclude an absence of a (warming) trend, just because one has found such a time period, for which the trend is not statistically significant. But this is exactly how the false “skeptic” argument goes. They deliberately choose a short enough time period from present day going back in time, for which the global warming trend is not statistically significant anymore, and then they claim there was no global warming, because there wasn’t any statistical significance. The “skeptic” reasoning here operates with a non sequitur.
Actually, I can predict what start years are being chosen by the “skeptics” for the cherry pick, just by looking at any ENSO index. For instance, 1997/1998 are chosen as start years. 1998 was the year of a very strong El Nino, which still has a big influence on the results of any statistical analysis with this El Nino year near the beginning of the time period. Then, the years 1999 or 2000 are rather omitted. La Nina years. Another cherry picked start year will be 2002. Actually, some of the “skeptics” start to use it already. Over the next years, the usage of this start year for the cherry pick will probably become more common among the “skeptics”. At the end of this decade, the year 2010 will probably be chosen as start year, but not the La Nina-years of 2011 or 2012.
I know these two talking points, “skeptics” tell each other, according to which Ben Santer and NOAA allegedly stated this. None of these assertions regarding the two is true.
CoRev at August 19, 2013 04:19 PM, wrote:
You will have to explain, why comparing the difference between the global mean temperatures of a glacial and interglacial climate regime with the difference of the climatological mean temperature of Ann Arbor, MI, and Birmingham, AL, the differences are quantitatively about the same, was allegedly a strawman argument, but the comparison of the increase in the global mean temperature from 1880 to today with the difference between the climatological mean temperature of Ann Arbor, MI, and Flint, MI, which was done by Bruce Hall and supported by you, was supposedly no strawman argument.
I asked you for proof of source, which you don’t seem to have, then, since you don’t provide any. Apparently, you just refer to someone’s personal opinion that was allegedly stated somewhere. I also asked you why this was relevant. So, if it was stated why is it relevant for the discussion?
So, here, instead of answering my question, you only add more assertions. But nothing to back up anything of what you claim about UHI and land use.
David L. Hagen, at August 19, 2013 05:13 PM, wrote:
Unlike the mentioned paper by McKitrick, this is not a scientific reference, because it’s nothing that has been published in any scientific journal. It’s just some draft posted in Watts’ opinion blog, which was presented by Watts accompanied with a noisy PR effort using the help of FOX news. This draft was strongly criticized because of severe flaws, even by some of Watts’ buddies, like not taking into consideration at all the time-of-observation bias in the data. The last I heard they are still working on the paper. Let’s see whether they ever get to the point where the data show what Watts wants them to show.
As I said before, these are just assertions by Spencer (and Christy) in a blog post. Opinion blogs are not scientific references. Assertions made there aren’t scientic evidence for your claims. There is no peer review there, and they don’t have to obey any scientific standards. Scientific evidence is established in the proper specialist journals of the fields, where those standards are mandated.
Jan, you’ve been arguing via assertion and strawman throughout this thread. Don’t ask me and others to support or argue your strawmen. It’s inconvenient that Santer and NOAA made their statements, your assertion they did not do so does not change them.
I also realize that the internet is inconvenient, but science by PR is the growing norm. Advocacy science is another phenomenon we are seeing with “official” statements by scientific organizations without polling its membership to see if it is actually supported. The only thing to counteract that kind of advocacy science is internet chat from its members.
I see you chose not to misdirect on the claim of all data sets showing Zero trend. The whole climate change argument is a misdirection of what is really happening: onova.s3.amazonaws.com/graphs/lappi/gisp-last-10000-new.png (the NASA version: http://www.ncdc.noaa.gov/paleo/pubs/alley2000/alley2000.gif ) or this even longer view: http://www.giss.nasa.gov/research/features/200409_methane/core1.gif
All these graphs were discovered using the nefarious internet.
Jan. Menzie, 2slugs and your fellow hangers-on, this article does a decent analysis of the change in Climate Change opinion: http://joannenova.com.au/2013/08/the-day-the-global-warming-death-spiral-began/
It concludes: “Pure speculation…
It may have taken 18 months, but the Great Global Warming Scare was tested for real for the first time in Copenhagen and it failed. The collision with decades of dismal EU monetary policy, and a couple of cold winters help seal its fate. How much of that was due to FOIA and Climategate, we’ll probably never know.
If the media had really reported what happened in Climategate at the time, they could have led opinions instead of being the mere recorders of history after the fact — telling the world what it mostly already knew. The MSM is in its own little version of a death spiral, largely because we no longer trust it to report the news without omissions. Science journalists could have punctured the global warming scare years ago if they’d been doing their jobs. Thank goodness for Booker, Bolt and Ridley, and for Delingpole. Thank goodness for Blogs.”
My own opinion is that the “trust” in the science/scientists was the big change. And, that was due largely to the internet. Comments like Jan’s re: the internet are telling
Jan
Regarding trends –
Take a look at the top panel of Menzie’s chart. Little or no positive trend from 1930 – 1980 (50 years). Significant warming within the period 1981 – 1998(17 years), then little to no warming from 1999 – 2013(14 years).
This man-made global warming is an odd beast. Across 81 years, the majority of warming is confined to a period of 17 years in the 80’s and 90’s, a little more than 20% of the period.
However, man-made CO2 was rising the entire 81 year period. Given this fact, how can man-made CO2 be the “climate control knob” that alarmists claim it to be?
It doesn’t make sense. If you say I cherry picked those periods, then show me a climate model that is consistent with virtually all the warming across an 81 year period occurring in only 17 years.
Using hadcrut4 –
51 years: 1930-1980 slope = 0.00041 per year.
http://www.woodfortrees.org/plot/hadcrut4gl/from:1930/to:1980/plot/hadcrut4gl/from:1930/to:1980/trend
18 years: 1981-1999 slope = 0.01883 per year.
http://www.woodfortrees.org/plot/hadcrut4gl/from:1981/to:1999/plot/hadcrut4gl/from:1981/to:1999/trend
14 years 2000-2013 slope = 0.00417 per year
http://www.woodfortrees.org/plot/hadcrut4gl/from:2000/to:2013/plot/hadcrut4gl/from:2000/to:2013/trend
The 80’s and 90’s warmed 4 times more rapidly than the 2000’s. 80% of the warmining for the 82 year period occurred during the 80’s and 90’s, but man-made CO2 trended higher the entire time, some claiming CO2 growth at an exponential rate, yet temperatures didn’t change, then they did, then they didn’t. Nice theory of CO2 as a climate control knob. All we have to do is cut man-made CO2 emissions and voilla! No more warming! …..right.
No cherry picking by tj, we can be certain, because he says so.
But, look how the 50-year linear trend changes when you move the start and end dates just one year earlier.
http://www.woodfortrees.org/plot/hadcrut4gl/from:1930/to:1980/trend/plot/hadcrut4gl/from:1929/to:1979/trend
By their works shall the Denialists be known.
ottnott
Call it a cherry-pick, but you miss the point. Does it really seem reasonable to you that man-made CO2 can grow at an exponential rate for 83 years, yet 80% of the warming is confined to a single 18 year period? Doesn’t that cry out for an alternative to the CAGW theory that treats man-made CO2 as a climate control knob?
Your hangup with the 50 years or the 18 years doesn’t concern me for several reasons. The cherry picking is one of them, but it is the least of them.
The major reason is that CO2 is not a control knob for the climate.
I’ll try to keep your control knob notion and modify it to illustrate (awkwardly) a more realistic relationship between CO2 levels and global temperature.
Imagine that your CO2 control knob raises and lowers the current to the electric motor of a vehicle. The current is analogous to CO2 levels, and the speed of the vehicle is analogous to global temperature. All else being equal, increasing the current (CO2 level) increases the vehicle speed (global temp).
But, there are many natural inputs as you travel along. This is an off-road vehicle, so speed for a given current level is affected by the slope of the terrain, the vegetation, the surface materials, the softness of the ground, wind speed and direction, and so on. Those are natural inputs that can increase or decrease speed/temperature for a given level of current/CO2.
The anthropogenic inputs aren’t limited to the control dial, however. Are the windows down or up? AC on? Tires inflated too little or too much? Is the driver holding the wheel steady, or scrubbing the tires back and forth? Some of the additional inputs can increase speed, and some can decrease it.
This graph breaks the anthropomorphic climate forcings into 10 categories, showing the net effects for each over 150 years. Four of them have actually had a net cooling effect in the 1850-2000 period:
http://www.giss.nasa.gov/research/news/20020114/figure2m.gif
Here’s a similar graph, with some additional periods:
http://www.skepticalscience.com/pics/KnuttiAttributionBreakdown.png
Addressing the 1930 to 1980 period more directly, here’s a graph of anthropomorphic forcings over time from 1850-2000. Note that there was a period of slow and even negative CO2 change in the 1930-1980 period. Notice also that the rate of anthropomorphic forcing peaked in the late-1970s through late 1980s and then declined (at least through the chart’s end in 2000) due to phaseout of CFCs:
http://www.giss.nasa.gov/research/news/20020114/figure1m.gif
And, addressing your question about a climate model being able to reproduce the HADCRUT temperature data pattern you described, I have one here that helpfully breaks the temperature forcings into natural and anthropomorphic components and then compares the combined forcing against HADCRUT3:
http://www.skepticalscience.com/pics/KnuttiAttributionGraph.png
I find the last graph useful also to illustrate that the year-to-year variability (aka weather) in the HADCRUT temperature data often is greater than many years of trend change due to anthropomorphic warming effects. That is one reason why one can get very misleading apparent trends between two selected dates.
tj, at August 20, 2013 12:26 PM, wrote:
Your last three comments present all the same argument, so I take this comment as reference. For your argument, you start with two presumptions about statements that were allegedly made by mainstream climate science:
1. CO2 was the only factor controlling the variations of the globally averaged surface temperature (or, generally, climate) over time.
2. The globally averaged surface temperature depends linearly on the atmospheric CO2 mixing ratio.
Then you present the observed variations of the global surface temperature, and since those haven’t linearly followed the CO2 increase, you claim that the observed temperature variations since 1930 had been inconsistent with “CAGW theory”.
Only, your whole argument is nothing else than a big strawman argument, one that is commonly used by AGW “skeptics”, since no one on the science side claims that CO2 was the only controlling factor for the variations of the global temperature, or climate in general, and no one claims that the observed temperature in the real world would linearly follow the CO2 mixing ratio. Instead, the global temperature variations in the real world are the result of the integral response to all external forcings combined, plus the contributions to the temperature variation coming from unforced internal variability. Major external forcings are CO2 plus other greenhouse gases, stratospheric and tropospheric aerosols, and solar variability. There are also some smaller contributions from other forcings like land use.
If all the relevant forcings are taken into account, the observed temperature variability is consistent with what mainstream climate science says. Accordingly, climate models reproduce the variations of the climatological mean global temperature since 1850, including for the period from 1950 to 1980 when an increase in the negative forcing by aerosols compensated the increase in the positive forcing by greenhouse gases, within a range of uncertainty (see Forster et al., JGRA, 2013, doi:10.1002/jgrd.50174).
The study by Kaufmann et al., PNAS, (2011) which was referenced by you here, is exactly making this argument, that if the variations of all forcings, natural and anthropogenic ones, and the contribution from ENSO variability (which is unforced, natural variability) are all taken into account, the observed temperature variability of the years 1998 to 2008 was consistent with the sum of those contributions and with our scientific understanding of the climate system. So, you should have known what I just have written about what mainstream climate science says. I wonder whether you even have read the scientific study you referenced here to support your arguments.
I also have objections to your term “CAGW theory”. What is “CAGW theory” supposed to mean? What are the alleged central statements of this “CAGW theory”? I do not know any scientific publication that uses the term “catastrophic anthropogenic warming”, for which the abbreviation CAGW stands. I only see AGW “skeptics” using this term all the time. It’s just another strawman.
In your comment on August 20, 2013, at 09:41 AM, you say,
This is not a meaningful statement. You would have to show at least that the trends, which you compare can be statistically distinguished. Nothing follows simply from the statement about the “4 times”. Otherwise, I also could claim that the trend since the beginning of 2012 (0.46 Kelvin per decade in HadCRUT4) was 2.64 times the trend from 1980 to 1999. What an acceleration of global warming! It’s nonsense, since the time period is too short and the 2-sigma interval is too large to draw any meaningful conclusion.
A technicality. None of the periods, for which you compared the trend estimates, 1930 to 1980, 1981 to 1999, and 2000 to 2013 include the years 1980 or 1999.
Small correction to my last comment at 03:07 PM.
CAGW = catastrophic anthropogenic global warming
I accidentally had dropped “global”. Blame gravity!
ottnott and Jan
You can’t have it both ways. Either man-made CO2 emissions are a dominant forcing or they are not. If man-made CO2 is not a dominant forcing then why all the time, effort, propaganda and money devoted to dramatically reducing man-made CO2 emissions?
Policy makers treat man-made CO2 as the control knob. It is their policy that contradicts your valid points that there are many climate control knobs, and we are naïve to think we’ve identified all them and their sensitivities.
Their policies are aimed at dramatically decreasing man-made CO2 emissions and drastically increasing the price of energy for everyone, including those who can least afford it.
Your arguments above prove they are mistaken to place so much emphasis on man-made CO2, as evidenced by an 83 year period in which man-made CO2 was a minor player for all but the 80’s and 90’s.
“Drafts seen by Reuters of the study by the U.N. panel of experts, due to be published next month, say it is at least 95 percent likely that human activities – chiefly the burning of fossil fuels – are the main cause of warming since the 1950s.”
Okay then explain this:
http://wattsupwiththat.files.wordpress.com/2013/08/1895-1946_1957-2008_temperature-compare.png
Full discussion:
http://wattsupwiththat.com/2013/08/20/when-somebody-hits-you-with-that-new-ipcc-is-95-certain-talking-point-show-them-this/
tj:
If nonsense would stop the ice from melting and the seas from rising, you could save the planet. You could be a hero. Walk tall.
Bruce:
the watts piece illustrates two of the tricks he uses to help Denialists feel smart while they say something dumb.
The quote about the IPPC draft addresses warming during the period from 1950 on. watts reads it and wonders why the IPPC is 95% certain that warming from 1895-1946 is not caused by man. Tricky like Nixon, that one.
Since you are feeling so smart right now, Bruce, maybe you can explain the other watts trick underlying the piece you posted. watts likes to feed the belief Denialists apparently hold: that, because nature has shown the ability to change climate as much as or more than humans have, anthropomorphic climate change either doesn’t exist or isn’t anything to worry about.
That belief is why watts showed the 1895-1946 temperature chart as a “debunking” of the IPPC claims about human responsibility for the 1950-on temperature increase.
I’m wondering, Bruce, why an adult would believe that the natural variations cancel out either the existence of or worries about human-caused variation? Is there some mystical tome somewhere that says that there is but one magical climate power ring, and it circles nature’s finger? Does energy obey different physical laws in response to nature’s activities than in response to human activities? Can you “explain this” for us?
It never ceases to amaze me how gullible even the most intelligent persons can be and this blog post and comments demonstrate gullibility to a high degree.
All the climate models, so far, have proven to be wildly inaccurate in their predictions.
Until all the physical principles governing global climate are demonstrated to have been accurately understood, a degree or two over a hundred years could easily be just natural cycles/noise.
CAGW is not science. It is nonsense. The only reason this nonsense is propagated is that it has become a lucrative business for some.
There is nothing to be “Denialist” about. It has got warmer. So what? Until someone cracks the physics behind global climate to a level that demonstrates an understanding to an extremely high degree of accuracy, the whole contentious subject of fractions of a degree Celsius man-made warming is just wasteful idle speculation.
Is it really possible that intelligent grown adults can actually fret and quarrel over an as yet unproven hypothesis?
Ottnot: “I’m wondering, Bruce, why an adult would believe that the natural variations cancel out either the existence of or worries about human-caused variation?”
An adult might question the veracity of the claims of “human-caused variation” from the very beginning… claims based on models that have virtually no relationship to observation and without any successful record of climate change prediction.
An adult might question the irresponsibility of those who would create vast wealth redistribution schemes on the basis of those unfounded claims.
An adult would not accept ridiculous claims of “consensus” as evidence when the facts demonstrate the opposite.
But, hey, we’re not all adult in our thinking processes. Children are more prone to accept the statements of “authority” without being healthily skeptical.
ottnott
If nonsense would stop the ice from melting and the seas from rising, you could save the planet.
And there you have it folks. When confronted with logic and evidence that disputes the claim that global climate is highly sensitive to variation in man-made CO2, the alarmists resort to personal attacks.
The quote about the IPPC draft addresses warming during the period from 1950 on. watts reads it and wonders why the IPPC is 95% certain that warming from 1895-1946 is not caused by man.
No, you are being to narrow in your interpretation. If you look at the 2 major upswings in warming during the 20th century, they are nearly identical. However, you claim the first is natural, while the second is entirely man-made. The first demonstrates that rising concentrations of man-made CO2 are not necessary to create the degree of global warming experienced during the 80’s and 90’s.
The climate models that rely on CO2 as the dominant forcing cannot replicate the ~leveling of global temperature anomalies for the past ~15 years.
Therefore, the claim that global surface temperatures are “highly” sensitive to variation in man-made CO2 is falsified.
None of the CO2 driven climate models can be calibrated using the first 60 years of data, an accurately simulate the second 60 years of data. Similarly, none of the CO2 driven climate models can be calibrated using the second 60 years of data and accurately simulate the first 60 years.
Why do we rely on the CO2 driven climate models to drive policy that will necessarly cause the price of energy to skyrocket? Perhaps it’s not temperature/climate that is the motivating factor for our policy makers?
tj, at August 20, 2013 05:38 PM,
There is only one way for me, which is the way of what the results from scientific research say. What those results are can be found in the scientific publications of the field.
Anthropogenic CO2 has been the dominant forcing for the total of the period since about the mid of the 20th century, having the largest integrated effect over the whole time period, since CO2, and, in turn, the forcing coming from it, has been continuously increasing. This statement doesn’t mean it was the dominant forcing controlling the temperature variability from one year to only the next one, or even from one decade to the next one, although it’s also non-negligible over the total of a decade. There isn’t any contradiction between the statement about the dominance of CO2 regarding the integrated climate change over the total of the period on one hand, and, on the other hand, the statement that CO2 doesn’t control all the temperature variability within the time period.
For instance, let’s compare the radiative forcing changes from solar variability with the radiative forcing change coming from CO2. Solar activity has a quasi 11-year cycle. Insolation reached a cycle maximum in the year 2000, then solar activity went down to a minimum in early 2008. The radiative forcing change from the maximum to the minimum amounts to about -0.25 W/m^2. This is of about the same magnitude, but with opposite sign, of the additional forcing that currently comes from an increasing CO2 mixing ratio over a time period of 10 to 15 years. Thus, going from the year 2000 to the year 2008, the negative forcing change from decreasing solar activity within the 11-year cycle could more than compensate the increasing forcing coming from CO2 over the same time period. The net forcing change from 2000 to 2008 from adding the two forcings is somewhat negative, then. On this short time scale, the forcing change from the CO2 change is not dominant.
However, solar activity is quasi cyclical. After it has reached its minimum in the 11-year cycle it goes up again (assuming the sun doesn’t go into a Maunder minimum like state). Integrated over the multiple solar cycles since about 1950, solar activity has not changed much. Thus, the integrated forcing change from solar activity over the total period is very small. On the other hand, CO2 in the atmosphere has increased from about 310 ppm to almost 400 ppm between 1950 and today. Using the approximation by Myhre et al., GRL (1998), doi:10.1029/98GL01908 for the radiative forcing due to CO2,
dF = 5.35*ln(CO2(1)/CO2(0)),
the radiative forcing change by CO2 amounts to about 1.36 W/m^2 between 1950 and present day. Integrated over the whole period, CO2 is clearly dominating compared to the changes in solar activity.
In the example above I only compared CO2 with solar activity to demonstrate the concept and to show that there isn’t any contradiction. As I previously mentioned, other forcings are important too, and they have to be taken into account as well to understand climate variability.
There have been certain time periods during which other forcings with opposite sign compensated the additional positive forcing coming from anthropogenic greenhouse gases, like between the 1940ies and 1970ies. If you have two forcings of about equal magnitude, but of opposite sign, so that the net effect is about Zero, the conclusion from this that one of the forcings was a “minor player” is logically a non sequitur.
Equally, the conclusion from the fact that there have been time periods when an increase by magnitude of negative forcings (which partially are also anthropogenic like the one from industrial aerosols) could compensate the increase in positive forcing by CO2, that the effects of CO2 on climate won’t be substantial in the future, so that no one needs to worry, is logically a non sequitur as well.
Anthropogenic greenhouse gases are very likely continue to increase. The increase has accelerated in recent decades, and the increase may continue to accelerate. The radiative forcing from anthropogenic greenhouse gases will become larger and larger during this and possibly following centuries, accordingly. Unless, we enter a period of much larger volcanic activity, which continuously blows an increasing amount of aerosols in the atmosphere that is sufficient to compensate the increasing forcing from greenhouse gases, or some low probability event occurs, like Earth is hit by a big asteroid, global temperature will very likely continue to increase over time scales from multiple decades to centuries due to the increasing greenhouse gas forcing, but not simply linearly, since it is overlaid with variability on shorter time scales, e.g., due to aerosol variability or unforced natural variability on annual and inter-decadal time scales.
The current global temperature is near the upper boundary of the temperature variability of the entire Holocene (Marcott et al., Science, 2013, doi:10.1126/science.1228026). With the projected increase in the temperature for all non-mitigation scenarios, the global temperature will reach values at the end of this century, which human civilization has never experienced. An increase in the global mean temperature by about only 2 to 3 deg. C would change global climate already to conditions that were prevalent during the Pliocene about 3 million years ago. If the increase is larger, the CMIP5 projections are in a range of about 2 deg. C and larger 10 deg. C for the year 2300, depending on scenario and model, one has to go more and more back in time to find similar climate conditions in the geological past of Earth, depending on the magnitude of the increase. Only, even the transition to the Paleocene-Eocene Thermal Maximum, which occurred about 55 million years ago, a naturally caused extreme climate change event, when global temperature increased relatively quickly for geological time scales by more than 5 deg. C, took about 20,000 years. The human induced climate change of possibly the same magnitude or even larger, will occur within only a few hundred years.
Some say nevertheless, this wasn’t anything to be concerned about.
Jan, you cite Marcott 2013?????? Wasn’t it withdrawn or just trashed? Another Hockey Stick using a data merging methodology that appends high volatile and frequency data with low frequency smoothed data.
Jan
the other hand, CO2 in the atmosphere has increased from about 310 ppm to almost 400 ppm between 1950 and today.
That’s 90 ppm over 62 years.
In 1997 CO2 was at ~360 ppm.
400 – 60 = 40. 40/90 = .44.
Thus, 44% of the change in atmospheric CO2 has occured in the last 15 years, yet the global temperature anomalies are nearly flat.
http://www.woodfortrees.org/plot/hadcrut4gl/from:1997/to:2013.5/plot/hadcrut4gl/from:1997/to:2013.5/trend
The fact that nearly half of all the increase in atmospheric CO2 since 1950 has occurred in the last 16 years, yet the change in temperature has barely budged should be sufficient for you to throw out your CO2 driven model(s).
dF = 5.35*ln(CO2(1)/CO2(0))
How do you estimate the 5.35?
The current global temperature is near the upper boundary of the temperature variability of the entire Holocene
Entire Holocene? It looks like the IPCC is ready to admit the mideaval warming period was as warm or warmer.
IPCC AR5 – The 30 years from 1983-2012 was very likely the warmest 30-year period of the last 800 years. http://www.washingtonpost.com/blogs/capital-weather-gang/wp/2013/08/20/leaked-climate-report-ten-nuggets-worth-noting/
Anthropogenic greenhouse gases are very likely continue to increase.
The Western Bloc coal industry is in government mandated decline.
Alternative fuel production/development is experiencing government mandated growth.
US CO2 emissions are below 1997 Kyoto protocal levels.
You are advocating a job/growth killing solution to a problem that is of dubious merit and will solve itself in a few decades as man-made CO2 emissions level off and begin to decline as economical substitutes to carbon based energy sources become avaialable.
Or, are you a peak oil “denier” 😉
CoRev, at August 21, 2013 10:02 AM wrote:
Yes, no, and no. The last “no”, with respect to the side of science. Of course, the usual suspects “trashed” it like AGW deniers trash any results from scientific research they don’t like because those results are in contradiction to the AGW deniers’ belief system, using made up assertions.
Typical AGW denier response. Rejecting results from scientific research, using rumours and unfounded, made up assertions.
You don’t have anything.
Jan, I’ve got nothing? You’ve got rubbish! Some comments: “There are two factors in the new Marcott paper that are major red flags. For one, there is hardly any data in the modern end of the graph. Ponder how researchers can find 5,000 year old Foraminifera deposits, but not ones from 1940? Two: they’ve smoothed the heck out of longer periods. Marcott et al clearly say there is “…essentially no variability preserved at periods shorter than 300 years…” So if there were, say, occurrences of a warming rise exactly like the last century, this graph won’t show them.
Some of the data has a resolution as poor as “500 years” and the median is 120 years. If current temperatures were averaged over 120 years (that would be 1890 to now), the last alarming spike would blend right in with the other data. Where would the average dot be for the “last 500 years”. It would be low, cold, and there would be no hockeystick at all in a “500 year” averaged graph. But if there was a period of rapid warming sometime in the last 10,000 years, one which occurred over say, 50 years, it would disappear amongst the uncertainties.”
and
“The new hockey-stick blends high and low resolution data from many proxies in the past with mixed resolution data (but few proxies) in recent times. It’s a complex method which produces something not seemingly reflected in the actual proxy data. Where are the hockey-stick-proxies? It also doesn’t help that ten percent of all 73 proxies fail their own criteria for inclusion.”
But the truth is in what Marcott admitted: ” Regarding the NH reconstructions, using the same reasoning as above, we do not think this increase in temperature in our Monte-Carlo analysis of the paleo proxies between 1920 − 1940 is robust given the resolution and number of datasets. In this particular case, the Agassiz-Renland reconstruction does in fact contribute the majority of the apparent increase.
…
Regarding the SH reconstruction: It is the same situation, and again we do not think the last 60 years of our Monte Carlo reconstruction are robust given the small number and resolution of the data in that interval.”
Haven’t we seen this approach before? Oh yes, several other hockey stick constructions use the same approach. “…blends high and low resolution data from many proxies in the past with mixed resolution data (but few proxies) in recent times.”
For more info read Steve McIntyre’s analysis: http://climateaudit.org/?s=Marcott
I know, I know the usual suspects, but he gets it right. AGAIN!
How desperate and embarrassing to select such a poorly constructed study to reference.
tj, at August 21, 2013 10:49 AM, wrote:
It just doesn’t mean much. You have cherry picked 1997 as start year, exactly because it gives you the result you desired to get, a “nearly flat” trend. 1997/98 was the year of a very strong El Nino, a phenomenon of chaotic, unforced natural variability, strongly affecting the results of the trend analysis. If you shift the start year of the trend estimation only two years forward in time, to 1999, you get a trend of 0.07 Kelvin per decade, which is at least one standard deviation significant. If the results from a trend analysis change a lot just by shifting the start year a little bit (or by switching the data set, like from HadCRUT4 to GISTEMP), it only shows that the time period is too short to give you a statistically robust result, and too short to draw any conclusions with confidence.
I do not need to throw out anything that is just a product of your own fantasy. I just had spent two long comments to explain that CO2 isn’t the only factor that affects the global temperature variability, that no one claims the global temperature followed linearly the CO2 mixing ratio, and why a divergence between CO2 and global temperature over this time scale doesn’t refute anything what I say, or what mainstream climate science says.
And all you can come up with now is only a repetition of the old nonsense, to which I already have replied. It’s like a broken record. You just have made the thread recursive, regarding this question.
It shows me that you aren’t really interested in learning my arguments, and you aren’t really interested in any real discussion, since this would require to actually address my arguments.
Thus, talking to hard core “skeptics” like you seems to be a big waste of time. However, I assume there are others here, reading silently, who are actually interested in my arguments against the “skeptic” distortions of the science.
Read the paper that I referenced.
This statement neither follows logically from, nor is it logically excluded as possibility by following statement:
And what I said is not in contradiction to this statement, either. I did not say present day global temperature was the warmest of all Holocene temperatures.
Well, if it is going according to your apparent wishes, and the wishes of the ones who oppose any measures to reduce anthropogenic greenhouse gas emissions, and if I take into account the needs of humans on the whole planet requiring industrial growth, I anticipate a continuing increase in the atmospheric greenhouse gases in the atmosphere.
tj, at August 21, 2013 07:33 AM, wrote in response to ottnott,
regarding this graphic http://wattsupwiththat.files.wordpress.com/2013/08/1895-1946_1957-2008_temperature-compare.png, referenced by Bruce Hall, at August 20, 2013 06:27 PM,
Of course, because Anthony Watts has specifically searched for two time periods, for which the patterns appear to look similar. There is no other reason for the choice of the specific length of the time periods, or for the specific start and end years chosen. There is certainly no reason based in physics. It’s a clear example of cherry picking of data so that they give the desired results.
No, ottnott wasn’t the one who claimed this. Anthony Watts claims this. And it’s apparently just made up by Watts that the increase from 1895 to 1946 was caused by “Nature”. ottnott just replied to Watts’ logically false trickery.
CO2 mixing ratios increased from 295 to 310 ppm from year 1895 to year 1947. This translates into an increase of radiative forcing by CO2 of about 0.26 W/m, using the same approximation from above, not less than the forcing change between maximum and minimum of the recent solar cycles. What reason is there to assume that this wouldn’t have provided any noticeable contribution to the increase in the global temperature between 1895 to 1947? Solar activity also increased in the first half of the 20th century. It’s much more reasonable to think that the increase in the temperature during this time period was the combined effect of both anthropogenic and natural causes.
Even if we assume the increase in temperature between 1895 and 1947 was solely naturally caused, this only refutes a statement the IPCC report doesn’t make. The IPCC report doesn’t say, “No natural causes could have caused at any other time a similar increase in temperature as observed in the second half of the 20th century”. However, it doesn’t refute the statement the IPCC report actually makes.
If you want to refute the statement the IPCC report actually makes you will have to identify the natural factors, based on physics, which supposedly could have caused the global temperature increase after 1950, and provide the evidence that those natural factors changed in a direction and by a magnitude that they could have caused the global temperature increase. Additionally, you would have to provide the evidence that the identified main cause, the increase in anthropogenic greenhouse gases since 1950 couldn’t actually have caused the observed global temperature increase, based on physics.
Simply not true. Climate models do reproduce time periods of about this length, during which global atmospheric temperatures in the models don’t change much, even with increasing greenhouse gases (see Peterson and Baringer, BAMS, 2009, http://dx.doi.org/10.1175/BAMS-90-8-StateoftheClimate, pg. S22f; Santer et al., JGR, 2011, http://dx.doi.org/10.1029/2011JD016263).
Unless you request that the climate models reproduce the exact chronological pattern of global temperature variability as observed in Nature, and you fault the models if they are not able to do that. They indeed are not able to do that. Such a request would be nonsensical, though. Temperature variability over such a short time period is largely chaotic unforced variability. It’s objectively not possible to reproduce that. It’s like having two dices, a Nature dice and a model dice, having one single throw with the Nature dice, getting a number, and then requesting that 100 throws with the model dice always produce the same number as the one throw with the Nature dice. And then claiming, the model dice was faulty when the series of throws doesn’t deliver such a result.
What exact claim, made by whom and where, do you believe to refute here? Please provide an exact proof of source for the alleged claim.
Please provide an exact proof of source for this assertion. I would like to know where this nonsense originates. Or did you make up this statement yourself?
Climate models are not calibrated at all in this way.
Jan says: “It’s a clear example of cherry picking of data so that they give the desired results.”
The clear example of cherry picking is to select 1880 as the base point knowing full well that was an abnormally cold period. Why not pick 1920 or 1930 as a base point? Then there would be virtually no global warming in 90 years.
As to the charts comparing two periods with nearly identical warming patterns over identical time spans, well that’s cherry picking because one is “natural” and one is “man made” and we can’t allow “natural” variation to explain away the basis of CO2 political science.
The elephant in the room, of course, is that correlation is not causation. A several decade span with CO2 increasing as global temperatures increase is nice correlation, but not causation… either way. Similarly, a 15-20 year span where CO2 increases while global temperatures flatline is definitely not evidence of being “consistent with” causation.
When climate models are able to fit to observed cyclical temperatures and then predict… accurately… cyclical changes over a similar period of time, we can then have some confidence in those models. Until then, we have interesting conjecture… nothing more. And certain not enough to redistribute trillions of dollars.
Jan I read your replies and you are clearly a complete fool. You are asking skeptics to disprove your pet hypothesis. WRONG! It is up to you fraudsters and scamsters living off the largesse of us taxpayers to prove that you are without a doubt absolutely right about threat of man-made CO2!
All skeptics need do is point to the gaping holes in your pet hypothesis.. holes so large that the entire recent climate change could just as easily be totally 100% due to natural causes!
This is all that Watts and many many other honest and scrupulous scientists and engineers have done – to point out that NOTHING extraordinary is happening and that ALL climate models are abject failures when it come to preditive ability!
As Richard Feynman once said, if the real world data contradicts your theory then your theory is WRONG!
Jan’s trying to have it both ways. ” If the results from a trend analysis change a lot just by shifting the start year a little bit (or by switching the data set, like from HadCRUT4 to GISTEMP), it only shows that the time period is too short to give you a statistically robust result, and too short to draw any conclusions with confidence.” While he ignores that ALL the DATA Sets show a growing hiatus. Each are different, mostly because of their differences in processing and data sources.
This graph shows the length for each of the major data sets with CO2 overlayed: http://wattsupwiththat.files.wordpress.com/2013/01/offset-0-34.png?w=584&h=438
What is hilarious is the need for some to deny the existence of the hiatus by obfuscating the data (cherry picking), name calling (denialist), and just plain lying (Simply not true. Climate models do reproduce time periods of about this length, during which global atmospheric temperatures in the models don’t change much, even with increasing greenhouse gases (see Peterson and Baringer, BAMS, 2009, http://dx.doi.org/10.1175/BAMS-90-8-StateoftheClimate, pg. S22f; Santer et al., JGR, 2011, http://dx.doi.org/10.1029/2011JD016263).
The lie?– “Simply not true. Climate models do reproduce time periods of about this length,…” This length was referring to this: “~leveling of global temperature anomalies for the past ~15 years.”
What Santer actually said: “a multi-model ensemble of anthropogenically-forced simulations displays many 10-year periods with little warming. A single decade of observational TLT data is therefore inadequate for identifying a slowly evolving anthropogenic warming signal. Our results show that temperature records of at least 17 years in length are required for identifying human effects on global-mean tropospheric temperature.” 10 years is much less than 15. Worse, we are just months short of Santer’s 17 year conclusion.
Jan, your comments are representative of the science, sloppy, inaccurate and too often over stating the facts.
Jan
You are tiptoeing around the issues by using semantics.
I did not say present day global temperature was the warmest of all Holocene temperatures.
No but you implied that we are near that level and are on our way to being the warmest since human’s became civilized.
the global temperature will reach values at the end of this century, which human civilization has never experienced. An increase in the global mean temperature by about only 2 to 3 deg. C would change global climate already to conditions that were prevalent during the Pliocene about 3 million years ago.
the global temperature will reach values at the end of this century, which human civilization has never experienced.
I anticipate a continuing increase in the atmospheric greenhouse gases in the atmosphere.
So you are a peak oil denier! I’m not sure how oil production falls and coal is mandated out of use, yet man-made CO2 emissions magically increase as we look 50 to 100 years in the future.
Again, I have to repeat myself because you dodge the main issue – You are advocating a job/growth killing solution to a problem that is of dubious merit and will solve itself in a few decades as man-made CO2 emissions level off and begin to decline as economical substitutes to carbon based energy sources become avaialable.
CoRev, at August 21, 2013 01:11 PM, wrote:
So, you have found another AGW “skeptic” blog, where someone has published his opinions and assertions. And this is supposed to refute a peer reviewed scientific study? The quote you bring here doesn’t mention that Marcott et al. tested the robustness of the results, regarding the question of the suppressed high frequencies. The results from the tests are that even though there is a suppression of high frequency variability, it’s not as much that it alters the central results and conclusions from it. The tests are explained in detail in the supplemental material to the study. To draw their conclusions at the end, they also take the high frequencies into consideration.
And the issue with the lack of robustness of the uptick in the part of the reconstruction for the last century is just a strawman argument by McIntyre. The uptick in the reconstruction from the proxies is not needed for the conclusion that the global mean temperature has risen from the lowest 5% of the Holocene temperature distribution to at least the upper third of the Holocene temperature distribution within only a century, and that the projected global temperatures for the end of this century from all the CMIP3 warming scenarios lie all beyond the Holocene temperature distribution. We have the instrumental temperature measurements to know that the temperature uptick for the last 100 years has been real. Accordingly, Marcott et al., base their conclusions on a comparison between the data from the instrumental temperature record and the Holocene temperature distribution, not on the uptick in their reconstruction.
Thus, McIntyre doesn’t just have an opinion and makes assertions, he also misrepresents the content of the study to his audience.
What I generally find particularly appalling about McIntyre’s elaborations in his blog is not that he has an opinion about stuff. Anyone is free to have an opinion about anything. Instead, it’s his smearing of scientists in his articles, who publish results he doesn’t like. I would not publicly accuse another scientist who has published a scientific study to have committed fraud/misconduct, if this hasn’t been proven true through an official investigation. Such an accusation is extremely serious, because if it is really proven that a scientist has committed fraud, it very likely leads to the professional death of the scientist. But, I guess, McIntyre doesn’t have the same standards. The standards of AGW “skeptics” are generally lousy anyway, according to my personal experience with them.
Let me know when McIntyre has published an actual scientific study where he has presented his own reconstruction of the Holocene temperatures, together with his assumptions, methodology, and conclusions, if he thinks the methodology in and results from the Marcott et al.’s study are wrong and can be refuted. Then I am going to pay attention to it. As long as he doesn’t do this it’s all just assertions and opinion by him to keep his devote followers happy. It’s just fair to request from McIntyre that he measures up to the same scientific standards he demands from other scientists to follow, whose studies he “audits”, don’t you think? The postings in McIntyre’s blog don’t fulfill scientific standards.
Of course you would say this. You clap to anything as long as it seems to confirm your belief system, what dubious source ever it is coming from. As much has already become clear.
Now, that’s funny that you say that. I am certainly not desperate, since I can back up my statements in my comments, using references that contain results from real scientific research published in the real scientific literature. Whereas, when you don’t just bail right away once you are challenged by an argument contradicting your claims, or requested to back up your assertions, you usually only have to offer some junk from dubious AGW “skeptic” blogs.
Jan, your whole argument for Marcott is that the ending shows a higher range: “To draw their conclusions at the end, they also take the high frequencies into consideration.” But, you actually ignored my Marcott quote:”But the truth is in what Marcott admitted: ” Regarding the NH reconstructions, using the same reasoning as above, we do not think this increase in temperature in our Monte-Carlo analysis of the paleo proxies between 1920 − 1940 is robust given the resolution and number of datasets. In this particular case, the Agassiz-Renland reconstruction does in fact contribute the majority of the apparent increase.
…
Regarding the SH reconstruction: It is the same situation, and again we do not think the last 60 years of our Monte Carlo reconstruction are robust given the small number and resolution of the data in that interval.”
How desperate and embarrassing to select such a poorly constructed study to reference. Repeating the same rubbish does not improve it. Making false claims of peer reviewed publishing is unbecoming. This is a brief history of his current CC writings:
McIntyre, Stephen; McKitrick, Ross (2003). “Corrections to the Mann et al. (1998) Proxy Data Base and Northern Hemispheric Average Temperature Series”. Energy & Environment 14 (6): 751–771. doi:10.1260/095830503322793632.
McIntyre, Stephen; McKitrick, Ross (2005). “The M&M Critique of the MBH98 Northern Hemisphere Climate Index: Update and Implications”. Energy & Environment 16 (1): 69–100. doi:10.1260/0958305053516226.
McIntyre, Stephen; McKitrick, Ross (2005). “Hockey sticks, principal components, and spurious significance”. Geophysical Research Letters 32 (3): L03710. Bibcode:2005GeoRL..3203710M. doi:10.1029/2004GL021750.
McIntyre, Stephen; McKitrick, Ross (2009). “Proxy inconsistency and other problems in millennial paleoclimate reconstructions”. PNAS 106 (6): E10. Bibcode:2009PNAS..106…10M. doi:10.1073/pnas.0812509106. PMC 2647809. PMID 19188613.
McKitrick, Ross; McIntyre, Stephen; Herman, Chad (2010). “Panel and multivariate methods for tests of trend equivalence in climate data series”. Atmospheric Science Letters 11 (4): 270–277. Bibcode:2010AtScL..11..270M. doi:10.1002/asl.290.
O’Donnell, Ryan; Lewis, Nicholas; McIntyre, Steve; Condon, Jeff (2011). “Improved Methods for PCA-Based Reconstructions: Case Study Using the Steig et al. (2009) Antarctic Temperature Reconstruction”. Journal of Climate 24 (8): 2099–2115. doi:10.1175/2010JCLI3656.1.
McIntyre, Stephen; McKitrick, Ross (2011). “Discussion of: A statistical analysis of multiple temperature proxies: Are reconstructions of surface temperatures over the last 1000 years reliable?”. The Annals of Applied Statistics 5 (1): 56–60. arXiv:1105.0524. Bibcode:2011arXiv1105.0524M. doi:10.1214/10-AOAS398L.
Jan,
You really are sounding like a broken record. Repeating and repeating yourself.
McIntyre does not need to become a third rate pseudo-Scientist with published speculative nonsense papers using temperature proxies and alarmist language.
All a skeptic need do is point out the pathetically bad methodology used by the climate researchers and in particular the “hockey stick team”. There is NO obligation for skeptics to stoop to the level of incompetence of mainstream climate researchers. Why should McIntyre ruin his reputation and integrity to please a bunch of alarmist pseudo-scientists?
Jan P Perlwitz, In case you thought you were just typing to a brick wall, I want to thank you for your contributions to this blog thread. I had given up on the thread last week (too many mini-monchtons) but when I came back yesterday on a whim, I was pleased to find your many informative comments. Great work.
CoRev, at August 23, 2013 09:34 AM, wrote:
I did not talk about the range of the “ending” of the reconstruction in the paragraph of my comment, where this quoted sentence comes from. In this paragraph, I instead replied to McIntyre’s assertion about the issue with the suppressed high frequencies. “At the end” refers to the end of Marcott et al.’s paper. A paper usually ends with the conclusions.
This is a different issue than the one with the non-robust uptick in the reconstruction for the 20th century. Thus, your “but” in your following sentence constructs a false contradiction between my reply to the high-frequency issue and the alleged quote by Marcott et al. about the 20th-century uptick issue, which I allegedly ignored.
It is not true that I ignored this. I addressed this in that paragraph of my comment, which started with, “And the issue with the lack of robustness of the uptick in the part of the reconstruction for the last century is just a strawman argument by McIntyre…”
It’s really not so relevant whether Marcott et al., “admitted” that the uptick in the 20th century wasn’t robust. McIntyre or you try to give the impression that the conclusions in the Marcott et al. study about the 20th temperatures were invalid because of this lack of robustness of the 20th-century uptick in the reconstruction. But this is just a strawman argument, because Marcott et al.’s conclusions do not rest on this uptick in the reconstruction.
Exactly. Your repeating of the same rubbish, to which I already replied, doesn’t improve it.
What alleged false claims? What is this list of publications supposed to prove?
I didn’t say McIntyre has never published anything. Your claim about the “false claims” is the one that is false. I know that McIntyre has published stuff in the past. I know that he has tried to refute the “hockey stick” in his publications, although he has failed with his attempts.
What I said is that his articles on his blog are just opinion and assertions, and that these articles do not fulfill scientific standards. So far he only has produced opinion and assertions about the Marcott et al. paper, which you complimented with, “he gets it right. AGAIN!”, although I wonder how you could possibly know that. I said, “Let me know when McIntyre has published an actual scientific study where he has presented his own reconstruction of the Holocene temperatures, together with his assumptions, methodology, and conclusions, if he thinks the methodology in and results from the Marcott et al.’s study are wrong and can be refuted.” I’m not aware that McIntyre had published any paper on a temperature reconstruction of the whole Holocene. There is none in the list you quoted here.
ExTx, thanks for your kind words.
Jan, one definition for robust in statistics: “robust statistics Statistical methods insensitive to the effects of outliers (which may be mistakes or contaminated data). The methods rely on medians rather than means, and use more information from the central than from the outlying observations. The ideas are associated with exploratory data analysis.” In this paper Marcott et al make a comparison of the current temperature (is it a peak? is it an outlier? is surely is neither mean nor median), and makes a claim: “Current global temperatures of the past decade have not yet exceeded peak interglacial values but are warmer than during ~75% of the Holocene temperature history.” (From the paper’s abstract.)
You obviously believe: “To draw their conclusions at the end, they also take the high frequencies into consideration.” is good science when they have removed the peaks by using their methodology.
What is funny, is the assumption Marcott told us something meaningful. Reinterpreting his: “…warmer than during ~75% of the Holocene temperature history.” can be restated as the current temperature is lower than ~25% of the “Holocene temperature history.” Which does not make a case for unprecedented for the Holocene, and removal of the peaks does not make a case for even the past 1,500 years.
Perhaps a belief that 25% of the smoothed data is higher than today’s temperature makes a case for extraordinary action. To me it says today is well within the norms as we have survived and thrived during those 25% warmer periods.
The only strawman argument is yours re: McIntyre. The only opinion that can be questioned is yours re: the value of the Marcott study.
How desperate and embarrassing to select such a poorly constructed study to reference.
ExTx, you can now add your analysis.
Jan,
You re-repeated yourself again. Quote
“I said, “Let me know when McIntyre has published an actual scientific study where he has presented his own reconstruction of the Holocene temperatures, together with his assumptions, methodology, and conclusions, if he thinks the methodology in and results from the Marcott et al.’s study are wrong and can be refuted.” I’m not aware that McIntyre had published any paper on a temperature reconstruction of the whole Holocene. There is none in the list you quoted here.”
Why do you insist that others conduct pseudo-science?
A skeptic merely needs to point out obvious flaws to show that alarmist climate science is just B.S.
As the climate gate emails demonstrated, getting a skeptic paper published is nigh impossible anyway as the “hockey shtick” gatekeepers are aggressive and act collectively and nefariously to block the publishing of papers that disagree with their agenda/propaganda.
CoRev: You can continue to copy your opinions from McIntyre’s assertions in his blog, and to rely on second hand information on the Marcott et al. paper. It still is only opinion and assertion. Opinion blogs are not on equal footing with the peer reviewed scientific literature. I already told you I am going to pay attention to McIntyre, if he measures up to the same high scientific standards by publishing his own Holocene reconstruction in the proper venue.
In the future, more papers on Holocene temperature reconstructions will very like be published, using additional data and varying methodological approaches. The results won’t be identical, although my bet is on that the core results and conclusions of the Marcott et al. paper will pass the test of time, like the “hockey stick” from the Mann et al., GRL, 1999 paper has passed the test of time so far, despite all the AGW “skeptic” rotations and smear campaigns against Michael Mann.
And if it doesn’t then the conclusions will be revised. This is part of the normal scientific process.
In the interests of elevating the dialog, might I suggest restricting assertions about scientific findings to those that can reference results in a peer reviewed journal?
Menzie,
Peer review is not respectable in the niche of climate science. Restricting to peer reviewed papers would limit the discussion to alarmist group think pseudo-science. The cilmategate emails revealed corruption among a cabal of insiders with regard to controlling what was published.
http://online.wsj.com/article/SB10001424052748704075604575356611173414140.html
Menzie, Jeremy has a point. Moreover, what does it say re: a blogger recommending citing only “peer reviewed” literature? Finally, your updated “peer reviewed”, simple model-based graphic conveniently stops short of the 1997-1998 el Nino warm event which is both natural and its impact discussed in this thread and “peer reviewed” literature.
You might have missed my comment re: Marcott which included a quote from the “peer reviewed” abstract and then later included a Marcott quote admitting that the end point, final 60 year period, his study was not “robust”. The problem? Most of the PR and much of his conclusion re: unprecedented warming concerned the final 60 year period.
The ending arguments provided by Jan and I were indeed centered upon the quality of a “peer reviewed” paper with quotes. In the “peer reviewed” world a paper refuting or adjusting the findings may actually be in the works, but not yet accepted. Or, just as likely, already rejected due to the reasons provided by Jeremy.
CoRev, at August 24, 2013 04:14 AM, wrote:
You just keep repeating the strawman argument, which you have copied from McIntyre and to which I already replied on August 23, 2013, at 06:54 AM, in the paragraph starting with, “And the issue with the lack of robustness of the uptick in the part of the reconstruction for the last century is just a strawman argument by McIntyre…”, and on August 23, 2013, at 11:24 AM starting with, “It’s really not so relevant whether Marcott et al., “admitted” that the uptick in the 20th century wasn’t robust…”.
What would AGW “skeptics” be without their fantasies about an omnipotent global conspiracy that allegedly created and maintains the “global warming hoax/scam”, which they need to keep their belief system whole, being as much in contradiction to what most of the published climate science says?
In my comment at August 24, 2013 06:52 AM, what the first paragraph is, was supposed to be a blockquote of what CoRev said. I messed it up with a typo in the html-blockquote command.
Jan P Perlwitz: Formatting fixed now.
Jan, a strawman argument is: ” A straw man or straw person, also known in the UK as an Aunt Sally,[1][2] is a type of argument and is an informal fallacy based on misrepresentation of an opponent’s position.[3]” If Marcott admits his last 60Yrs of data are not robust, then his position is not misrepresented. I have quoted his own admission. You, on the Other hand just assert: “Of course, the usual suspects “trashed” it like AGW deniers trash any results from scientific research they don’t like because those results are in contradiction to the AGW deniers’ belief system, using made up assertions.” The only made up assertion is yours.
What is a strawman argument is the attention to McIntyre who actually reviewed the paper, and to which you seem to find more fault than Marcott. A strange position to take.
You have denied much said by the skeptics with your unsupported opinion, name calling and strawman arguments. It wasn’t skeptics who made the statements in the Climategate emails. The skeptics just took the email comments as evidence and confirmation. Denying the actual messages or even the interpretations is just another of your straw man arguments.
I see you chose to ignore the alternative wording for the Marcott claim. 75% cooler or 25% of temps were warmer. Yup! Agreed! The reconstruction did not add much new knowledge to existing interpretation of temps during the period studied. Still, you referenced it.
Pot meet kettle. Better trolls, please.
Jan,
Did you read the cilmategate emails? None of the hockey shtick team denies they are real. There is no need for skeptics to fabricate conspiracy theories when the facts are available.
Are you denying that there was an effort by influential insider climate scientists to control what was published in peer reviewed literature (as evident in their emails between each other)?
You are the one with the grand fantasy. Your fantasy is that CAGW is real and that the work you do is extremely important to the entire future of mankind and that the massive taxpayer funding stream for your research should know no bounds.
Skeptics beg to differ. Enough damage has already been done through needless waste of public funds and onerous (to poor in particular) policies that have escalated energy and food prices to counter a non issue.
CoRev, at August 24, 2013 10:31 AM, wrote:
Yes, and this is exactly what you do. You misrepresent the position in the Marcott et al., paper by claiming that Marcott et al., base their conclusions in the paper on the (non-robust) uptick of the last 100 years in their reconstruction. This misrepresentation is the pretext for you to declare the conclusions as supposedly invalid. However, Marcott et al. don’t do and don’t say what you assert with your strawman argument. Instead, they use the instrumental temperature record for the comparison between the temperature change of the last 100 years with the Holocene temperature distribution. They don’t use the uptick in their reconstruction for this.
I don’t even believe that you have read the paper yourself. I suspect you just blindly believe what McIntyre tells you, because it’s what you want to believe.
Their “admission” that the uptick was not robust is not relevant for the issue that you misrepresent the content of the paper with respect to on what they base their conclusions. Marcott et al., can easily afford to “admit” that, since their conclusions are not based on the uptick in their reconstruction.
If so why your need to spread lies about the paper, then?
Jan, you are hilarious. The paper says: “Current global temperatures of the past decade have not yet exceeded peak interglacial values but are warmer than during ~75% of the Holocene temperature history.” (From the paper’s abstract.)”
You admit: ” Instead, they use the instrumental temperature record for the comparison between the temperature change of the last 100 years with the Holocene temperature distribution. They don’t use the uptick in their reconstruction for this.”
Exactly! They used a low resolution multi-proxy time series for the handle and a high resolution temperature time series for the blade. That’s a change in process. If they had used a consistent approach throughout the temp record would have resulted in a single point and averaged ~0.4C.
Worse after all that wheel spinning they compared that “peak” in the temp record, and the3 best the got was a comparison that it was still lower than ~25% of the Holocene peak temps.
Why did you reference this study? Oh yes, “The current global temperature is near (less than 25% of those temps) the upper boundary of the temperature variability of the entire Holocene…”
Jan,
If as you claim, the authors themselves don’t trust the hockey stick blade uptick portion of the graph, why are is Marcott et al making such a big deal of their claim that current temperatures are warmer than at any time in the last 4000 years, or that the rate of temperature increase is totally unprecedented?
You are being obtuse or possibly disingenuous to claim that CoRev is misrepresenting things.
On the contrary, it is you who is misrepresenting things.
Changing core dates in order to remove negative data points and resulting in a huge alarming hockey stick uptick out of their remaing temperature proxies is either incompetence or dishonesty.
Why do you defend them?
CoRev, at August 24, 2013 02:37 PM, wrote:
You have failed with your strawman argument, and now you just switch the assertion. It is obvious that you haven’t read the paper, that you don’t know what you are talking about, and that you just continue to copy your nonsense from McIntyre’s opinion blog, since you don’t even know about what comparison in the conclusions of the Marcott et al. paper I have been talking.
Jan, actually I have read the paper. Clarify the exact wording in the conclusion that you thin I have not covered. Rate of change 20th century record), current peak (20th century record) warmer/cooler than 75/25% of Holocene temps, they use the (20th century) instrumental temperature record for the comparison between the temperature change of the last 100 years (20th century record) with the Holocene temperature distribution. or some obscure point in the conclusions for which you are playing hide the pea.
This is Marcott’s description on RealClimate post-release/printing:
Q: What do paleotemperature reconstructions show about the temperature of the last 100 years?
A: Our global paleotemperature reconstruction includes a so-called “uptick” in temperatures during the 20th-century. However, in the paper we make the point that this particular feature is of shorter duration than the inherent smoothing in our statistical averaging procedure, and that it is based on only a few available paleo-reconstructions of the type we used. Thus, the 20th century portion of our paleotemperature stack is not statistically robust, cannot be considered representative of global temperature changes, and therefore is not the basis of any of our conclusions.
So, they append the unsmoothed temperature record comparing the peak. If they had used their normal process for the 20th century temperature record the conclusions would have been different.
Different enough that ethical writers like Andy Revkin, would have revised their original reporting. Oh wait! He did. Because he realized the Marcott chart should have looked like this: http://3.bp.blogspot.com/-USBwfGhd5oM/UVjxNw-cO0I/AAAAAAAACk4/xUGDLM2V5Aw/s640/marcott2.jpg
As I commented at the beginning, this paper was either withdrawn or trashed. ou seem to be arguing against all those scientists and writers who trashed it.
CoRev, at August 24, 2013 06:40 PM,
You could easily have derived the statements in the first paragraph from what I said here, except the “cooler” than “25%”. This is your own invention. Marcott et al. don’t say this.
You write:
Just to be clear. You are claiming here that Marcott et al., appended the high resolution instrumental temperature record at the low resolution proxy data, and then they derived the Holocene temperature reconstruction and distribution from the combined data. Right? I also refer here to your comment at August 24, 2013 02:37 PM, the paragraph that starts with “Exactly! …, which states something similar.
If this is what you are claiming, where exactly do Marcott et al. say this in their paper that this was their procedure? Or who told you that? Where did you get that from? I didn’t say such a thing.
And again. An assertion about someone who allegedly said/revised/realized something without any shred of proof of source (actually two sources would be required here) provided by you for your assertion.
How is some link to some dubious, unknown source supposed to prove what some Andy Revkin (who is Andy Revkin? Do I have to know this person?) supposedly “realized”?
What “chart” from the Marcott et al. paper is this excactly, which has been modified here? Please be more specific. There are numerous graphics in the paper and its supplement.
As far as I can see this is just Marcott et al.’s Holocene temperature reconstruction, derived from the proxy data, but with the non-robust uptick at the end erased (overlaid with some other data in the graphic for comparison). How is this supposed to show that Marcott et al.’s conclusions don’t follow anymore now? This was your previous strawman argument, according to which their conclusions were based on this (in the graphic under the link removed) uptick. But since they aren’t, nothing follows from the removal of the uptick in the modified graphic, regarding their conclusions.
Jan,
I suppose you do not agree with this
http://www.prnewswire.com/news-releases/climate-science-exploited-for-political-agenda-according-to-journal-of-american-physicians-and-surgeons-221474241.html
then again Turkeys are not likely to vote for Christmas!
Jeremy has provided a nice lesson in projection for us.
…………
Association of American Physicians and Surgeons
From Wikipedia, the free encyclopedia
The Association of American Physicians and Surgeons (AAPS) is a politically conservative non-profit association founded in 1943 to “fight socialized medicine and to fight the government takeover of medicine.”[1][2] The group was reported to have approximately 4,000 members in 2005, and 3,000 in 2011.[1][3] Notable members include Ron Paul and John Cooksey;[4] the executive director is Jane Orient, a member of the Oregon Institute of Science and Medicine.
…AAPS also publishes the Journal of American Physicians and Surgeons (formerly known as the Medical Sentinel). The Journal is not indexed by mainstream scientific databases such as the Web of Science or MEDLINE.[6] The quality and scientific validity of articles published in the Journal has been criticized by others. Many of the political and scientific viewpoints advocated by AAPS are considered extreme or dubious by other medical groups.[1]
Ottnot,
In your mind, the AAPS is presumably the kind of Flat Earth Society that President Obama was referring to.
“We don’t have time for a meeting of the Flat Earth Society.”
– President Barack Obama, June 25, 2013.
and Richard Lindzen, Alfred P. Sloan Professor of Meteorology at the Massachusetts Institute of Technology, would be?
Lonely.
http://globalchange.mit.edu/research/publications/990
He’s a very capable scientist, but none of his science-based arguments against the existence of and danger of anthropogenic global warming have panned out.
Ottnot, are you really comparing the predictions of Lindzen against the projections of a MIT model? A model???? Really?
AR5 is about to be issued and many already expect it to be toast: http://hockeyschtick.blogspot.com/2013/08/why-forthcoming-un-ipcc-report-is.html (get by the self referencing and read the papers from which they are created.)
And just recently a set of new papers have been issued concerning ENSO as the climate control knob, http://www.cgd.ucar.edu/cas/Staff/Fasullo/my_pubs/Meehl2011etalNCC.pdf , http://www.nature.com/nature/journal/vaop/ncurrent/full/nature12534.html (pay walled), and this latest http://www.scirp.org/journal/PaperInformation.aspx?PaperID=27382
As for economics related to CO2 mitigation we have this explanation: http://www.youtube.com/watch?feature=player_embedded&v=Zw5Lda06iK0#t=4
Jeremy at August 29, 2013 11:26 AM asked:
A sad example for what can happen when you, as a scientist, have lost the scientific argument in those venues where the rigorous scientific argument counts, and when you subordinate science and truth under your political views? Then you can end up writing nonsense and falsehoods in opinion journals of political advocacy groups for people to whom you can sell crap because they want to believe it?
I see. After CoRev bailed, when his falsehoods regarding the Marcott et al., paper had become too obvious and some time has passed, he has started a new round of propaganda now.
This time he claims,
Well, if this is claimed by the hockeyschtick-blog, it must be right. Really. This is the kind of sources, on which CoRev bases is assertions.
His assertion about the new papers to which he links,
is simply a misrepresentation of these papers. All these papers deal with short-term climate variability. None of the first two papers claims that ENSO was “the climate control knob”. The third one phrases it as speculative guess. None of the results in these papers are in contradiction to AGW. In contrary, they help with understanding of unforced short-term temperature variability, which overlays the multi-decadal warming trend caused by anthropogenic greenhouse gases.
How is ENSO, as a quasi-cyclical phenomenon, supposed to explain this global temperature trend over the last century:
http://data.giss.nasa.gov/gistemp/graphs_v3/Fig.A2.gif
The sea surface temperature is not an external climate driver. Instead it is just a dependent variable. Unless ENSO generates energy out of nothing, it can’t drive the long-term global warming trend for the reason of the conservation of energy.
“Lindzen clearly relishes the role of naysayer. He’ll even expound on how weakly lung cancer is linked to cigarette smoking.”
http://www.thedailybeast.com/newsweek/2001/07/22/the-truth-about-global-warming.html
Jan, I see you are still at the game of argument by assertion: “After CoRev bailed, when his falsehoods regarding the Marcott et al., paper.” Bailed???? Are we not now supposed to leave town to places with reduced connectivity? Tsk, tsk.
AR5 will be officially released very soon, and the fire storm it raises will be a wonder to behold. The early/leaked releases of AR5 have been interesting. If the 95% claim is included as it has been leaked it will be quite a climb down.
Your concern over control knob is enlightening as it shows the ACO2 control knob to be wrong.
What is funny is the insistence that: “All these papers deal with short-term climate variability.”, and then you show us the GISS graphi, ~1% of the current interglacial, as proof of the last century being long term? Here’s Alley’s look at Greenland as an example of long term: http://jonova.s3.amazonaws.com/graphs/lappi/gisp-last-10000-new.png (I use the artful rendering of Alley GISP2) or this graph of Hadcru4 http://woodfortrees.org/plot/hadcrut4gl
You seem to be obsessed with my sources: “Well, if this is claimed by the hockeyschtick-blog, it must be right. Really. This is the kind of sources, on which CoRev bases is assertions.” and then argue the traditional strawman: “None of the results in these papers are in contradiction to AGW. Contradicts? None do. Nor do I. What is happening is the consensus ACO2 argument is failing Ole Mom Nature’s tests.
BTW, why did you conveniently ignore the video? This is an economics blog don’cha know, the economics of ACO2 mitigation is kinda important. Do you agree with the math?
Jan, you also closed your comment to me with this: “Unless ENSO generates energy out of nothing, it can’t drive the long-term global warming trend for the reason of the conservation of energy.” That’s funny because it, generates energy out of nothing, is even more true for ACO2!
CoRev at September 3, 2013 10:27 AM, wrote:
That’s what you are asserting.
“quite a climb down”? How so? From where? Please explain.
I suppose your statement in the following comment, at September 3, 2013 11:12 AM, is related to that. You say there:
So, this means you belong to the subset of AGW-“skeptics” who even deny the reality itself of any greenhouse effect by radiatively active gases in an atmosphere.
The warming effect by greenhouse gases, such as CO2, in the atmosphere is as little in contradiction to energy conservation as the warming effect of a coat on a body in winter, by reducing the energy loss from the body to the environment, is in contradiction to energy conservation. Greenhouse gases, such as CO2, don’t generate energy, and no explanation given by science says or implies they did. Instead, they redistribute energy by absorption and re-emission of longwave radiation. And the mere presence of the greenhouse gases doesn’t cause any warming trend. The increase in the amount of greenhouse gases does, e.g., caused by anthropogenic emissions, everything else equal, as long as there is a perturbation in the radiation balance due to increased longwave back-radiation, at the expense of longwave radiation that leaves the system to space. Due to this perturbation, there is a difference between incoming and outgoing radiation, the system receives more energy from the sun than it loses to space. This additionally available energy warms the oceans, land, and troposphere (there is an anti-greenhouse effect due to an energy deficit in the stratosphere, leading to stratospheric cooling at the same time) until the outgoing radiation is equal to the incoming radiation on average again. There isn’t any violation of conservation of energy there.
Back to the other comment by you.
You are resorting to arguing about semantics here, not about content. My comparison was to the time scale on which the ENSO induced variability of the global temperature is relatively large. If it makes you happy, call it “longer term” or “less short-term” instead. Of course, since 1880 is not long-term compared to geological time scales. But, why are 10,000 years supposed to be long-term, then? One equally could say is also just short-term, in comparison to hundreds of million years or some billions of years of Earth’s geological history.
I don’t understand why the temperature record of HadCRUT4 since 1850 is supposed to be an example for “long-term”, according to you, if GISTEMP since 1880 wasn’t. What is it about the difference of 30 years?
As for the GISP2-temperature record:
I noticed that AGW-“skeptics” like to present this graph, often to support their assertion or suggestion that there had been much warmer periods in human pre-history and history, compared to present day global temperature.
The graph doesn’t allow this conclusion for two reasons:
1. It is the temperature record of only one location, it’s not a global temperature record. The variability at one location is neither representative for the timing, nor for the magnitude of temperature anomalies at all the other locations on the planet, or the variability of the globally averaged temperature.
2. The GISP2 temperature record ends at the year 1855. The legend of the x-axis in the graphic is false. The warming period in the following 150 years is not shown in the graph. I don’t know why the a small part near the end of the curve in the graphic is drawn as a red line. I suspect to falsely suggest the recent warming was small compared to the preceding temperature variability, although the graphic doesn’t contain the time period, when the recent warming occured. I am not surprised that jonova shows such a misleading graphic.
You seem to think that one can back up an assertion merely by quoting someone else who makes the same assertion. It’s still just an opinion and assertion. Why don’t you just quote your own assertions as “evidence” for the correctness of your assertions, then? There is no difference between this and what you do here.
Is this a fact? And what “consensus ACO2 argument” stated where (proof of source, please) would that be, specifically, which failed “Nature’s test”?
Sorry. I don’t even bother to lock at any youtube video clips that are presented by you and allegedly prove something, whatever it is. I am interested in peer reviewed scientific studies.
Corrigendum of the last paragraph of my comment at September 3, 2013 02:13 PM. It should say, “Sorry. I don’t even bother to look …”
Jan, you assert: “So, this means you belong to the subset of AGW-“skeptics” who even deny the reality itself of any greenhouse effect by radiatively active gases in an atmosphere.” Even another strawman! Tsk, tsk.
Please tell us how ACO2 “ generates energy. Oh, never mind, I see you realized how silly was your argument: “Greenhouse gases, such as CO2, don’t generate energy, and no explanation given by science says or implies they did.” So why the strawman argument about ENSO generating it?
And then you add: “Instead, they redistribute energy by absorption and re-emission of longwave radiation.” But still you can not believe the same is possible with the seas/oceans? Better tell Trenberth who is searching for that lost energy.
Adding even another assertion: “My comparison was to the time scale on which the ENSO induced variability of the global temperature is relatively large.” After saying this: “How is ENSO, as a quasi-cyclical phenomenon, supposed to explain this global temperature trend over the last century”
and this
“The sea surface temperature is not an external climate driver.”
Using external is even another strawman. You obviously do not deny the impact of ENSO on temps? To do so is to deny the impact of the “cherry picked” (who was it that made the claim?) 1997-8 start date on current temps.
You then feign ignorance of the importance of adding that 30 years, 1/2of PDO cycle, to the temp record.
Finally, you make some snide assertions about skeptics and GISP2: “…suggestion that there had been much warmer periods in human pre-history and history, compared to present day global temperature.” And, voila, we’ve gone full circle right back to Marcott et al 2013, who did make that point in their conclusion. Remember that 75% number of cooler temperatures you focused upon while ignoring the remaining 25% of warmer temperatures which averaged warmer than the current peak temperature.
Perhaps Dr Lindzen lost all the scientific arguments because those opposing him refuse to listen to scientific reasoning, especially where kudos, taxpayer funding and large departmental budgets were all predicated on the presumed dangers of man-made warming.
The sad fact is that Dr Richard Lindzen has been proven absolutely right in his ability to predict future global warming whilst the proponents of dangerous man-made warming have all been wrong.
http://www.thegwpf.org/right-richard-lindzens-23-year-forecast/
Dr. Lindzen was, however, completely and naively wrong about one thing, 23 years ago he stated, “It seems to me that if science doesn’t have integrity, it isn’t of much use to people.” Of course the fool did not begin to comprehend how much money and how many careers could be built upon the great global warming swindle!
CoRev at September 3, 2013 04:30 PM, wrote:
A strawman? You are the one who claimed “That’s funny because it, generates energy out of nothing, is even more true for ACO2!”.
In the quoted statement, you make an assertion about facts, according to which the physical explanation for the greenhouse gas effect by CO2 was in violation of the conservation of energy. Thus, you deny the reality of the greenhouse gas effect of CO2 in the atmosphere, or you want to claim now, a physical explanation that allows a violation of the conservation of energy was allowed, if both this claim and your “strawman” accusation are supposed to be true at the same time. Well, another possibility is that you want to claim that only the physical explanation for the effect of greenhouse gases that come from anthropogenic emissions was in violation of the conservation of energy, but the explanation for the effect of greenhouse gases from natural sources wasn’t. Or, the last possibility: You have to withdraw your assertion regarding the physical explanation that is given for the effect of greenhouse gases. Your “strawman”-accusation would still not be true, since you said what you said to what I replied.
I did not say that ENSO generates energy out of nothing. I say, unless ENSO generates energy out of nothing, explaining global warming with ENSO can’t be correct. If you think explaining global warming with ENSO was not in violation of the conservation of energy, just give me a physical explanation how the quasi-cyclical ENSO, or El Nino, as the positive phase of the quasi-cyclic sea surface temperature variability, coming with from West to East moving Kelvin waves in the equatorial Pacific could cause a secular global ocean warming trend. Does the ocean in the ENSO region just continue to heat up without external energy input? Or where does the energy needed for this warming trend come from?
ENSO variability can explain the quasi-cyclical release of energy from the oceans to the atmosphere, and, in turn, a large part of the tropospheric temperature variability, a large part of the up and downs of the global tropospheric temperature on the time scale of the ENSO phenomenon.
But to explain global warming, you have to explain the longer-term trend,
http://data.giss.nasa.gov/gistemp/graphs_v3/Fig.A2.gif
and to explain this you foremost have to give a physical explanation for this:
http://www.nodc.noaa.gov/OC5/3M_HEAT_CONTENT/index.html
The longer-term global ocean warming trend itself, which has continued also after the year 2000. Claiming the ocean warming was caused by El Nino is meaningless. It explains ocean warming with ocean warming. It’s a tautological explanation. The energy for the ocean warming has to come from somewhere else. You need a cause, which is external to the oceans that delivers the surplus energy for the continuing warming. Unless you want to claim ENSO generates energy out of nothing, causing the ocean warming. If you reject the perturbation in the radiation balance from increasing greenhouse gases in the atmosphere as external driver for the ocean warming, what could it be instead? Perhaps an invisible pink alien space ship hiding in the depths of the oceans, releasing all this energy. It still would be an external driver of the change, though.
I said I don’t understand your claim that GISTEMP, starting at the year 1880, was “short-term”, whereas the surface temperature record of HadCRUT4 was supposedly an example for “long-term” (equally to the 10,000 years of the GISP2 temperatures), according to you. Your reply here doesn’t make any sense. What is the importance of that 30 years was half of the length of a “PDO-cycle” for declaring one as “short-term”, but the other one as “long-term”?
Your suggestion here that the Marcott et al., did the same in their paper as AGW-“skeptics” do with the GISP2 temperature record is just another falsehood by you. Marcott et al. don’t use the temperature record of only one location to reconstruct the Holocene global temperature record and to draw their conclusions from it.
I said, conclusions from the Marcott et al, paper are that present day global (surface) temperatures are near the upper boundary (which I rephrased later more precisely to upper third) of the Holocene temperatures (they moved from the lowest 5% within only a century), and with each of the non-mitigation warming scenarios, the global temperature will reach values at the end of the century human civilization has never experienced. An increase by about only 2 to 3 deg. C of the global temperatures would move climate to conditions that were prevalent during the Pliocene about 3 million years ago, beyond the global temperatures of any time during the Holocene. What is your point?
Jeremy, at September 3, 2013 06:24 PM, wrote:
And which one was the supposedly correct prediction by Lindzen about future global warming, specifically? This one?
“I personally feel that the likelihood over the next century of greenhouse warming reaching magnitudes comparable to natural variability seems small.”
Yes, of course, he has been right with this “prediction”. Earth has neither become a molten rock, nor has it become a frozen snowball. It’s easy to be right with such a kind of “prediction”. No one else, though, has seriously claimed that climate change/global warming, induced by human activities, would exceed this range of natural variability in this century.
Jan, I will not debate your strawmen arguments. You go ahead and stay in those rabbit holes of your own making.
As I expected you did go back to the Marcott et al 2013 paper. You finally admit that the paper does show today cooler than 25-30% their studied and smoothed temperatures.
Jan,
Thank you, very few proponents of man-made dangerous global warming will admit that whatever small effect (everyone agrees there must be some small effect) is far far below that of natural variability.
My hat off to you, Sir! Another convert to skepticism about the “exaggerated catastrophic dangers” of man-made global warming (note nobody seriously doubts that man has some infinitesimally small effect)!
The inescapable conclusion is that the man-made global warming component of climate variability is inconsequential. Perhaps it is time to worry about real issues that have impact to our planet or local environments, such as pollution from actual toxins rather than harmless CO2, or over-fishing etc ?
Jeremy, at September 4, 2013 06:38 AM, wrote:
You just demonstrate your own failure in logic in your comment. The fact that Earth hasn’t turned into a molten rock due to anthropogenic global warming does not allow the conclusion that global warming, caused by human activities, was small in magnitude compared to such natural variability that has occurred over the time period of human history, or that it was inconsequential for human civilization.
I am bewildered. There is no reasoning with you. Did you attend the Al Gore school of climate science?
“the interior of the earth is extremely hot, several million degrees”
– Al Gore Nov 12th, 2009.
“Would there be hurricanes and floods and droughts without man-made global warming? Of course. But they’re stronger now. The extreme events are more extreme. The hurricane scale used to be 1-5 and now they’re adding a 6”
– Al Gore Aug 21st, 2013.
If not from Al Gore where does your extreme hyperbole about molten rock come from?
Are you not aware that the entire measured instrumental Global Warming (since 1850) is less than a degree? A mere fraction of a degree is the context of the scientific discussion about climate variability in the age of fossil fuels, not molten rock, Category 6 Hurricanes or Earth’s core temperatures at millions of degrees (all these claims are intended to be scary but are complete and utter nonsense and unrelated to the discussion).
Jan, at September 4, 2013 07:47 PM, wrote:
Hyperbole? Are you asserting Earth has never been a molten rock in its geological past some billion years ago? Perhaps, you should attend a geophysics school instead, then.
I did not reference to what Al Gore allegedly said. “Al Gore Nov 12th, 2009” etc. is not a proper proof of source anyway. And a fragment of a quote, without knowing the context where the quote is from, is quite meaningless. My reference point was the quote by Lindzen, which was praised here as a supposedly correct “prediction”.
You are just confirming my point, which you obviously did not understand, that making a “prediction” about the magnitude of global warming in this century relative to the magnitude of natural variability is meaningless, if no information is given what the reference time scale is of the natural variability. Lindzen’s supposedly correct “prediction” was meaningless, at least as it is quoted on the GWPF website. It’s easy to make a correct “prediction”, if one can arbitrarily define the reference frame of the “prediction” after the fact.
The global warming, largely induced by human activities, has reached a magnitude which is of about the magnitude of the whole Holocene temperature variability. Caused by continuing emission of greenhouse gases from anthropogenic sources, global near surface temperature will likely increase to values beyond the temperatures of the earlier period of the Holocene before any human civilization between about 5000 and 10000 years ago, which was the warmest period of the Holocene (the temperatures back then can largely be explained with the distribution of insolation due to the configuration of the Earth orbital parameters), by the end of this century, and global near surface temperature will be even more beyond what human civilization has ever experienced in its history. The likelihood for this will be even higher, if the ones prevail in society who say there wasn’t any need to limit greenhouse gas emissions into the atmosphere from human activities. Even if climate sensitivity was “only” about 2 deg. Kelvin for a CO2 doubling.
The increase in global temperature will still be smaller than the full range of natural variability that occurred over the whole geological past of Earth. It doesn’t follow it was inconsequential for human civilization.
So, why do you bring quotes, which are unrelated to the discussion here, then?
But I am curious. What is the exact source of Al Gore’s alleged quote “the interior of the earth is extremely hot, several million degrees”?
And since you claim Al Gore’s intention with his statement was to scare people. Of what? Of climbing into Earth’s core?
Strawman Perlman bites again!?!??? Give a reference for your unsupported assertions: “The global warming, largely induced by human activities, has reached a magnitude which is of about the magnitude of the whole Holocene temperature variability. Caused by continuing emission of greenhouse gases from anthropogenic sources, global near surface temperature will likely increase to values beyond the temperatures of the earlier period of the Holocene before any human civilization between about 5000 and 10000 years ago, which was the warmest period of the Holocene (the temperatures back then can largely be explained with the distribution of insolation due to the configuration of the Earth orbital parameters), by the end of this century, and global near surface temperature will be even more beyond what human civilization has ever experienced in its history.”
Really!? Just more assertions from dubious model outputs verified by unmeasurable proxies?
CoRev, at September 5, 2013 09:21 AM, wrote:
It looks like CoRev is losing her countenance, after having lost the arguments.
You demanding (and not even being polite) from someone else a reference for a claim exposes you as quite the hypocrite.
But you know the reference, since I already had provided it: Marcott et al., (2013), doi:10.1126/science.1228026
According to this study, global surface temperature has moved, within only a century, from the coldest 5% of the Holocene temperatures to at least the upper third (this is very conservative) of the Holocene temperature distribution. And global temperature will be very likely beyond the upper values of the Holocene temperature distribution at the end of this century for each of the IPCC AR4 non-mitigation warming scenarios.
An AGW denier is plainly dismissing any results from scientific research, she doesn’t like? What else is new? AGW deniers are the same to climate science as creationists are to the biological sciences.
Jan,
Al Gore made the millions of degrees statement during a TV interview. I prefer not to call this ignorance but attribute it to a deliberate strategy of hyperbole as nobody is that dumb. Same applies to category 6 hurricanes and your assertion that Dr Lindzen was referring to molten rock temperatures when he spoke if natural climate variability. Like Al Gore, you are no doubt smart and intelligent, and use hyperbole for effect in order to win arguments that cannot be supported by science, data or facts.
Jan Perlman, Marcott again?!?!??? And you still accept that comparing a current peak to a smoothed (all peaks and valleys removed) data set s science? A conclusion from that report using the above methodology even you admit is: “I said, conclusions from the Marcott et al, paper are that present day global (surface) temperatures are near the upper boundary (which I rephrased later more precisely to upper third) of the Holocene temperatures (they moved from the lowest 5% within only a century), and with each of the non-mitigation warming scenarios, the global temperature will reach values at the end of the century human civilization has never experienced.”
Round and round we go … You resort to name calling and strawmen argumentation relying on trashed papers. G’day to ya!
Jeremy at September 5, 2013 12:43 PM wrote:
I did not make such an assertion. But if you assert he did not refer to such an extreme range (between molten rock and snowball Earth) of the variability of conditions on Earth that occurred over her whole geological past, how would you know that? I said the quote with Lindzen’s “prediction” does not contain any information about the reference time scale of the natural variability to which the magnitude of anthropogenic greenhouse warming is compared. Thus, the time scale of the natural variability can be arbitrarily defined after the fact at the convenience of the AGW “skeptics”, making it appear that Lindzen’s “prediction” was correct in any way, whatever the actual magnitude of the greenhouse warming in this century is. Such a “prediction” is meaningless. Praising how correct Lindzen’s “prediction” was is just beating the propaganda drums.
Please quote one statement that I allegedly made, which cannot be supported by science, data, or facts.
CoRev at September 5, 2013 02:03 PM, wrote:
It’s obvious that you still haven’t read the Marcott et al.-paper. And all you have to offer against it are smear and lies, copied from some dubious sources or made up by yourself. Smearing scientific studies, or the authors of the studies, because the results of the studies are not liked, is the MO of AGW deniers.
And what is it with my name? I post my comments under my real name. Are you trying to insult me by addressing me using a distortion of my name, while you are hiding in anonymity? The behavior of a coward.
Jan says, “Please quote one statement that I allegedly made, which cannot be supported by science, data, or facts.”
Jan you are foolish because that is all too easy to do. I do do not allege anything, I simply quote your own statement above verbatim.
Jan, at September 4, 2013 07:47 PM, wrote:. “The global warming, largely induced by human activities, has reached a magnitude which is of about the magnitude of the whole Holocene temperature variability.”
Ok to prove this is false we must admittedly resort to proxies but it is widely accepted that temperatures looked something like this graph from Wikipedia.
http://en.wikipedia.org/wiki/File:Holocene_Temperature_Variations.png
You can easily see that proxies vary by about 2 to 2.5 degrees (some even higher). Even the average (thick black line) varies by 1.8 degrees. So quite clearly the facts do NOT support your contention even if you were to make the ridiculous assumption that ALL temperature variations since 1900 are now man-made and all temperature variation prior to 1900 was all natural. 0.8 degrees is not the same magnitude as 2 to 2.5 degrees. In a historical perspective and looking at the raw rather than averaged data, 0.8 degrees in a century is pretty much ho-hum ordinary natural variation.
Now you allege that global warming is “largely induced by human activities”. Please show how you know this – provide source, facts please?
Jeremy, at September 5, 2013 04:38 PM, wrote:
The graphic you show does not show the variation of the global surface temperature during the Holocene. These curves are all only local proxies, eight all together, and the black curve is just the average of the eight proxies. You can’t logically or empirically refute my statement with that. My statement was about the global surface temperature. There is no question about that the magnitude of variability was (much) larger at single locations, compared to the magnitude of variability of the globally averaged temperature.
I referenced the scientific study, based on which I made my statement about the global temperature. A common way in science to describe variability is by using the frequency distribution of a variable. The temperature frequency distribution adjusted for high frequency variability in the Marcott et al., study (in Figure 3) is the basis for my statement. According to this, global temperature moved from the coldest 5% of this distribution to above the 70th percentile of the distribution within only a century, and it will take only a few tenths of a degree more to be above the 95th percentile. This will likely be reached within the next three to four decades.
My statement is based on the results of a peer reviewed scientific study, published in Science. Thus, you can’t validly claim my statement wasn’t based on science.
I know you dismiss this study, You can do this with whatever bogus claim you want, which you copy from some dubious sources, it’s still just opinion and assertion.
The studies who deal with this in climate science are called attribution studies. The IPCC Report 2007 has a whole chapter on this (Chapter 9), where the scientific studies on this topic are compiled.
This subsection is about the role of greenhouse gases for the temperature increase since the beginning of last century:
http://www.ipcc.ch/publications_and_data/ar4/wg1/en/ch9s9-4-1-4.html
and the scientific references in there.
Menzie Chinn also provided a reference on this topic (Kaufmann et al, 2006) in his article above.
It is virtually certain that the new IPCC Report, which is going to be published soon, will provide an updated compilation and synthesis of the scientific studies on the attribution of climate change.
Jan P, what is your point? You have made much of a trashed study, Marcott et al, which finds nothing significant. But, you make much of the difference in the temperature record from the LIA to today rising up to the ~70% percentile.
Any thinking person would say Thank you Mom Nature, but in your own hubris want to take credit for man kind’s role.
Even you have admitted that the current peak temperatures are still below the range of your referenced study. When we point up the “so what” nature of your excitement mongering claims we get a wealth of strawmen arguments, name calling and personal attacks.
Menzie, as Jan has referenced, your chart is just another example ff this mole hill expansion approach to attribution.
We are in a warming era coming out of a cooler one. The current warming is justified and not unprecedented, as Marcott shows us. To make it otherwise is the basic issue with climate model-based claims, which have proven to be wrong when compared to reality.
What climate science is now struggling with is the current 15-16+ year hiatus in warming that was not anticipated. If this pause changes to cooling, some say it already has, the current man-based hypothesis will need dramatic change. Many are recognizing this hiatus, and beginning to study the causes, which CAN NOT be due to ACO2! Recent “peer reviewed” studies have dramatically reduce CO2 sensitivity.
In science there are always a few hanger-on to the old hypothesis. Much of what we see today is represented with the change in climate views.
Jan,
You are now just waving your arms. The facts refute your statements. There is no “global temperature” in the past so we MUST use proxies – for you to turn around and say that proxies are not valid means that your entire premiss is invalid (comparing modern thermometer high resolution data to historical proxies is extremely dubious, I agree – the discredited “IPCC hockey stick” was crafted that way). There is no “global temperature” measured today because we have so few stations and many are concentrated in built up areas with high density populations, airports and concrete everywhere.
Finally referencing the IPCC (a political body) just shows your true colors. The IPCC has absolutely ZERO scientific credibility although it is quite an ineffective political boondogle for some lucky apparatchiks.
Jeremy, at September 6, 2013 06:51 AM, wrote:
Please read again what I wrote. I did not say what you claim here I supposedly said. I say that you can’t simply take a proxy data set of a single location and assert that the variability of the temperature at this location, derived from this proxy data set, was representative for the variability of the global temperature. And the same is valid for present day instrumental temperature measurements.
There are two requirements that need to be fulfilled to derive statements about the global temperature variability from proxy data. 1. The spatial and time coverage of the proxy data sets needs to be sufficient so that a meaningful approximation of global temperature variability can be derived. 2. One needs a proper methodology for combining all the different proxy data sets for a reconstruction of the global temperature variability. Both was done with the Marcott et al.-study.
Yeah, well. Just another of the AGW “skeptic” talking points.
My “true colors”? Which ones would that be? ROTFL.
The IPCC Reports are high quality scientific review documents. The new IPCC Report is being authored by more than 800 scientists from all over the world, who are experts in their fields of scientific research.
I didn’t have any doubt that you were going to dismiss the IPCC report, though, and all the scientific references in there, which present results from scientific research you don’t want to hear. However, AGW deniers declaring the IPCC report as being without “scientific credibility” is totally inconsequential and of no relevance for me (or any of my colleagues, or, I am pretty sure about that, most of the members of the community of climate scientists) whatsoever.
Jan
(I didn’t realize this thread was still active.)
Why should we believe the predictions in AR5?
Here are predictions from a 1995 NY Times article summarizing the predictions of IPCC AR2, 19 years ago:http://www.nytimes.com/1995/09/18/world/scientists-say-earth-s-warming-could-set-off-wide-disruptions.html?pagewanted=3&src=pm
*Only 6 more years of east coast beaches-fail.
At the most likely rate of rise, some experts say, most of the beaches on the East Coast of the United States would be gone in 25 years.
*An increase in drought, heat waves, fires and floods-fail. In some regions – fail.
The intergovernmental panel forecasts an increase in droughts like the current one in the Northeastern United States, heat waves like the one in Chicago this summer, and more fires and floods in some regions.
*Shrinking snow cover in NH – fail.
A “striking” retreat of mountain glaciers around the world, accompanied in the Northern Hemisphere by a shrinking snow cover in winter.
*Expanding deserts – fail.
Deserts are expected to expand
Pure random chance suggests the models will get some predictions correct. However, “some” does not meet the criteria for model-based policy decisions.
Is there any other branch of science where so many failed predictions are ignored, models diverge from reality yet the theory remains little changed?
We were told 100% of the modern warming is caused by man based on an ensemble of CMIP models that are quickly diverging from reality.
Now we are told the divergence between models and reality is temporary. Trust us, ignore our failed predictions of climate catastrophe in the past.
You promote the results of flawed climate models and results that remove any hope for cheap energy for 2 billion people living in squalor.
You ignore the fact that the IPCC minimizes and hides studies that contradict its CAGW agenda.
You say trust the models for policy. The same models that rely on a CO2 senstivity parameter you used above, (but couldn’t justify its value).
You support climate policy that is destroying industries, destroying jobs and destroying lives because the models that made incorrect predctions in the past, should suddenly be trusted (even though they are quickly diverging from reality).
The Oz elections are over and the party (Labor/liberals) proposing/implementing the extreme anti-carbon taxes was thrown out of office. That’s Gilliard and Rudd gone. Here is a link to the current results. http://www.abc.net.au/news/abcnews24/
Anyone doubt that public opinion has turned against the Global Warming meme. When the last hangers-on are isolated it will go away, and that is nigh.
Anyone wonder why the US/Democrat Cap & Trade Bill failed????
What we have seen in the above comments is a series of comments from those hangers-on.
tj at September 6, 2013 10:39 AM wrote:
Why should you believe what scientific experts based on their research and knowledge say? You don’t have to. If 97 out of 100 neurologists told you that you probably have a brain tumor, why should you believe them? They still could be wrong. So, you do the scientific research yourself, or you have to find some other criterion for yourself to decide when to believe something what the experts in a field tell you. Layman’s dilemma.
As for the allegedly failed predictions from the IPCC report 1995:
You are asserting the IPCC report 1995 made such a prediction. Your assertion is a falsehood. There is no such prediction in the IPCC report 1995. If you claim otherwise, please name the volume and the page of the IPCC report were such a prediction was made. You find the volumes for the IPCC report 1995 (large pdf files!) on this page of the IPCC website:
http://www.ipcc.ch/publications_and_data/publications_and_data_reports.shtml
The NYT articles doesn’t refer to the report for this statement. Instead the article refers to some unspecific experts who supposedly said this. Or, perhaps, such a statement was in the draft, since the NYT article refers to the draft? I don’t see it in the final report.
You assert here, the IPCC report 1995 made a prediction for the time period 1995 to 2013 about an increase of drought, heat waves, fires and floods. Your assertion is a falsehood. There is no such prediction in the IPCC report for this time period. Insofar there are statements in the report about likely developments in the future, like increased extremes, due to human induced climate change, they are usually for a time period more far out, mostly for around year 2100, or for 2050 (in vol. II of the IPCC report 1995).
On the other hand, it’s not that there weren’t any trends visible yet, in any of the variables. For instance, the probability of heat waves has increased globally in recent decades, as shown with the study by Hansen et al., PNAS (2012), already referenced by Menzie Chinn above.
Again, the assertion that the IPCC Report made such a prediction for the time period 1995 to 2013 is a falsehood. The projection, e.g., in vol. II, page 243 of decreased seasonal snow, permafrost, glacier, and periglacial belts is for 2050.
Again, a falsehood. There isn’t any such prediction in the IPCC report 1995, not for the time period 1995 to 2013, not even for the year 2050 or 2100. Here, the NYT article is partially to blame. Section 3 (page 159ff) and section 4 (page 171ff) in part II of volume II of the IPCC report 1995 deal with deserts and desertification. Compare the nuanced presentation of the topic in these two sections in the IPCC report back then, including the description of uncertainties and lack of knowledge regarding causes of desertification and impact of climate change with the false claim above.
In summary, your assertions about the allegedly failed prediction in the IPCC report 1995 is just a collection of falsehoods and misrepresentations. Then, those are used by you as the pretext for your opinions, (false) assertions, and judgmental statements in the rest of your comment.
I very much doubt that your assertions here about the IPCC report 1995, using the NYT article, come from you. What about you reveal the source where you copied that from? Do you AGW “skeptics” ever do any fact checking? Or are you really these blind believers, as which you display yourself regularly, in anything you read in [insert your favorite] AGW denier blog, as long as it confirms your preconceived views and your politically/ideologically motivated rejection of results from scientific research?
CoRev at September 7, 2013 05:44 AM, wrote:
The last “hangers-on” like about 97% of the scientists who actually research and publish in the field?
Public opinion goes up and down (regarding anthropogenically induced climate change usually with the weather). Public opinion does not decide about the validity of scientific theories. Almost 50% of US-Americans follow the superstitious belief in the biblical narrative of creation of humans. It doesn’t change anything about the validity of the scientific theory of evolution.
How are you going to suppress the publication of results from research on climate change in the scientific literature, which you don’t like? How are you going to prevent that the scientists inform the public about this research? How are you going to prevent that the scientists influence the children with knowledge about science in general, and the human induced climate change in particular? I am afraid there is nothing you can do about it in a democratic society where there is freedom of academic research, education, and freedom of opinion.
Jan, I see you just can not let that sleeping strawman lie. Your strawman: “The last “hangers-on” like about 97% of the scientists who actually research and publish in the field?”
Really????? You previously cited a trashed Marcott study, now I can only presume you are citing an even worse Cook, Nuccitelli study, or is Oreskes? Regardless, both are trashed. Bet you didn’t know Cooks latest attempt to publish his 97% study in a real journal was rejected.
Suppressing the science? Only the “Ream” has been doing that. Refer to the Climategate emails.
Jan,
Keep Digging!
The 97% consensus papers/meme has been demonstrated to be false. Benefit of the doubt says those that came up with these nonsense numbers were simply incompetent. Reality is that this was probably knowingly derived fraudulently in order to deceive.
As for IPCC, you really need to read an investigative journalist’s book titled “The Delinquent Teenager Who Was Mistaken for the World’s Top Climate Expert” by Donna Lafromboise. It contains facts that are all researched and referenced.This expose, by an investigative journalist, is the product of two years of research. Its conclusion: almost nothing we’ve been told about the IPCC is true.
Open your eyes to the total lies, deceit and fabrication that is modern catastrophic man-made global warming “science”. You make an analogy to religious superstitious beliefs without realizing that catastrophic man-made global warming is just such a superstitious belief – totally unfounded.
Jeremy at September 9, 2013 07:38 PM defames scientists, using libelous assertions:
How would you know that? Because Anthony Watts or whoever your favorite AGW denialist Internet blogger is told you so? It’s good to be anonymous, when smearing scientists, right?
The explanations from physics climate scientists have provided for anthropogenically induced global warming can’t be superstition, because superstition requires the believe in supernatural forces.
And what exactly is the cabal that is supposedly behind this omnipotent global conspiracy about which you fantasize, that has got in line thousands of climate scientists from all over the world, so that they have systematically forged data and falsified results in scientific studies for decades now, that has got control over all the specialist journals in the field that publish the studies, that has usurped all the major scientific institutions and academies all over the world, that has got control over many governments etc., and that is powerful enough to make certain no whistleblower has come forward yet, exposing this evil conspiracy? You are mighty delusional to believe in such a conspiracy.
Jan, in your quest for the “true” science, I suppose you missed this paper: http://link.springer.com/article/10.1007/s11191-013-9647-9 Climate Consensus and ‘Misinformation’: A Rejoinder to Agnotology, Scientific Consensus, and the Teaching and Learning of Climate Change
Peer reviewed, published, and a good answer to what is today called science. Climate extremism is becoming a comedy show.BTW, in addition to Oz, we can Norway to those rejecting the “progressive” climate agenda, and there is talk Germany may also be added to the list. Climate extremism is in its death throes. Except for the remaining hangers-on who continue to toe the progressive story line.
The dogs bark, but the caravan of science goes on.
Jan,
Thank you for the link, I went back to 1990 summary for policy makers to find some expert predictions.
Sea Level Rise 5mm/year through 2030. Fail! Overestimated by 40% per year.
Working Group I which, for a ‘business-as-usual’ scenario (scenario A in Working
Group I Report) has estimated the magnitude
of sea-level rise at about 20 cm by 2030.
http://www.ipcc.ch/ipccreports/far/wg_II/ipcc_far_wg_II_spm.pdf
http://cdiac.ornl.gov/trends/sea_level.html
Fail! CO2 has increased 12% in 23 years, or about .5% per year. It will take 200 years to double at that rate! Okay, call it 100 if the ‘assumed’ rate of increase rises (doubtful).
(i)an effective doubling of C02 in the atmosphere between now and 2025 to 2050 for a ‘business-as-usual’ scenario;
Fail! 1990 anomaly = 0.50. 2012 anomaly=.75 so the average global temp has increased by 0.25C from the baseline in 22 years. or about 0.11C per year. At that rate it will take 132 years to reach the IPCC prediction of 1.5C and 400 years to reach 4.0C to 5.0C.
(ii) a consequent increase of global mean temperature in the range of 1.5°C to 4°-5°C;
http://www.ipcc.ch/ipccreports/far/wg_II/ipcc_far_wg_II_spm.pdf
If 97 out of 100 neurologists told you that you probably have a brain tumor, why should you believe them?
Basically, 97/100 say I have a brain tumor, but 70/97 say it is benign and inoperable.
I’ll leave it to you to look through the more recent IPCC reports to find other failed predictions. I’m not sure why you think the science is settled now and the predictions are accurate now, when history tells us that new crop of predictions will be shown to be failures.
Why should be use the IPCC biased report to craft U.S. policy? It’s insane!