Still waiting for large, economy-wide job increases from the “shale revolution”
From Goldman Sachs, “Is the Economy Gaining “Fracktion?”” (not online):
There is little evidence of significant “induced” employment growth in downstream manufacturing industries. Similarly, cap-ex in energy intensive sectors that might be expected to benefit most from the shale boom has not outperformed cap-ex in other sectors during the recovery, although it did decline by less during the recession.
On top of fears that the surge in unconventional oil and natural gas will not be enduring [1] [2] [3], there remains some doubt that the development of fracking will be the game-changer that many have claimed – at least with respect to macroeconomics. (Prominent studies include IHS (2012), McKinsey (2013).)
Below I turn first to a discussion of employment growth in core oil and gas extraction. Then I discuss the extent (or non-extent) of spillover effects to the rest of the economy.
The impact on Oil and Gas Sector Employment
It’s clear that employment has increased dramatically in recent years.
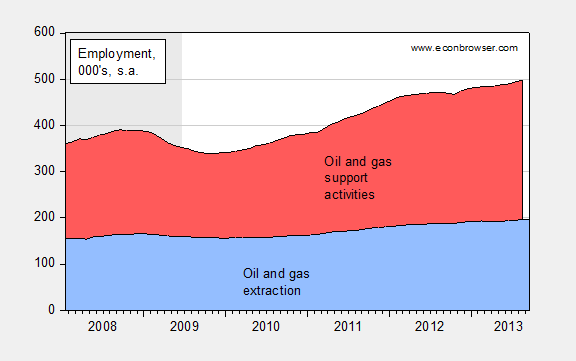
Figure 1: Employment in oil and gas extraction, seasonally adjusted, and employment in oil and gas support activities (blue). NBER defined recession dates shaded gray. Source: BLS via FRED.
From 2005M01, employment in gas and oil extraction rose by 72,200, and in gas and oil support by 165,600 (through August). From 2010M01, the figures are 41,500 and 95,700, respectively.
It’s important, however, to recall the context. This sector accounts for a very small portion of total nonfarm payroll employment. This point is highlighted in Figure 2.
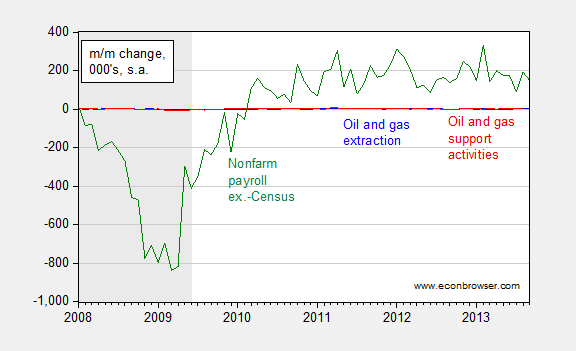
Figure 2: Month-on-month change in employment in oil and gas extraction (blue), in oil and gas support activities (red), and in nonfarm payroll employment ex.-Census (green), all seasonally adjusted. NBER defined recession dates shaded gray. Source: BLS via FRED.
The impact on GDP growth is estimated by Goldman Sachs to be 0.10 ppts in 2013.
Broader Impacts
It might be expected that the resulting decrease in natural gas prices will result in lower production prices, either through lower energy prices (GS sees little impact thus far) or lower feedstock prices. Certainly gas costs in the US are lower than overseas (oil prices will remain tied to overseas, see here).
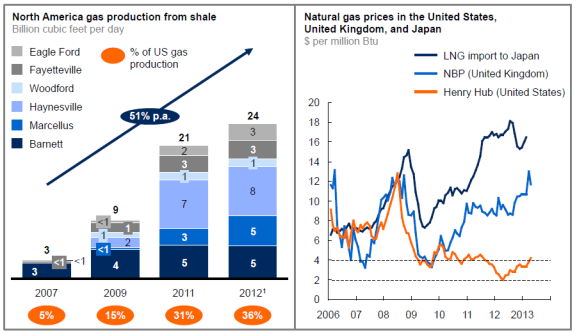
Exhibit E4 from McKinsey Global Institute, “Game changers: Five opportunities for US growth and renewal,” July 2013.
As Goldman Sachs notes:
A core narrative in the US manufacturing renaissance theme is that low energy prices will directly support growth in downstream manufacturing industries. In past research we found scant evidence of a structural renaissance in US manufacturing in the incoming data―whether due to energy cost advantages, rising productivity, subdued labor costs, or other factors … we now look at employment outcomes in downstream industries in particular.
We define these downstream manufacturing industries relatively broadly, including the chemical, plastic and rubber products, and primary metal manufacturing industries. As shown in Exhibit 4, employment in these industries has underperformed the overall US labor market.
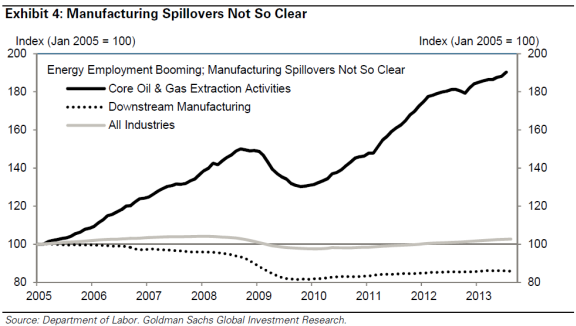
Exhibit 4 from K. Dawsey, D. Mericle, “Is the Economy Gaining “Fracktion?” US Economics Analyst 13/42, October 18, 2013 [not online].
What about stories of “re-shoring”, that is the return of manufacturing production to the US, as recounted in The Economist? Employment is indeed increasing in manufacturing, as is total output.
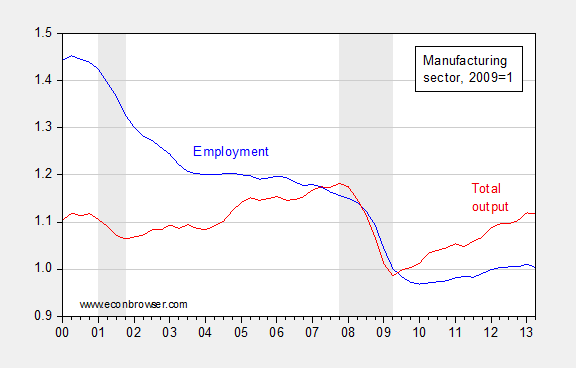
Figure 3: Manufacturing employment, seasonally adjusted (blue), and manufacturing output (red), both 2009=1. NBER defined recession dates shaded gray. Source: BLS via FRED, NBER, author’s calculations.
In addition, the share of manufacturing employment in total nonfarm payroll employment has stabilized, suggesting an arrest to the offshoring phenomenon (although the fact that manufacturing employment is more pro-cyclical than other components suggest that it’s just a suggestion).
Still, energy prices are only one factor in the calculations firms make. Rising labor costs overseas (particularly China), exchange rate changes, and — perhaps most importantly — the supply chain disruptions associated with the 2011 earthquake and tsunami might loom even larger than the differential in energy prices. Hence, the case for very large employment and output effects from the “shale revolution” remains to be made.
Last Thoughts
Perhaps the most nuanced assessment of what magnitudes of effects to expect comes from the IMF’s Article IV review of the US economy (Special Topics), pp. 27-28:
The [IMF Global Economic Model] simulation results suggest that the macroeconomic benefits for the United States
are positive, but may be modest. In a scenario with only production gains (and no efficiency improvements), the U.S. real GDP level gradually increases by about 0.3 percent over the next 10
years. In a scenario with both production increases and efficiency gains, the GDP level increases by 0.5–1 percent during the next decade. In the short run, the impact on GDP is largest when the boom
in energy production and efficiency are fully anticipated and the economy exhibits economic slack (and thus monetary policy does not need to lean against the resulting increase in aggregate
demand). The real exchange rate tends to appreciate and energy prices fall in all scenarios, helping to boost private consumption and investment. In the medium run, the U.S. current account balance
as a share of GDP deteriorates slightly, but the adjustment path is highly sensitive to assumptions about expectations and private saving behavior—the current account can either improve or
deteriorate.
Update, 11/6 10AM Pacific: Prakash Loungani has more thoughts on the matter here.
What I am waiting for is the technological revolution that should be swarming around cheap Nat gas prices. You see the public bus running on Nat gas but where are the cars? And generation plants? I think there is a belief that all this is going to end with a stroke of a pen so there is no flow through.
http://www.eia.gov/petroleum/drilling/pdf/dpr-full.pdf
a new report series on shale drilling productivity
I am “Still waiting for large, economy-wide job increases from the crony capitalism.” Those who are producing oil fight Liddite environmentalists, the rent seekers in government, extortion, and yes, crony capitalism. Goldman Sachs is the primary recepient of governemnt mega-millions. We have TARP and we get decline, we have Obama stimulus and we get decline, we have ZIRP and we get decline, we have quantitative easing and we get decline, but we have increased oil production where the US recovers its leadership role in production in the world and the producers are criticized because they have not offset all the previous errors. Once again we have an article on coorelation to prove causation.
Steven Kopits, perhaps you can give us a reasonable analysis rather than croney capitalist tripe.
As far as labor costs are concern, the American median “real wages” continue their post-1998 decline. http://america.aljazeera.com/articles/2013/11/4/median-wage-stagnationincomeinequality.html
Also noteworthy is the fact that the New York Times, Washington Post, WSJ, network news, cable news, and cable business news channels do not repor this story.
Ricardo indicated that despite the regional improvements in economy and employment from oil/gas exploration, the larger economy is suffering from policies that inhibit growth. This seems intuitively correct, but difficult to quantify.
Inflation is hardly a problem so costs should not be an issue. Competition for jobs should be intense so the direct cost of employing people should not be the main issue. The stock market has benefitted immensely from easy money supply, so increased personal wealth should be driving demand for products. So why is the economy so stagnant?
Perhaps Ricardo is touching on the problem that since it is far easier to be an importer than a manufacturer, fewer jobs are being created in the lower-middle class and economic mobility and growth is stifled. If it takes 100 people to manufacture and distribute a product and less than half to import and distribute, the “multiplier effect” is minimized.
You can go through all the mental gyrations you want, but simply compare the GDP growth of exporting countries [e.g., China and Germany] engaged in basic manufacturing versus the growth of importing countries. Eventually, U.S. energy exports may drive some wealth into our overall economy, but I’d guess [without supporting data] that employment required to produce $1 worth of energy product is less than required to produce $1 worth of manufactured product. So it is likely that energy production wealth will be more concentrated than manufacturing production wealth which usually relies on multiple layers of suppliers and distribution [e.g., automotive manufacturing].
The bills that really would have produced huge increases in employment and economic output–the 2010 and 2011 Natural Gas Acts–were filibustered by the Republicans.
The bills that really would have produced huge increases in employment and economic output–the 2010 and 2011 Natural Gas Acts–were filibustered by the Republicans.
Recent Global Annual Crude Oil Prices Versus Global Net Exports of Oil and Rising US Crude Oil Production
Recent Global Annual Crude Oil Prices
We have of course seen a cyclical pattern of higher annual highs and higher annual lows in global (Brent) crude oil prices in recent years, but I think that the rates of change between successive annual price lows, or troughs following annual oil price peaks, is very interesting.
Peak to Trough Annual Brent Crude Oil Prices, 1997 to 2013:
1997: $19
1998: $13
2000: $29
2001: $24 (1998 to 2001 rate of change: +20%/year)
2008: $97
2009: $62 (2001 to 2009 rate of change: +12%/year)
The 11 year 1998 to 2009 overall of change in trough prices was 14%/year. And then we have 2012 to 2013.
2012: $112
2013: $108 (Est. price)
Based on estimated price for 2013, the four year 2009 to 2013 rate of change in the trough price would be 14%/year ($62 to $108).
The long term 15 year 1998 to 2013 rate of change in trough prices would also be 14%/year ($13 to $108).
If the (+14%/year rate of change) pattern holds, and we were see a year over year decline in annual Brent crude oil prices in 2017, it would be down to an annual Brent price of about $190 in 2017.
Following is an an excerpt from a recent OECD study which forecasts sharply higher global crude oil demand (and potentially) much higher oil prices:
Source: http://www.financialsense.com/contributors/joseph-dancy/oecd-study-forecasts-sharply-higher-global-crude-oil-demand
Post-2005 Decline in Global and Available Net Exports of oil VS. Rising US Crude Oil Production
GNE/CNI* Vs. Annual Brent Crude Oil Prices for 2002 to 2012:
http://i1095.photobucket.com/albums/i475/westexas/Slide1_zps5f00c6e5.jpg
GNE/CNI Vs. Total Global Public Debt for 2002 to 2012:
http://i1095.photobucket.com/albums/i475/westexas/Slide2_zps01758231.jpg
GNE/CNI Decline Extrapolated to 2030:
http://i1095.photobucket.com/albums/i475/westexas/Slide1_zps9ff3e76d.jpg
*Definitions:
GNE = Combined net oil exports from (2005) Top 33 net oil exporters (total petroleum liquids + other liquids production, EIA)
CNI = Chindia’s Net Imports of oil (EIA)
ANE = Available Net Exports = GNE less CNI
A critically important point to remember is that the post-2005 decline in US oil consumption and the post-2008 strong increase in US crude oil production affected the demand for GNE and ANE, but rising US oil production had no effect on the supply of GNE and ANE.
ANE, the volume of Global Net Exports of oil available to importers other than China & India, fell from 41 mbpd (million barrels per day) in 2005 to 35 mbpd in 2012. At the 2005 to 2012 rate of decline in the GNE/CNI ratio, ANE would theoretically approach zero in about 17 years, theoretically leaving zero net oil exports available to about 155 net oil importing countries.
While currently rising US crude oil production has certainly contributed to keeping annual Brent crude oil prices on a plateau of about $110 for three years, something that is not widely understood is that the annual volume of oil lost to declining production from existing wells is almost certainly increasing at a rapid clip.
Citi Research puts the decline rate from existing US natural gas production at about 24%/year, which would require the industry to replace 100% of current natural gas production in about four years, in order to maintain a constant dry natural gas production rate of about 66 BCF/day.
Since the Shale Gas boom preceded the Shale Oil boom, it’s a plausible assumption that the decline rate from existing US crude oil production is headed in the direction of the current overall decline rate from existing US natural gas production, as an increasing percentage of total US crude oil production comes from high decline rate tight/shale plays.
Assuming an average production rate of 7.5 mbpd (million barrels per day) for 2013 and assuming a 10%/year decline rate from existing oil production, we would need to replace the productive equivalent of 100% of current US crude oil production over a 10 year period, everything from the Gulf of Mexico to Alaska, in order to maintain 7.5 mbpd.
If we assume that the the decline rate from existing US oil wells increases from about 10%/year in 2013 to 20%/year in 2023 (a more likely scenario in my opinion), we would need about 12 mbpd of new production in 10 years, in order to maintain 7.5 mbpd for 10 years. Under this scenario, the annual volume of oil production lost due to declining production would increase from 0.75 mbpd in 2013 to 1.5 mbpd in 2023.
To put 12 mbpd of new crude oil production on line would require the industry to put the productive equivalent of the peak production rate of 6 North Slopes of Alaska on line in 10 years, or we would need the equivalent of the peak production rate of the North Slope (about 2 mbpd) every 20 months or so.
While the current rebound in US crude oil production is very helpful on a number of fronts, especially in terms of the high paying jobs the boom has provided, in my opinion the tight/shale boom should be viewed as a way to help us transition to a less energy intensive economy, which is more reliant on electrified transportation, especially electrified rail.
The fundamental problem facing the US and other net oil importing countries is that we are–so far at least–gradually being forced out of the global market for exported oil, via price rationing, as developing countries consumed an increasing share of a post-2005 decline in Global Net Exports of oil. Meanwhile, developed net oil importing countries like the US continue to allocate trillions of dollars to deficit spending programs trying to keep their “Wants” based economies going, when the reality facing developed countries is that they are generally transitioning from “Wants” based economies to “Needs” based economies.
I wrote a little essay more than six years ago which you can find by searching for: ELP Plan. My basic advice in this essay was as follows: “Cut thy spending and get thee to the non-discretionary side of the economy.”
Billion dollar petrochemical facilities don’t pop up overnight. Goldman Sachs also believes that five to ten world class steam crackers (which are petrochemical facilities) will be built in the U.S. by the end of the decade.
So be patient, it is coming. Even though I guess to liberals five years is the ‘long run’ and we’ll all be dead by then, so why even incorporate things like this into your model, right?
A timely article:
The global economy sinks under its debts as the real cost of energy rises
Excerpt:
The flip-side of EROEI is the real cost of energy. The cost ratio at an EROEI of 37:1 in 1990 was 2.6 per cent, but this has risen to 6.8 per cent today. The global EROEI* may fall to 10:1 by 2020, increasing the energy cost “levy” on the economy to 9 per cent. In blithe ignorance of this increasing levy, we have continued to grow the claims value of the financial system on the assumption of perpetual growth. These “excess claims” show up as unsustainable debt, undeliverable welfare commitments, and unrealisable expectations for returns on investment. My calculations suggest that the system now owes $90 trillion (£55 trillion) more than it can deliver.
For individuals, this is being manifested in the escalating real costs of fuel, power, food, water and physical infrastructure. Globally, it is visible in “energy sprawl”, as the energy-delivering infrastructure expands (both in scale and in cost) in response to the weakening in efficiency resulting from a deteriorating EROEI. As well as crimping disposable incomes and destroying returns on investment, this process is curbing our ability to invest in other things.
The essential point is that the economy is not a monetary system governed by the theoretical “laws” of economics, but an energy dynamic determined by the all-too-real laws of thermodynamics. Once we understand this, the squeeze on household prosperity becomes far less of a mystery.
See more at: http://www.cityam.com/article/1382574713/global-economy-sinks-under-its-debts-real-cost-energy-rises#sthash.xhvdMM2u.dpuf
*Energy Return On Energy Invested
Here is another example of how we shoot ourselves in our feet economically:
“Since 1892, the Doe Run Resources Corporation has served as the country’s primary lead refinery. Located in Southeast Missouri, within the state’s Lead Belt, Doe Run has developed in the largest lead producer in the Western World. Ammunition manufactures like Federal and Lake City (which also service the U.S. Military) deliberately set-up shop in the region in order to be close to the raw materials.
Thanks to the EPA’s new clean air regulations, Doe Run has been forced to close its doors. The EPA calls the shutdown simply a “business decision,” however given the fact that it would have cost the company over $100 million to comply with the regulations, there really was no other alternative.
The results are staggering. Despite being the world’s third-largest producer of lead ore, U.S. mines are now forced to transport their 444,000 metric tons of lead ore abroad for it to be refined.”
fracking makes great headlines, but it is not the nationwide job maker some folks want it to be. and it may not be for quite some time. several large energy companies have sold out-even at a loss-their nat gas holdings because it is not profitable.
chris, the cost to update the infrastructure to nat gas is not cheap. and at this point, many folks who could work on the technology to make it happen, are not convinced nat gas is a long term solution. hence they will not invest in R&D which may not have a long term payoff.
renewables such as wind really do have a better long term prospect, in the public mind. it is basically an infinite resource-and becomes more economical as energy prices rise. which they will, either through inflation or supply-demand. storage and transmission issues are not as great as some folks indicate. you will probably see hydrogen storage and transmission mechanisms as a primary framework in the next decade or so-and wind fits right into this framework.
since i live in a fracking part of the country, i do see its effects first hand. and i see very little large investment in the area due to the belief the fracking era is temporary.
fracking is often located in remote areas, and basically serves as an extraction process of natural resources sent to other geographic locations. it is a finite resource, so once it is depleted, nothing remains to benefit that geographic location.
on the other hand, look at renewables such as wind. they can be found in locations of past industrial might. consider the great lakes, a vast source of fresh water wind available year round. this is a reliable and replenishable energy source located next to major manufacturing hubs such as detroit, cleveland and chicago. an investment in wind turbines in these areas produces 1) a renewable source of engergy (not finite), 2) a fixed cost of energy (tied basically to the initial construction cost), 3) certainty in availability (as opposed to a guestimate when a gas field becomes depleted), 4) certainty in energy cost for high energy consumption manufacturing and industrial processes-owning your own wind field eliminates the fluctuation of supply and demand-kind of like a 30 year mortgage on “rent”.
it seems to make sense for future investment in energy to focus on all possible sources-including nat gas, solar, coal, etc. but it also makes sense to identify which sources may provide the best synergy of energy source, cost, transmission and industrial use and effectiveness. renewables seem to make better long term sense than finite source energy such as nat gas. you cannot build permanent industrial infrastructure around a transient energy source.
Bruce Hall,
a quick google check shows that Doe Run is still in operation-it did not close. now there have been fines and cost for lead contamination which the company has paid, but the company is still closed. and the fines were for lead contamination.
maybe you would not mind living in the area of a lead mine and smelter, and exposing yourself and children to the extremely harmful effects of lead poisoning. but the laws on lead pollution are very clear-and they were violated. and the epa will not be responsible for the future closing of the company. that will result from the civil lawsuit filed by over 200 families for the resulting lead poisoning caused by the company’s pollution.
as you said “Here is another example of how we shoot ourselves in our feet economically”. i guess it all depends on whose foot is shot?
Brown,
You didn’t provide a searchable citation to the Citi report, so I cannot verify that data. However, the most recent EIA data shows that the ratio of new well productivity/legacy declines is increasing, not decreasing, especially with regard to the largest new shale gas production area–the Marcellus–
http://www.eia.gov/petroleum/drilling/pdf/marcellus.pdff
Baffling:
The Doe Run smelter is “still in operation,” but it is scheduled to shut down in December. So, technically, you were able to say “gotcha.”
Yes, there are environmental concerns with that as well as oil/natural gas extraction/distribution/refining and with thousands of manufacturing facilities using hazardous materials. The “shooting ourselves in the foot” part is that we are so anxious to PENALIZE and RESTRICT and PERFECT that we find ourselves doing less and less.
We certainly should eliminate any manufacturing that uses lead in processes that melt it and vaporize it. Likewise, we should eliminate any manufacturing that use aromatic hydrocarbons or poisons or water or produces CO2 or anything else on the list of “we’re doomed” compounds.
That should leave organic farming… as long as animal excrement isn’t used for fertilizer.
bmz,
For areas showing increasing production, gas production from new wells would–by definition–outpace the declines from older wells.
However, the Citi Research report analyzed the overall decline rate in natural gas production from existing wells in the US. This would be the decline production from 2013 to 2014, if no new wells were completed in 2014.
As we have discussed before I think, virtually any grouping of shale play wells will show enormous declines over a multiyear period, e.g., the 2007 vintage wells completed by Chesapeake in the Barnett Shale Play, on the DFW Airport Lease. Chesapeake claimed that the DFW wells completed in 2007 would produce for at least 50 years. Five years later, production from the 2007 vintage wells is down by 95%, and about half of the 2007 wells have already been plugged and abandoned.
Note that all of the new gas production–from both dry and wet gas areas–put on line in the US since late 2011 has basically just served to keep us on an plateau of about 66 to 67 BCF/day (processed dry natural gas production, EIA).
So, first, here are a couple of articles of mine:
“Why the Oil Majors are Getting Hammered”,
http://blogs.platts.com/2013/11/05/carrying-price/
My piece is in response to comments made by Shell’s CFO, Simon Henry, here:
http://www.reuters.com/article/2013/10/31/shell-results-spending-idUSL5N0IL2IT20131031
My Alaska piece: Alaska at the Crossroads
http://www.ogj.com/articles/print/volume-111/issue-11/exploration-development/alaska-s-oil-crossroads-lucrative-ocs-prize-and-taps.html
As regards shale gas. I’m not sure that I found a huge economic effect from it. Clearly, it has been beneficial in parts of the country, and certainly has helped to keep power prices low.
Natural gas net imports have, however, fallen from 9.5 in 2006 to 3.5 bcf per day. Allowing for both price and volume effects, this reduces the US trade deficit by about $2 bn per month on a monthly deficit of $40 bn. So it is reducing the trade deficit by 2-3%. That’s important, but not necessarily earth-shattering.
The profitability of the industry is still not clear. Jim has written about this. At current prices, the Marcellus is workable; not clear anything else really is.
Coal-to-gas switching ended in Q3 2012 (a year ago). Since then we have seen gas-to-coal switching, believe it or not.
I have said, and continue to say, that natural gas prices at current levels are unsustainable. I believe that gas prices will rise to around $7 / mmbtu, with production rising another 9-12% or so. On paper, there are draws for an additional 20-30% of US production. I don’t think we get there.
So, shale gas is important. We’re still not sure of the final economics of the industry. The “bang for the buck” has already been felt, although downstream effects could last longer, as it takes time to build petrochem facilities.
Menzie, you don’t even attempt to posit a counterfactual outcome. Where would manufacturing employment and output be without the boom in gas production?
What you’ve done is no different than people who look at mediocre GDP and employment growth post-2009 and therefore argue that the ARRA had no effect. We both know that is a silly argument. Of course, reasonable people can disagree on what the counterfactual would have looked like, but without any counterfactual at all it’s hard to make a causal argument.
As an aside, I’m surprised you rely on Goldman Sachs’ analysis. Isn’t GS the poster child for the greedy 1%?
bruce, that was not meant to be a “gotcha”. fact is the company will still exist even in january. only one operation of many will close down. blaming the smelter closing on the epa is a bit disingenuous. yes there was a fine from the epa, but nothing compared to the $350 million lawsuit filed, and already $55 million settlement with some participants of the lawsuit. the smelter was a liability, and it absolutely was a business decision to shut it down.
i made no reference to shutting down manufacturing-simply follow the rules. you can still work with lead, simply apply the technology developed during the past 50 years which minimizes its impact on the surrounding environment. does that cost money and reduce margins? of course, but it can still be done-just for less profit. does that mean those beancounters feel they can make more from their capital elsewhere? maybe that is why the shop closed. but that simply creates an opportunity for some other up and coming entrepeneur to fill in the void. but the fact is, pollution does cost money-and the firm did not want to pay for it. unless you are in favor of allowing intentional lead poisoning.
Clear evidence of the effects from high energy costs, unprecedented private debt to GDP, and an echo bubble in real estate prices (yes, there IS an echo bubble):
https://app.box.com/s/xtb3537wm05e71jcajjz
https://app.box.com/s/5uqimmhg0ruydq69a20o
US household formation is collapsing, primarily because Millennials can no longer afford to form the typical urban/suburban/exurban household. Rents, house prices, and costs of vehicle ownership are too high as a share of after-tax and -debt service income of Millennials.
Boomer analysts who are bullish on US housing and associated growth of spending are erroneously extrapolating their own experience 30-40 years ago and since, whereas the income and financial condition of Millennials does not support a secular housing growth boom; quite the opposite.
The echo bubble in real estate prices (that few admit exists) is contributing significantly to the collapse in US household formation by Millennials.
Shale oil.
US oil production has increased by 64% since 2005 (all numbers used in this comment are July to Sept averages for the respective years). During that period, US net crude and product imports fell by 52%, representing a savings at current prices of $266 bn. At prices prevailing at the time, the savings are on the order of $400 bn. On a current trade deficit of about $40 bn / month, the impact is between 36-45% of what the trade deficit would have been otherwise. It’s a big deal.
US shale oil production took off in Q4 2011, just in the wake of the debt ceiling debate and after the previous April’s Arab Spring oil shock. US GDP growth accelerated at this time; the US and Japan went into recession, from which Europe is yet to emerge.
In the last two years, US oil production is up 1.9 mbpd, or 34%. This represents a value of $78 bn, or 0.5% of GDP currently. US imports fell by the same amount. The effect on the trade balance over this period would be a reduction of 15%, all other things equal.
US oil consumption is 9.4% less than the same period in 2005, 1.6% less than the same period in 2011. Thus, increasing US oil production prevented the need to reduce oil consumption as dramatically.
Without the increased oil production, US oil consumption would have had to fall more quickly. As we know that the US constitutes about 21% of global oil consumption, it would have had to cede 21% of increased US oil production through reduced consumption. This totals 400 kbpd (or 21% of 1.9 mbpd production growth from 2011).
Total US consumption would have fallen by 720 kbpd therefore, or about 3.8% over the two year period, rather than the 1.6% actually recorded. Assuming the efficiency gains would have been similar in both cases (I think a fair assumption), the impact on GDP would have been a bit over 1% per year (2.1% in total).
However, the impact is greater than this. The total value of increased oil production, as I noted above, was $78 bn per year. However, the incremental reduced consumption only has a value of $16 bn. Thus, another $62 bn of goods would not have been produced.
We can argue whether some other sector of the economy might have offset the loss of oil production, but I think it is unlikely, for several reasons. First, there is slack in the system. So resources are available for incremental activities. Oil production was not crowding out other activities.
Second, if you want to offset the trade deficit, then you have to export. But to whom? The advanced economies are in no shape to import more. On the other hand, it’s hard to export to China…unless you are exporting commodities, like oil.
So there is some reason to believe that, had the incremental oil not been produced, nothing else would have replaced it and that value would simply be lost to the economy.
Thus, we have to deduct the $62 bn from GDP, which is 0.4% over the period.
If I take the 2.1% GDP reduction from reduced oil consumption and the trade deficit of 0.4% over two years, the GDP impact is on the order of 1.2% per year.
Thus, the assertion that shale oil was responsible for the separation of the trend between the US and European economies after Q3 2011 seems justified, and indeed, appears to have saved the US from a possible recession.
Brown: “Note that all of the new gas production–from both dry and wet gas areas–put on line in the US since late 2011 has basically just served to keep us on an plateau of about 66 to 67 BCF/day (processed dry natural gas production)”
As Kopits said” At current prices, the Marcellus is workable; not clear anything else really is.” Production is currently being retarded by prices; $6.00 gas(which is still just a small fraction of BTU oil prices) would produce a “gusher” of production.
I appreciate the knowledgeable comments about the oil industry. Thank you, Steven Kopits and Jeffrey Brown.
I looked up Doe Resources. The State of Missouri sued them for violating environmental laws. This wasn’t a case of the feds imposing regulations but of a state trying to clean up its state given existing laws … which apparently, as I glanced through the documents, were repeatedly violated. The lawsuits were filed well over a decade ago. A jury awarded $358M in one case, a settlement of $55M for polluting land became public, and there have been others.
It was, in fact, lawsuits by citizens and the state that forced the EPA to enforce and then to tighten regulations. Not the other way around. In 1988, for example, they were fined for 177 health violations.
From the Post-Dispatch: “Decades ago, the smelter filled the air of the company town with particulate matter so heavy, it sometimes made it impossible to see even across the street.” And a local TV station has a graph showing the concentration of lead in kids around the plant. Even over a mile away, about ¼ had excessive lead.
So to blame the EPA is pure ignorance. This was a massively polluting business, run in violation of laws that existed then, and which has been sued for very large dollars by many, many people and government entities.
should read “Europe and Japan went into recession…”
Steven: “If I take the 2.1% GDP reduction from reduced oil consumption and the trade deficit of 0.4% over two years, the GDP impact is on the order of 1.2% per year.
Thus, the assertion that shale oil was responsible for the separation of the trend between the US and European economies after Q3 2011 seems justified, and indeed, appears to have saved the US from a possible recession.”
Steven, I suspect that is correct; however, the recession might be sneaking up on us since Q1 to date.
Moreover, one aspect of the so-called “Seneca effect” is that an exponential growth of consumption of resources peaks after which ~30% of proved resource reserves are extracted and consumed at an accelerating rate in order to keep the exponential growth trend going. The higher costs and less accessibility of the remaining reserves causes growth of extraction and consumption to again peak and then decelerate and collapse in a log-linear trajectory.
It is quite conceivable that we have been in the post-Seneca cliff and Red Queen race since ’09-’11 during which we are investing to produce as quickly as possible the most we can extract before structural demand constraints take hold and permanently reduce extraction and consumption thereafter.
The IHS view of the matter. I don’t put much credence in it.
http://press.ihs.com/press-release/economics/us-unconventional-oil-and-gas-revolution-increase-disposable-income-more-270
bmz,
Many things are possible, but even if, or more likely when IMO, that we see $6 natural gas, the industry will be facing two problems: (1) The overall decline rate (estimated by Citi at 24%/year) is much higher now than at the start of the shale boom and (2) It’s going to be interesting getting rigs out of the oil and wet gas plays in order to focus on dry natural gas plays.
In any case, the peak production rate from the Barnett Shale Play appears to have been 5.7 BCF/day in 2011/2012. Citi Research estimates that we need about 17 BCF/day of new production every year in order to just offset production declines.
So, in order to maintain current natural gas production, the industry would, based on Citi’s numbers, have to put on line the productive equivalent of the peak production rate of around 30 Barnett Shale Plays over the next 10 years.
An excerpt from the Citi report:
Aggregated detailed well production data (HPDI) for nearly 100% of total U.S. natural gas volumes reveals that almost 2/3s
of total current natural gas production is from wells drilled just in the past five years or since a host of shale plays really
began to alter the U.S. natural gas landscape.
Meanwhile, we would note that the overall U.S. natural gas production decline rate (Ex. Appalachia) accelerated in 2012
and averaged ~26% due to a higher ratio of new wells that came on line in 2011 and which posted high first-year decline
rates of ~50%. With fewer new wells brought on line last year, we expect decline rates to moderate to ~24 % in 2013 and
~23% in 2014 due to a lower proportion of new wells in the U.S. natural gas production mix.
Nevertheless, the ~23-24% decline rates imply that domestic natural gas production would need to grow by ~17 Bcf/d
annually just to offset natural declines and keep current production flat.
sherparick1: I too am disappointed by the lack of coverage of the stagnation in median wages, but the NYT has covered the issue; see [1], [2], [3], [4], [5], [6] …
As natural gas prices rise from here, the demand from the power sector will drop as areas with base loaded combined cycle plants and idle coal fired plants go back to coal. This will cushion us somewhat in coming out of the glut, since this can be done much faster than new gas can come online. The scale of this is much smaller than current gas consumption in the power sector, since much gas generation occurs in areas without idle coal plants (among other factors) and some coal generation is going out of service.
So the take-away from this analysis is that if we were to eliminate shale gas, the resulting spike in natural gas prices would have little impact on the U.S. economy?
Is that correct Stephen?
As a household that heats with natural gas, I find that difficult to believe.
I don’t think you have to hunt too hard for the indirect effects of the tight oil and gas boom. Just look at the increase in the gross value of oil and gas output. That’ll give you a pretty good rough number. It might not meet your definition of “game-changer” but it isn’t small.
tj: residential use made up only 16.4% of natural gas use in 2012. Most of the price you paid wasn’t gas price (avg residential price was 4X wellhead price in 2012). That residential price was 77% of the price in 2008, when wellhead prices were 3X higher. The main effect of the gas glut has been lower gas development, lower coal production, lower railroad utilization, lower coal power plant utilization, and deferred gas imports from Canada.
tj –
I have maintained that nat gas is more likely to provide headwinds than tailwinds for the economy from here on out.
I don’t anticipate too further share loss by nat gas from here on out. The coal-to-gas switching looks to have pretty fully reversed; meanwhile a good bit of coal capacity looks to be retired in the next few years. So I don’t think we’ll see too much nat gas volume reduction–more likely are price increases, I think.
Many of the monetary “experts” in the world are not taking the expanding use of the Chinese yuan seriously. Especially in the US, as monetary expandion continues to erode the value of the dollar in international trade, these experts keep saying that until the Chinese float their RMB on world currency markets, the yuan will not challenge the dollar.
What is being missed is that the yuan is already challenging the dollar. The Chinese are not going the traditional monetarist-Keynesian route of floating the yuan. They are taking the fight directly to the traders and traders are listening. But to get news on this you have to move outside the US financial press.
The Vancouver Sun
France24
Ricardo, the net trade flows between China and the countries with which China is using the Yuan for payments is tiny as a share of total net trade and US$ trade-weighted flows.
The US$’s value is much more dependent upon the net US supranationals’ FDI abroad, particularly in China-Asia, interest rate differentials and the net trade flows between the US and EU/Germany, and oil imports as a share of the US trade deficit.
US FDI growth to China-Asia has slowed significantly since ’07-’08 along with China’s exports to the US, interest rates have narrowed between the US and EU, and US oil imports are down, all of which will put a floor under the US$ (and ceiling over the euro) around the current level.
Were US FDI and trade to slow further with China-Asia (likely as global real GDP per capita flattens out), interest rate differentials narrow further (likely with decelerating price inflation), and US oil imports fall further because of falling US demand from no real GDP per capita growth, the US$ is more likely to strengthen (be less weak) than weaken further (famous last words).
However, the long-term trend is for all fiat currencies to trend towards par with one another as GDP PPP between the three major trading blocs trends towards and around parity.
“Still waiting for large, economy-wide job increases from the “shale revolution”
You misspelled “stimulus package.”
Bruce,
I don’t disagree with what you have written but consider that China was one of the weakest economic countries in the world in the 1980s. Today they are second to the US. With Chinese banks in London the Chinese will play a much stronger role in Europe and this will expand rapidly.
I am not at all saying that the dollar is doomed no matter what. Of course the monetary authorities could still save the dollar. The question is will they? The nomination of Janet Yellen does not bode well for monetary stability. She is a notorious monetary expansionist. Will she change her spots?
But that said China has grown faster than anyone in the 1980s and 1990s ever dreamed of. We must not lose sight of the fact that China’s growth is because they have adopted many supply side policies. Don’t forget the influence Robert Mundell has in China.
ricardo
“We must not lose sight of the fact that China’s growth is because they have adopted many supply side policies.”
i think you lack an understanding of china and supply side policies. care to expand on these supply side policies? perhaps the growth has something to do with moving half a billion people to the urban environment?
For U.S.
YTD (thru August 2013), natural gas purchased by power plants is still cheaper (due to the unwinding glut) than for any year in the past decade, except 2012. Coal purchased by powerplants is still more expensive than for any year in the past decade except 2011 and 2012. As of August there were still many places where gas was cheaper than coal on a per MWH basis (a negative black spread), which is a temporary condition given the production cost structure of these fuels, and is what causes some combined cycle gas plants to be dispatched before some coal plants. Coal consumption by power plants went down 25% from annual peak (that is likely an all time peak unless coal plant construction increases), but has only increased about 6% YTD (thru Aug). Most coal capacity has not been retired, although the coal fleet is slowly losing capacity.
Gas prices will continue to rise (a lot, but not as much or as quickly as if swing demand at gas power plants didn’t still exist to be reduced), coal prices will fall (but not as much as if exports weren’t occurring or coal power plant utilization weren’t rising again and not as quickly as if most coal sales and transportation were not via long term contract).
For 2013 YTD (thru Aug), net power production YOY dropped 1.1% or 29.4 million MWH(cooler summer and slow economic growth, note that 2012 was already the lowest year since the recession began except 2009). Net power production from natural gas dropped 13.1% or 113.8 million MWH (but was still 10.4% higher than the same period in 2011). Net power production from coal increased 6.1% or 61.1 million MWH but was still 11.9% lower than 2011. Net power production from “other renewables” increased 15% or 21.9 million MWH. The missing 1.4 million MWH is a confluence of other minor factors (nuclear, petroleum, hydro, etc).
I expect net power production from gas to be lower in 2014 than in 2013, partly due to a continuing swing back to coal dispatch in the face of higher gas prices. This assumes normal weather (production from hydro, heating demand, cooling demand). I expect 2014 full year net power production from coal to be higher than 2011 partly due to a continued swing back from gas dispatch, and partly due to slower growth in ‘other renewables’ in 2013 due to delayed renewal of wind subsidies (YTD thru September only 71MW of new windpower have been in serviced, compared to thousands of megawatts each of the past 5 years).
I am puzzled by this latest attempt to deny gravity. It is so well known that cheaper energy has a big influence on GDP and the overall economy that I really don’t know where to start. There are many papers that show a strong relationship between cheap oil (energy) and a booming economy and the nasty affects of an oil shock (high oil prices).
This kind of thinking (propaganda) is worthy of Pravda.
The impact of cheaper gas (shale revolution) has been severely limited by the lack of the ability to switch away from Oil for transportation. Gas is one fifth the price of Oil on a BTU energy measure but extra cheap gas is not readily consumed as you cannot use it to fill cars and trucks (not yet). HIgh oil prices are likely still having a dampening impact on the economy and have been doing so since 2005.
jeremy, this is not propaganda. the infrastructure for nat gas is not as well developed as oil based systems. this is why cheap gas does not translate into increased gdp. all energy sources are not equal. and people are debating, do i rebuild energy infrastructure for nat gas, or a renewable system (based on hydrogen and electric)? evidence suggests we are not investing in a nat gas infrastructure, and looking into the future of a renewable energy system.
Ricardo, China is the beneficiary of by now trillions of dollars of FDI from the US and Japan since the 1980s-90s. In the meantime, the US deindustrialized and financialized the US economy, resulting in unprecedented public and private debt to GDP, wages, profits, and gov’t receipts, and labor returns to GDP at the levels of the Great Depression.
Despite the surge in “oil” extraction since 2008-09, oil extraction per capita is still 50% below the peak in 1970, and down 40% per capita since the secondary peak in 1985. To get back to the 1970 peak of oil extraction per capita, US oil extraction would need to more than double by 2020 as it nearly has since 2008.
What price of oil will be required to double US extraction from here? $200? $250? $300? $400? We cannot grow US real GDP per capita since 2005-08 with the price of oil above $75-$80.
https://app.box.com/s/2wce3wtu43384fwto0ic
https://app.box.com/s/txig5u69mz0pbgsj3qn5
http://www.businessweek.com/articles/2013-10-31/global-trade-stalls-as-emerging-market-demand-drops
http://research.stlouisfed.org/fredgraph.png?g=o7k
http://research.stlouisfed.org/fredgraph.png?g=o7l
http://research.stlouisfed.org/fredgraph.png?g=o7n
http://research.stlouisfed.org/fredgraph.png?g=o7o
Now at least two-thirds of world real GDP and trade is at stall speed or contracting in real terms.
http://research.stlouisfed.org/fredgraph.png?g=o7p
http://research.stlouisfed.org/fredgraph.png?g=o7q
Would oil be $100 were it not for the hundreds of billions of dollars invested in offshoring to China-Asia by US supranational firms?
As for Yellen, she will do precisely what her bankster masters direct her to do, nothing more nor less. (She will get to choose the wallpaper for her office and what to have for lunch at the Fed cafeteria.)
bruce, your opinion of janet yellen is probably quite misguided. she will do what she believes necessary to keep the economy on a forward and not backward track. sometimes i wonder where all this anti-fed conspiracy theory originates?
baffling, no conspiracy apart from will to power and self-preservation by the wealthiest and most powerful top 0.01-0.1%.
The Fed Chairperson’s primary job is to run political cover for the Fed’s owners’ institutionalized license to steal via banks’ imputed compounding interest claims on wages, production, profits, and gov’t receipts in perpetuity.
The Fed Chairperson has no personal power apart from that which is conferred by the owners of the largest Fed member primary dealer banks (including foreign institutions), which in turn own the Fed and the federal gov’t that confers political institutional legitimacy on the private central bank.
While most certainly a pleasant, agreeable human being, like Bubble Ben, Yellen is a tool of the Anglo-American and European int’l banking syndicate, the owners and operators of which effectively own much of the wealth of the entire planet, be it directly or via principal claims on collateral by way of loans or indirect ownership of claims on borrowers’ revenues and profits.
Naive beliefs and demi-god worship are not sufficient justification to refute “conspiracy theories” nor the imperatives of the most powerful in the game of global realpolitik.
bruce, as i said before, conspiracy theories. look out for the guys in the black cars following you…
Maybe not nationwide gains, but certainly state and multi-state wide gains directly related to oil and gas activity.
http://bismarcktribune.com/bakken/number-of-north-dakota-millionaires-jumps/article_0f1ac9f4-5213-11e3-85f7-0019bb2963f4.html