Why bother with econometrics when revealed truth will do?
Reader Rick Stryker comments on my post on employment effects of the minimum wage:
When you look at the research, the elasticities of employment of young people with respect to the minimum wage are typically between -0.1 to -0.3. … Let’s take -0.2 as the central estimate [of the elasticity for young people with respect to the minimum wage]
If we compare to the CBO study, we see they get an estimate of 500K with an upper bound estimate of 1 million, which is a lot smaller than my back of the envelope. The reason for that is that CBO makes many downward adjustments to the published estimates. For example, they use an elasticity of -0.1 as their central estimate, based on their judgmental reading of which papers they believe are more accurate. They also claim there is publication bias and so adjust downward. And they also make a number of downward adjustments by trying to estimate the number of people affected, etc.
I don’t believe these non-transparent adjustments are very credible. …
Let’s take a look at where this supposed conventional wisdom lies in the context of the extant estimates, as reported by Hristos Doucouliagos and Tom D. Stanley, “Publication Selection Bias in Minimum-Wage Research? A Meta-Regression Analysis,” British Journal of Industrial Relations 47.2 (2009): 406-428. [ungated working paper version]. I illustrate where Rick Stryker’s preferred estimate lies in this familiar funnel graph, which plots 1/standard errors (1/se) of an estimate against the point estimate. Observations higher on the graph are more “precise”, as measured by the standard error of the estimate.
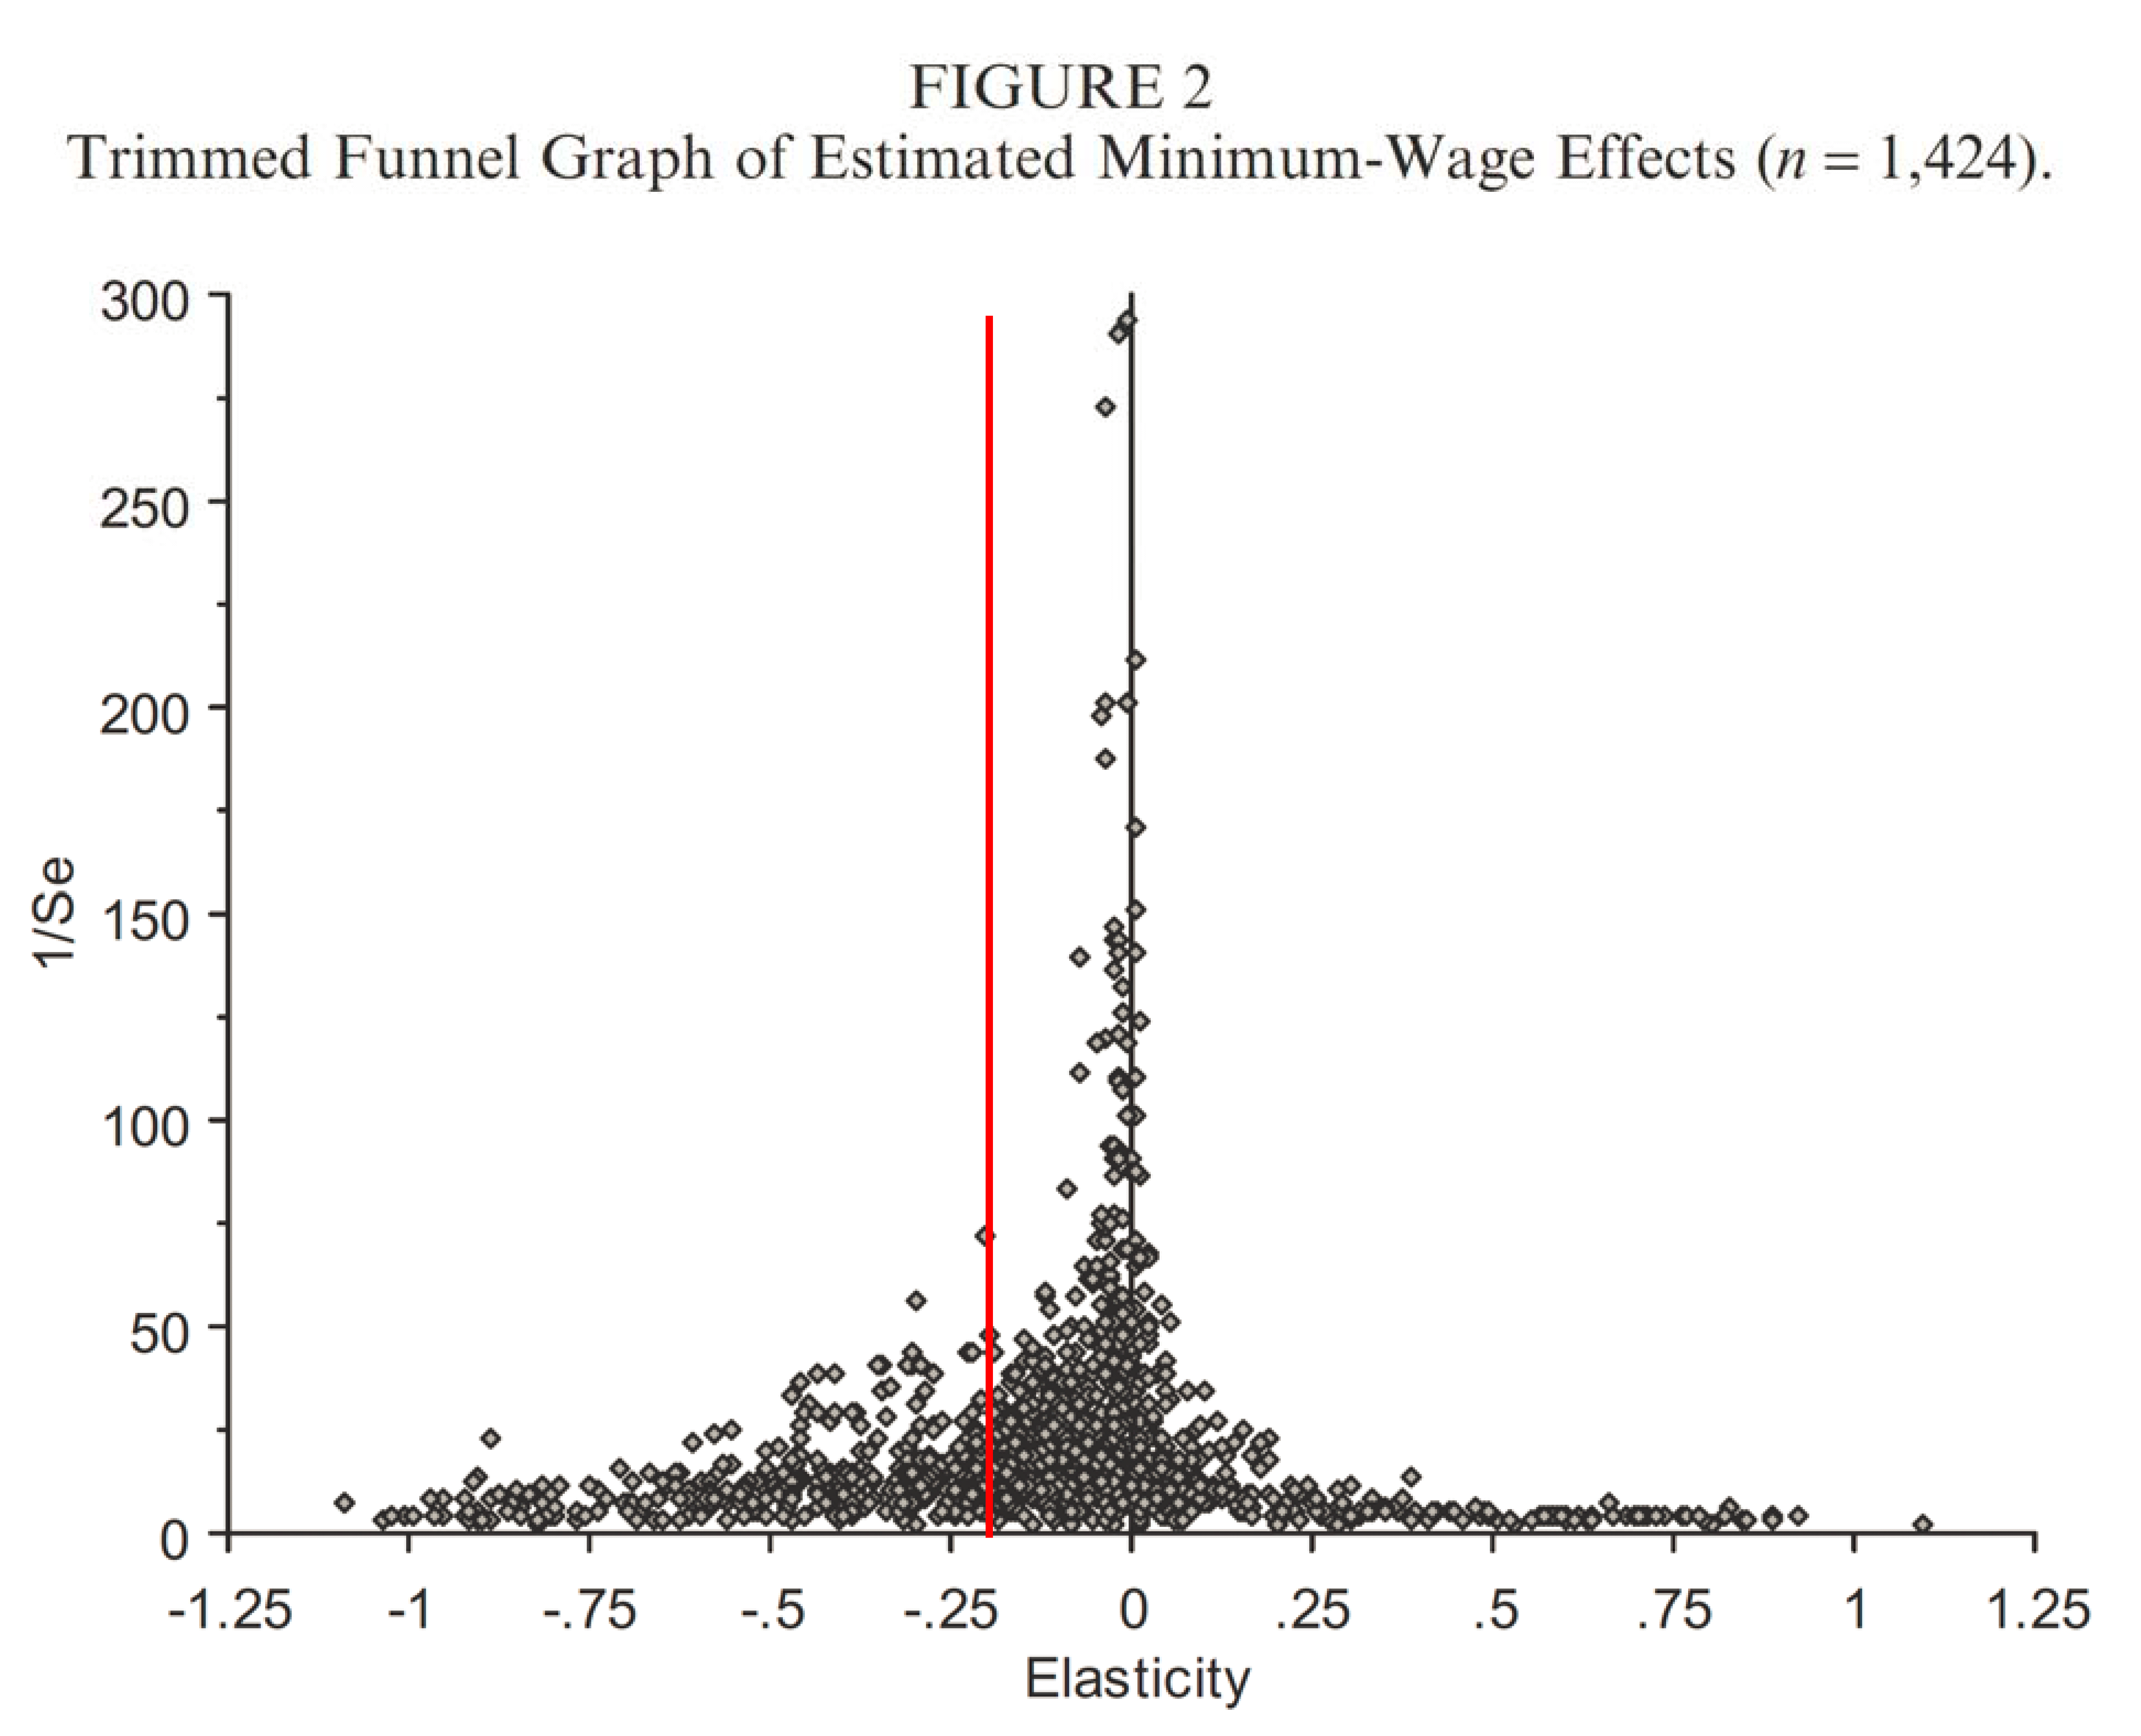
Figure 2 from Doucouliagos, Hristos, and Tom D. Stanley. “Publication Selection Bias in Minimum-Wage Research? A Meta-Regression Analysis.” British Journal of Industrial Relations 47.2 (2009): 406-428. [ungated working paper version], with red line drawn in at elasticity = -0.2.
I have drawn the red line at the reader’s preferred estimate of -0.2. Now it is true that these estimates in the funnel graph pertain to elasticities for differing groups — not all for young workers. Still, just looking at all these estimates, I would be tempted to focus on an elasticity of around -0.05, rather than -0.2 — but that’s just me. (I invite readers to vote by commenting, with explanation.)
By the way, if one is interested in the methodology of meta-studies, one of the authors of this paper, T.D. Stanley, has an article in the Journal of Economic Perspectives exactly on this subject: Stanley, Tom D. “Wheat from chaff: Meta-analysis as quantitative literature review.” Journal of economic perspectives (2001): 131-150.
So, for me, I think the assessment of small or zero impacts is the most reasonable (and I am willing to entertain positive impacts, especially in the short run when income effects are more plausible).
Update, 3/30 1:25PM Pacific: I strikes me that people might want to know what the result of the meta-analysis is for the point estimate. From the article:
The one difference between the best-set and the all-set MRA results is that the latter suggests the existence of a very small, but statistically significant, negative minimum-wage effect. A 10 per cent increase in the minimum wage reduces employment by about 0.10 per cent (see column 4 of Table 3). But even if this adverse employment effect were true, it would be of no practical relevance. An elasticity of -0.01 has no meaningful policy implications. If correct, the minimum wage could be doubled and cause only a 1 per cent decrease in teenage employment.
The best-set estimates range from -0.002 to -0.024, none of which are statistically significant (see Table 2).
Menzie,
I’m pretty surprised that you would post a funnel plot as evidence that the elasticity is near zero.
The funnel plot is not a model selection tool. It’s a diagnostic to detect publication bias. But you’ve used it to make the argument that estimates should be selected with the smallest standard error.
As you well know, that’s wrong, since the underlying models in the studies might be misspecified in some way. For example, if you omit a relevant regressor you bias the other estimates. If you have measurement error in the regressors that is correlated with the error term, the estimates are biased, even asymptotically. Small standard errors aren’t necessarily good if the estimator is biased. And uncorrected heteroskedasticity and serial correlation invalidates inference.
I could go and and on. But the point is that you have to look at each study and judge it. You can’t just pull out standard errors and make a plot.
No one has really done a serious meta study of the minimum wage literature that way it is supposed to be done. I already commented before on how the meta study you cited above does not meet the standard. Maybe somebody will do that one of these days. Meanwhile, we do have expert narrative review that indicates that elasticities are typically between -0.1 and -0.3, as I mentioned.
Rick Stryker: Thank you for your list of potential threats to unbiasedness in OLS estimations. I didn’t say that the estimates plotted were “best” estimates; that is why I was specific in noting the degree of precision, as measured by the standard error. If you look at a intro econometrics textbook (as it looks as you have, or at least the table of contents), then you know that precision-bias tradeoff is a key one. So you focus on bias, and appeal to authority in your “expert narrative”, but I think precision is important too. Moreover, the main point of the graph is to show the diversity of estimates and to highlight the fact that many of these big negative estimates are in fact imprecisely estimated. I didn’t say this was the be-all-or-end-all in graphs, but I think it was better than throwing out a preferred estimate and just saying “take-it-or-leave-it”.
Menzie,
No, you did more than use the funnel plot to show the range and precision of the estimates . If that’s all you were doing, I wouldn’t have objected. Rather, you used the funnel plot to “estimate” the elasticity at -.05. As you put it, “Still, just looking at all these estimates, I would be tempted to focus on an elasticity of around -0.05, rather than -0.2 — but that’s just me.” That’s what I objected to.
My point, which you seem to have missed, is that you can’t do the sort of estimate you did without first establishing that the studies aren’t misspecified in some way. But let’s assume for the sake of argument that every single study included in the Doucouliagos et al paper is fine. Your estimate is still wrong.
To get the -0.05 estimate, you’ve implicitly used the fixed effects estimator in meta analysis. The fixed effects estimator will weight each study’s estimate by the reciprocal of its variance. Since the variance is the square of the standard deviation, the fixed effects estimator will attribute most of the weight to studies that are just to the left of the zero line and throw everything else away. So, voila, -0.05.
However, to use the fixed effects estimator, you have to assume that all of the studies are measuring the same true parameter and the only variation between the estimates is due to sampling error. That’s almost never true in meta analysis and certainly not true in this case, since, as you put it: “Now it is true that these estimates in the funnel graph pertain to elasticities for differing groups — not all for young workers.” For the more general and realistic case in which the true effect size might differ between studies, it’s necessary to use the random effects estimator.
The random effects estimator considers the variance due to sampling error and the variance due to differences in the size of the effects. It estimates the mean of the effects by weighting each study estimate by the sum of the sampling error variance and the between-studies variance. The random effects estimator will not discount a study with lower precision as would fixed effects because that study contains information. Similarly, the random effects estimator will not overly credit a study with low standard errors.
If the estimate are widely dispersed, as they appear to be, that will increase the between studies variance. If that variance is large compared to the sampling error variance, then the weights will be approximately fixed and the weighted average will be approximately be the unconditional mean of the elasticities. According to the Doucouliagos et al paper, the average of the elasticities is -0.19, very close to my back of the envelope of -.2. Thus, the meta analysis estimate, assuming that all these studies are fine, should lie between -.05 and -.19.
Now I would note that you did not fairly characterize my back of the envelope calculation. I did start with -0.2, but then I took 50% of it for the >26 year old case. I also acknowledged that other adjustments should be made, and then took half of that number again to the get the estimate of about a 1 million. So, I didn’t really use -0.2 but something less in my back of the envelope of something a bit north of 1 million. That means I am somewhere in the range of -0.05 and -.19.
We can compare my back of the envelope to some other estimates. Neumark, writing in the Wall Street Journal in June of 2009, estimated that, based on his understanding of the evidence, that the 11% increase in the minimum wage that was slated would reduce employment of teenagers and young people by 300K. Since the current proposal is for a 39% increase, that would imply that Neumark’s estimate would be about 3.5 times the 300K, or just north of 1 million. And that estimate doesn’t include 26 and older workers
Casey Mulligan, in this NBER paper estimated the effect of the 2009 minimum wage hike of 11% hike to be a loss of 879K for all workers. Scaled up to a 39% increase in the minimum wage, Mulligan’s estimate would it seems be much greater than my back of the envelope.
So, it would seem that my back of the envelope, although greater than the CBO’s estimate, would be less than Mulligan’s or Neumark’s estimates. And I realize that Mulligan and Neumark would likely want to revise their estimates based on current conditions. But the point of my back of the envelope was not to try to get some precise number, but rather to show that it’s not hard to get significant employment loss effects from a fair reading of the existing literature.
A final comment on the Doucouliagos et al paper. That paper is arguing the effect of the minimum wage looks bigger than it really is because of publication bias. When you strip away the econometrics, they are saying that there are papers lying around somewhere brimming with sophistication and estimated on serious data sets, but which have been rejected by journal editors because they don’t like the fact that they report small or positive elasticities. Really? Where are these papers then?
Alternatively, you could interpret publication bias to be produced by specification searches that are not reported in order to identify the expected results that journal editors want to see for publication. That’s possible, although if true would be a much wider problem in statistics. I don’t think meta analysis is the way to attack this problem, if it exists. The way to attack it is to require authors to show all their intermediate results and everything they tried. Given that so many papers in the minimum wage literature have insignificant results and a wide range of estimates, I don’t really see the evidence that specification searches are more of a problem here than anywhere else.
WOW! This “….makes one wonder exactly how well acquainted with the actual research [Menzie] is.”
Unrelated: Go Wisconsin!
In the earlier comment you wrote that the average research estimate (an elasticity of -02) should be used to estimate the relevant job losses. In this comment you write that one has to look at each study to make a good judgement (exactly right, in my opinion) which seems to be exactly what the CBO did and the reason why they adjusted the elasticity down to 0.1
P.S. Why does the CAPTCHA work so badly on this site?
Hugo,
Yes, the CBO did do that and I do agree that’s the right approach. My objection was more that they were unclear as to exactly how they did that. Which papers did they take more seriously and why? How did they incorporate the publication bias they think is there?
I’d also note that if you look at my comment you’ll see that I didn’t really use -0.2 either. I took 50% of the >26 case and then I split the difference between my back of the envelope and the CBO number, since I recognize that there are likely a number of downward adjustments that should be made.
On the captcha errors, they are very frustrating. I’ve reported them several times but they still keep coming. I don’t know if I’ll be able to post this comment. Will have to keep my fingers crossed.
Menzie, what is the median elasticity in the sample? On a first pass, that would be my vote.
Steve Bannister: I don’t know what the median is, since I don’t have the data set. The conditional mean is between -0.002 to -024 using all studies, and around -0.01 using “best”.
Here’s one we’ve missed;
http://blogs.seattletimes.com/opinionnw/2013/12/06/minimum-wage-seattle/
In which Bruce Ramsey of the Seattle Times digs up a study from the early 90s of what actually happened when the voters of the state of Washington raised the minimum wage by 27% (less than half the proposed increase from $9 to $15 of Kshama Sawant). Further embarrassment for the left is that the author of the UW study, James McIntyre is the (Democrat) State Treasurer today;
‘In its study, McIntire’s team surveyed more than 1,000 employers and interviewed more than 500 affected employees. It also looked at state Employment Security data.
‘More than 100,000 employees got wage increases in 1989 and 1990 because of the rise in Washington’s legal minimum. Over two years, employers reported laying off 11,700 workers “as a result of the minimum wage increases.” Employees reported about the same number.’
Interviewed in 2013;
‘McIntire says the effect of a minimum-wage increase on jobs depends on how big the increase is — and a $15 wage would be a very big one. “Significant increases do have negative consequences,” he says.
‘“Significant” does not mean every employer. Of all employers surveyed in McIntire’s 1991 study, about 20 percent said they were strongly affected by the change in the law. They either raised prices, cut an expansion plan, cut employee hours or laid off employees. Most common was “a readjustment of hiring and personnel procedures” such as screening more job applicants to make sure they were properly trained. McIntire remembers that of employers that did lay people off, half rehired new employees to take their places.
‘The new ones, he said, “tended to be a bit older.” Having to pay them more, the employers spent more money to screen them and more to train them.’
Which is pretty much textbook.
Patrick R. Sullivan: Kind of hard to assess a second-hand account of a paper which is not online anywhere, and apparently not a single citation in Google Scholar. Does not seem to be a peer-reviewed publication, by the way.
That’s the way it worked in practice, and the way it works in theory. But why take it seriously, the guy is only the Democrat Sec’y of Treasury of Washington state.
Ah, argument from authority! Gotta love them basic rhetorical fallacies. The guy is a public office holder, so he must be right!
Patrick, the fact that the guy holds public office has no implication for the validity of his analysis. None. The fact that you claim things work in a particular way probably has an implication, but not the one you intend. Given your method of argumentation, I’d always take the other side, just because of my belief that bad arguments are typically the refuge of those with no good argument to offer.
Menzie, on the other hand, is asking questions that are standard for his profession. Where’s the paper? Where’s the data set? Has the analysis been reviewed? You’ve aggressively ignored all those questions. Not what fair-minded people want to see in a discussion.
It’s apparently a publication done while the person named was in grad school. It’s available in the state university library system but nowhere else.
That said, it’s quite easy to find employment trends in WA after minimum wage increases, which is that retail trade and hospitality and restaurant employment continued to grow and at the same general pace. I’ve seen graphs, for example, that show quite clearly there isn’t any employment effect when they increase the minimum wage. The employment trend lines by sector don’t shift at all. In one case you can see a minimum wage increase following an overall employment drop which is itself followed by continuing employment growth … which then turns down when there’s a national recession. (If I wasn’t clear, employment dropped, the minimum wage went up, employment went up and then a recession hit and you can see employment drop.)
I’d put in cites but I no longer bother arguing with people who don’t have open minds.
‘I’d put in cites but I no longer bother arguing with people who don’t have open minds.’
Yes, that can be a problem here. People unwillingly to contemplate that if a legal wage floor is put in place, then businesses won’t be hiring people incapable of producing more than that amount.
So counterintuitive.
You can claim to know what others are thinking Patrick, if that’s all you have to make your point. Mostly, the “refusal to contemplate” is a refusal to take your view of things seriously when you can’t back it up. You seem to want minimum wage increases to be bad, bad, bad, but the rest of us are interested in the evidence. No, jonathan didn’t offer evidence either. He characterized evidence, much as you did. However, the evidence he characterized has been replicated in a number of areas, as well as in cross-border studies. All you have is one guy, who you claim to be credible as an economist because he holds public office as a Democrat. So it’s looking like maybe you aren’t willing to contemplate, what shall we say? Evidence? Reality? Anything that doesn’t suit your biases?
‘Let’s take a look at where this supposed conventional wisdom lies….’
Why do you suppose it’s ‘The Laws of Supply and Demand’, and not the ‘Theory of Supply and Demand’?
As a theorist, my competence to comment is quite limited, but here goes.
In Australia the minimum wage is $16.37 AU, which might work out to around $13.00 US at purchasing power
parity, though of course much higher at the current exchange rate. There is a lower youth minimum wage, starting
at $6.03 AU for under 16 and rising with each year of age to $16.00 AU for twenty year olds. Unemployment here is 6%,
which is up from 5.1% a couple years ago. Of the unemployed, about 19% have been out of work for a year or more.
At least in my experience, almost all the studies cited above regress this against that in the little cloud of data in the MinW-UnE
plane that comes from US data, perhaps using contiguous counties or some such to try to control for heterogeneity, for example.
Taken as a whole, these studies strike me as MUCH less informative than regarding the US as a single point, AU as a second point,
and drawing a line between them. But again I’m not an econometrician.
Comments?
Yes, Australia is a verrrrry interesting example. First, note that the teen minimum wage is far lower than that for adults. Which fact, by itself, validates the concerns of those of us who worry about low skill workers being employable. If there were no disemployment effects, why the lower teen minimum?
Second, Australia has been in expansion mode for something like 23 years now–mostly selling raw materials to China. In the late 1990s, in the USA, after about (a mere) 6 or 7 years of expansion, our unemployment rate was under 5%, getting all the way down to 4.0% before the recession of 2001.
Even after a few years of expansion under W. Bush, we were at 4.5%. What could be Australia’s problem, hmmm?
So Patrick, you want the choices made by lawmakers to stand as evidence? Not the results of those choices, but the choices themselves? You’re kidding right? Seriously, you keep handing out these transparently bad arguments. It’s almost as if your masters have instructed you to allow no evidence-based argument to go unchallenged. “Go out there, minion, and cloud any discussion that is not going our way. Don’t worry about the quality of your argument, since your goal is to confuse non-specialists and casual readers, while making Samuelson feel he is not all alone.”
C’mon, offer one actual legitimate point. One. Just to prove you can.
I’m not sure that the lower youth minimum wage “validates” your concerns.
What you say is intuitive, of course, and I would guess it has something to do with it,
but the policy could also be motivated by fear of encouraging kids to not finish high school,
or relative indifference to the incomes of people without familial responsibilities.
I don’t know anything about the history of the policy, or the reasoning behind it,
except that it now clearly commands a bipartisan consensus.
Everything you need to know, but were afraid to ask, about Australia’s minimum wage;
http://cbe.anu.edu.au/media/2801814/minimum_wage_j_rob_bray_8_may_2013.pdf
My guess is an elasticity of around |.02| to |.05|. for low-wage workers (<1.5 the MW prior to the hike). Why? It would be a lot higher if the cost of MW were entirely shifted back to business owners, but my guess is that 90 percent of the burden will be shifted forward to consumers (work like a sales tax), with the rest covered by increased employee productivity (greater retention, higher motivation, better selection, etc.). In which case the employment hit should be be trivially small (pretty much equal to the income effect). What would an increase from $7.25 to $10.10 (less actually, because 21 state have minimums higher than the federal standard) mean in terms of higher prices? You say .3 percent increase; the lowest estimate I have seen in the literature is .7. A straightforward extrapolation based upon the assumption that .9 of the total minimum wage gains are shifted to consumers yields something higher, but still half of what it would take for the losses to poor families to outweigh the gains. Nevertheless, if the burden of higher minimum wages is shifted forward, more poor families will probably be hurt than harmed. Based upon data from the Household Consumption Survey, it appears that those hardest hit will be families in the lowest income decile, rural families, six-person families, and single-adult families with children, who do not rely on low wage income.
So firms can pass on 90% of a cost increase to consumers through higher prices, but do not raise prices to produce a higher net? They only notice that they can pass on 90% of a cost increase once that increase is imposed?
I’ve heard that view, that most or all of the cost of wage increases or tax increases or regulatory costs, lots of times, usually from people arguing against tax increases or wage increases or regulation. I don’t remember hearing that the vast majority (or all) of a cost increase can be passed on by anyone who was not advocating again tax or pay or regulatory increases. I find this odd.
If producers can pass along 90% of a wage increase, why not just raise prices now and increase the net? One reason is that the volume of sales would fall sharply with a price increase – sharply enough that the net would fall. (This is the “theory of the firm” side of micro.) But if there’s a wage increase, the firm blithely passes it on to consumers, without worrying about a drop in sales? Firms can pass on 90% of a wage increase when there is a wage increase, but don’t dare to raise prices without a wage increase? I think what really happens is that the net falls because the price increase reduces the volume of sales and falls because of higher input prices. Sorry, but I don’t see how that argument can possibly hold water. Maybe there is a special case where demand elasticities work out, but on the face of it, this “just pass it on to consumers” is nonsense.
kharris: The standard answer to your poser is that businesses set prices to maximize the present value of cash flow thrown off by operations. The reason they don’t raise prices further is, as you correctly observe, that they have presumably already done so (in our toy models, where marginal costs are equal to marginal revenue, which is a function of the business’s residual demand schedule, i.e., what’s left to the business in question by its rivals). If the costs of all the businesses in the industry change, however, so do their prices. The only question is how much, which depends in good measure on whether their owners have to eat those costs or can shift them forward to consumers (in our toy models, the answer to that question, the ‘tax’ incidence question, depends on industry supply and demand). Except in certain labor-monopsony models (which I think Madeline Zavodny’s dissertation pretty much put paid to), if employers pay, minimum wages have attractive distributional properties (the top ten percent of households by income bear about 75 percent of their costs), but they also cost a lot of jobs. If consumers pay, minimum wage hikes should cost few if any jobs, but like any broad-based ‘sales tax,’ their incidence will be pretty regressive (although certainly not regressive enough to offset completely the distributional benefits of paying higher wages to low-wage workers — just a lot of it).
‘…with the rest covered by increased employee productivity (greater retention, higher motivation, better selection, etc.)’
I doubt motivation will be better, as there is already the motivation of earning higher than the starting wage by learning skills that will make you more valuable. If the MacDonald’s franchisee who gives you your first job doesn’t agree, you can just waltz across the street to the Burger King, Taco Bell or Wendy’s with your newly improved resume.
But, you’re on to something with ‘better selection’. Aka, low skilled workers need not apply. How that benefits ‘the poor’ is a mystery to me. Of course, if you are lucky enough to get your first foot on the employment ladder, you’ll also be more closely supervised as management needs to squeeze more productivity out of higher paid workers. If you’re a person who would rather work in a low stress environment, the higher wage might not be enough to make you feel better about your situation.
What do you think about capital replacing labor? Does that help the poor?
OK, let’s just keep this going.
Patrick, the fact that something is a mystery to you is not a reason to doubt that it’s true. You pretty clearly are not willing to consider anything outside your own views, which would tend to make you easy to mystify. There is evidence, actual evidence, against your position. You have cherry picked economic arguments that support your view, rejected arguments that don’t for no better reason than that they don’t suit your – or your masters’ views maybe.
Really, your behavior here suggests your goal is to disrupt the discussion, to make sure that casual visitors have a hard time of gleaning the results of lots of study of minimum wage increases suggesting they are not particularly costly to workers. So why, Patrick, does your behavior look like the behavior of someone trying to prevent fair-minded discussion?
I have a hard time accepting that sprinkling ‘minimum wage dust’ over the economy invalidates the Laws of Supply and Demand. Speaking of things for which there is lots of evidence.
But, compared to the power of self-congratulatory concern for ‘the poor’, economic theory seems to be nearly powerless.
Historically it has, in spades. It’s happening now in China, India, Viet Nam. It happened in the USA during the 90s. So far increased capital investment has had the effect of making labor more valuable. There’s no guarantee that that will be the case in the future, but it’s probably the smart money bet.
Yes, there’s no controversy over increased capital benefiting labor–at least since the shovel was invented, but when capital REPLACES labor, that’s a different story. Isn’t it?
The opponents of minimum wage increases claim that the demand for labor is downward sloping and that increases in the minimum wage lead to lower minimum wage employment.
If this applies to minimum wage employees it should apply to all employees, right?
As far back as we have data — 1947 — nominal labor compensation for nonfarm business has risen each and every year.
If we apply the minimum wage analysis to total employment it implies that total nonfarm business employment should have fallen each and every year since 1947.
If I accept the minimum wage analysis I must also accept the above conclusion, right?
We all know that the demand for labor is a function of may things, not just wages.
That is the reason we reject the argument that rising labor compensation must lead to lower employment.
Well the same applies to the minimum wage. The demand for minimum wage employment is a function of many things and a higher minimum wage does not necessarily lead to lower employment just as it does for total employment.