If a collapse in aggregate demand is not at fault, then was an aggregate supply shift? A quick-and-dirty evaluation using some back-of-the-envelope calculations
In 2008Q4, GDP fell at an annualized rate of 8.9%; it fell another 5.6% going into 2009Q1. One interpretation is that aggregate demand collapsed. An alternative interpretation is that supply fell; in this view, aggregate demand management policies would have no effect, or even be counterproductive. In this light, I thought it of interest to consider what must be true in order for the supply side view to be correct.
.First, consider the evolution of US GDP in 2008.
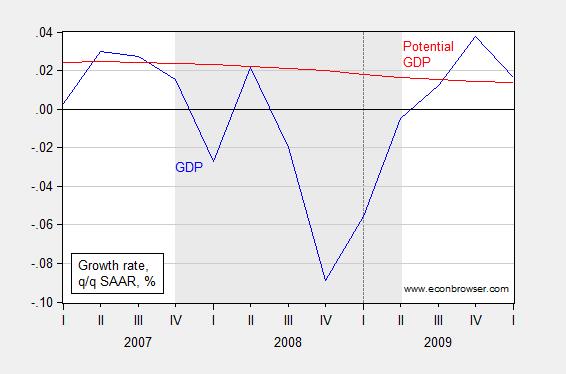
Figure 1: Quarter-on-quarter real GDP growth, at annual rates (blue), and of potential GDP (red). Growth rates calculated as log first differences. NBER defined recession dates shaded gray. Dashed line at 2009Q1 (passage of ARRA). Source: BEA, 2013Q4 second release, CBO, Budget and Economic Outlook, February 2014, NBER and author’s calculations.
In the last quarter of 2008, real GDP was declining by 8.9% q/q annualized, a much steeper drop than the initial reading of 4.1% estimated at the end of January 2009.
Now let’s consider two alternative views of the world. The first is the conventional aggregate demand framework (I take this from Blanchard and Johnston):
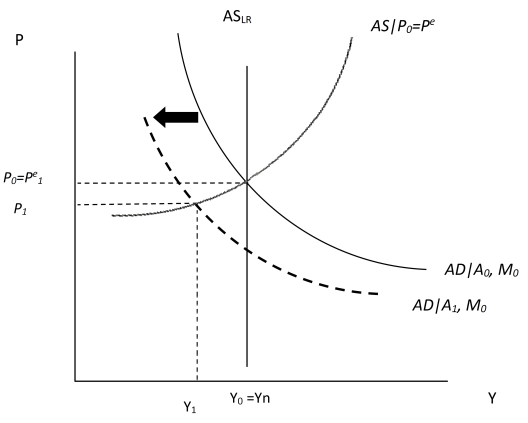
Chart 1: Negative aggregate demand shock, when prices are sticky. Yn is potential GDP.
The aggregate demand curve is downward sloping because a higher price level, holding constant the money supply, leads to a higher interest rate and hence lower investment (or consumption; or a stronger dollar). The downward sloping AD curve can also be rationalized within a CC-LM model, as well as a model with collateral constraints.
A decrease in the AD curve could arise from a reduction in consumption, say due to a decline in perceived net worth, or a tightening of credit constraints that leads to more liquidity constrained households.
Alternatively, one could consider an inward shift of the Classical aggregate supply curve (which is vertical because prices are perfectly flexible).
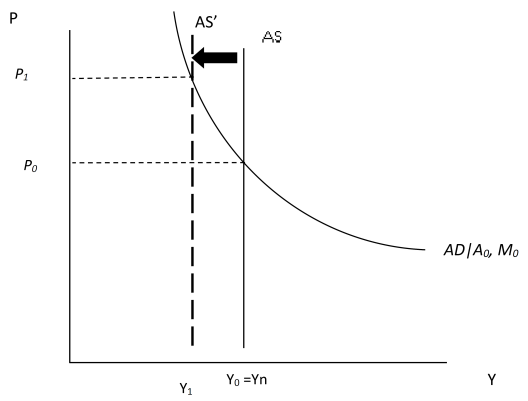
Chart 2: Negative aggregate supply shock. Yn is potential GDP.
I’ve drawn the figures such that in both cases, output falls the same amount. One interesting difference is that in the case of a demand shock, price level falls (or when there is expected inflation, inflation falls), while in the case of a supply shock, the price level rises. What does the data indicate?
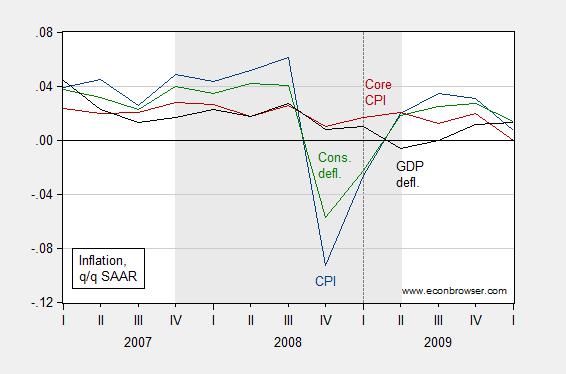
Figure 2: Quarter-on-quarter CPI inflation (dark blue), core CPI inflation (red), personal consumption deflator (green), GDP deflator (black), all at annual rates. Growth rates calculated as log first differences. NBER defined recession dates shaded gray. Dashed line at 2009Q1 (passage of ARRA). Source: BEA, 2013Q4 second release, BLS via FRED, NBER and author’s calculations.
The price series in Figure 4 are more consistent with the aggregate demand interpretation than the aggregate supply.
Another way of thinking about the plausibility of the Classical interpretation is to recall:
Yn = Φ F(K,N)
If output is completely supply determined, then one has to think about the fact that the change in output must be attributable to either the change in total factor productivity, TFP (Φ), the capital stock (K), or the labor stock (N). That is (after taking logs, and assuming a Cobb-Douglas production function):
Δy = Δφ + σ Δ k + (1- σ) Δ n
Where σ (1-σ) is capital (labor) share of income. The cumulative drop in output going from 2008Q3 to 2009Q2 is 3.7% (log terms). One can work out the implied declines in each of the components by setting Δy = 0.037. Either multifactor productivity declined by 3.7%, the effective labor stock fell by 6.2%, or the capital stock declined by 9.3% (all calculations assume labor share is 0.6, capital share is 0.4).
Well, using John Fernald’s utilization adjusted estimate of total factor productivity, one finds that productivity rose 2.5% over the corresponding period (discussed in this post). The pattern of utilization adjusted TFP is shown in Figure 3.
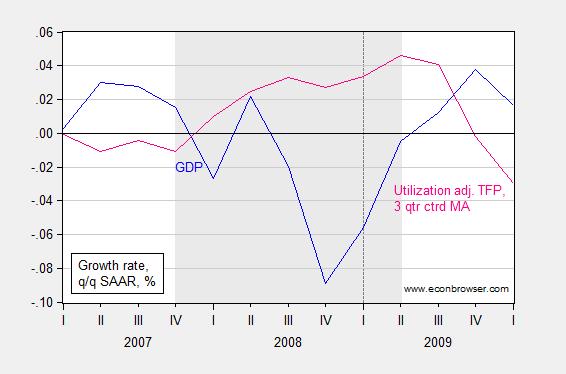
Figure 3: Quarter-on-quarter real GDP growth, at annual rates (blue), and three quarter centered moving average of utilization-adjusted total factor productivity (pink). NBER defined recession dates shaded gray. Dashed line at 2009Q1 (passage of ARRA). Source: BEA, 2013Q4 second release, Fernald (2014), accessed 3/3/2014, NBER and author’s calculations.
A big decline in TFP growth does not seem apparent to me.
What about capital stock? The residential capital stock accounted for slightly under half of total private fixed assets at the end of 2007. Did roughly 20% of residential capital become completely useless in 2008? Perhaps; but it’s not the first guess that would come into my mind.
Finally, what about the labor stock – could it be that the jobs-skills mismatch rose so much that it accounted for a 6.2% reduction in the effective labor stock? Perhaps, but Ed Lazear and James Spletzer (2012) argues that most of the unemployment is not due to this factor.
None of the foregoing should be construed to mean that the decline in output in 2008-09 is due entirely to the decline in demand. I believe some of it can be ascribed to supply shocks, e.g., Hamilton (1988). However, it seems difficult to argue that it is almost entirely a supply shock in the Classical sense. And if one is skeptical that it was almost entirely due to a Classical supply shift, one should also be skeptical too of a real business cycle approach, which is a stochastic re-interpretation of the Classical model. (Rousing defense of the RBC interpretation from McGrattan and Prescott (2014).) By the way, I’m happy to entertain an upward shift of the short run aggregate supply curve in the AD-AS framework, wherein oil prices feed into the price level, in an economy with monopolistically competitive firms that markup-price. But that textbook, and is an economy where countercyclical fiscal policy works in the conventional manner.
By the way, there is at least one person who is beating the drum for a completely supply determined interpretation of the Great Recession. That person is Casey Mulligan (interpretation here, 2008 forecast here, includes the prediction that in the absence of nuclear war, nonfarm payroll employment would not fall below 134 million [1]).
For more, see recent discussion by Noah Smith.
To understand the supply side versus the demand side you must have a long term view of the fiscal decisions on capital malinvestment. Also a Keynsian analysis of supply the supply side is an absurdity.
Menzie has taken the statistics of the bust caused by demand side malinvestment to prove a demand model. When resources are diverted to non-productive uses it is not valid capital. How many county court houses did Hoover and FDR need to build to create a bushel of corn? How many pigs needed to be slaughtered to create an apple?
How many trillions of dollars do we need to give to Goldman Sachs to stop one foreclosure? How many bonuses must we give to investment bankers to provide nursing to the autistic?
How many dollars must be flushed down a toilet to bring economic recovery?
Don’t Hamilton’s oil price based shocks actually get transmitted through the demand side because of price inelastic gasoline demand and (now more constrained) income (budget) elastic demand for consumer durables? I interpret that as a negative demand shock.
Comparing US real GDP per capita today with previous debt-deflationary depressions of the 1830s-40s, 1880s-90s, and 1930s-40s:
https://app.box.com/s/4ccj1how2oy9hw3h9s09
https://app.box.com/s/g1qd63k4cq7vxpu6ojic
And with Japan’s slow-motion debt-deflationary version since the 1990s:
https://app.box.com/s/qendym296b81lf9er0z4
Long Wave Upwaves (averaging historically 16-24 years) are inflationary, demand-side regimes, whereas Long Wave Downwaves (following the peak in interest rates and the rate of price inflation) are disinflationary/reflationary supply-side regimes with falling nominal interest rates lasting on average historically 32-40 years. We are in the terminal phase of the Long Wave Downwave, i.e., Schumpeterian depression or Long Wave Trough, but without yet experiencing the characteristic debt-deflationary wipeout to clear the decks of private debt and bank loans to GDP and wages.
The larger the current global credit bubble inflates, the larger the rentier claims on future real GDP per capita, the more protracted the sub-optimal growth will be, and the larger the debt-deflationary wipeout will be when it inevitably occurs.
Why demand is so weak:
https://app.box.com/s/n9im3t5wpvgmva0gd301
https://app.box.com/s/so7cgboezfv5zs7xvcm5
Labor returns and purchasing power are being gutted after inflation, debt service, and so-called “health care” costs, which today are an equivalent of 18-19% of GDP and 25% of private GDP. Yes, 25%, which is an equivalent of the OBSCENE amount of $24,000 per household, when the median household income is barely twice that amount.
Add payroll taxes of 15.2% (combined employer and employee “contributions”) per worker, and it should be no surprise why self-employment, business starts, and labor returns to GDP continue to decline to secular lows.
In the meantime, equity market cap to GDP is in excess of 125% (historical average of 50%, and 30-35% at secular bear market troughs), and total debt to private wages is near 9 times, imposing a debilitating perpetual claim on wages, profits, and gov’t receipts, and ensuring decelerating money velocity and rate of private investment, employment, and wages indefinitely.
And the 3-year rate of real wage growth appears to have peaked for the cycle, implying another deceleration to the 5- and 10-year rates at ~0-1%, if not again negative during the next recession.
Steve Bannister: Yes, I think that is right. I didn’t mean to imply that energy price changse only affected output by why of the supply side. However, if they only affected demand, and the AS curve was vertical, then the price level would rise, with no impact on output. That was my point — a Classical AS curve yields counterfactual implications.
Menzie,
I’ll take door number three. It’s the consequences of government policies on labor supply that accounts for it.
I would agree with Lazear and Spletzer that structural problems in the labor market such as job mismatch do not explain the unusually weak labor market. When Casey Mulligan made his labor market forecast in 2008, he could not have forseen the disasterous policies that were coming that would depress labor markets beyond what most of us could have imagined. Fortunately, he has explained what happened in compelling way in the book that you referenced, “The Redistribution Recession.” Mulligan points to 3 effects:
1) The minimum wage increases, signed by President Bush in 2007, produced 3 minimum wage hikes over 2007, 2008, and 2009. As we know, increases in the minimum wage have disemployment effects.
2) We have talked about how the stimulus plan didn’t stimulate, since it did very little to increase government purchases, being mostly composed of temporary tax cuts and transfer programs. But Mulligan points out how the transfer programs reduced the return to working, particularly by raising implicit marginal tax rates that are incurred from cessation of benefits as income rises. The stimulus package thus actually de-stimulated the economy, producing multipliers that were negative. The counterfactual of no stimulus that is often talked about is that economic growth would have been better and employment higher. And a bigger stimulus, rather than helping, would have depressed economic activity even further.
3) Mulligan also points to the mortgage relief programs which also created significant implicit marginal tax rate increases, again produced by the cessation of benefits as income increases.
Beyond all that, we also have Obamacare effects starting to kick in. The expansion of medicaid with cutoffs in income eligibility under that program will increase implicit marginal tax rates even further for low income workers. Moreover, I had worked through representative examples some months ago in the comments that showed how steep the subsidy losses in the ACA are to increases in income for workers under 400% of the poverty line. So, we have even more increases in marginal tax rates already baked in. Mulligan, of course, has done precise estimates of the implicit deterrents to employment from Obamacare, but you don’t really need fancy econometrics to see it.
And, to add insult to injury, now the Administration wants to raise the minimum wage again significantly.
If we had not had these deleterious policies, Mulligan’s employment forecast in 2008 would have probably been accurate.
Rick Stryker: I see. The implementation of the ARRA, minimum wage legislation and mortgage modification programs wreaked more damage on the US economy than nuclear war?
Menzie,
Well, Mulligan mentioned nuclear war for dramatic effect, but yes, to get the employment numbers we’ve seen you would have needed some pretty bad natural disaster, holding policy constant. Mulligan discusses how bad the incentive effects of the ARRA were in The ARRA: Some Unpleasant Welfare Arithmetic. Mulligan shows that the ARRA increased implicit marginal tax rates to 100% for 1-2 million low income workers, so that they had no incentive whatsoever to work.
I think you’ve obsessed about the multiplier, an ancient superstition from the barbarous age of macroeconomics. But the value of the multiplier doesn’t matter. The stimulus was poorly designed, providing very little in the way of Keynesian stimulus to be multiplied. Mulligan’s important point is that the transfers that did result from the ARRA were not benign or irrelevant but rather produced very significant dis-employment effects.
What about capital stock? The residential capital stock accounted for slightly under half of total private fixed assets at the end of 2007. Did roughly 20% of residential capital become completely useless in 2008?
Why the focus on residential capital? For analyzing agg. supply and output, isn’t non-res capital — P&E & intangibles — what is relevant?
marcel: Well, I was trying to put forward the best case for the Classical/RBC interpretation. Obsolescence of housing is one candidate culprit in that worldview. If you can think of a counterpart in the other components of the capital stock, I would be pleased to hear what the story is.
How could anyone compare Keynesian economics to nuclear war. Isn’t that absurd?
http://www.youtube.com/watch?v=8Ku4ZD-ZcZk
Well Stryker, since you adhere to Austrian economics, a school of economics that is still interred in the 1930s, I am surprised you invoke Mulligan, a neo-classical, although perhaps I should not be all that surprised. http://noahpinionblog.blogspot.com/2014/02/how-new-classicals-drank-austrians.html. The empirical facts don’t support your or his argument. If there had been a supply shock to the labor market, with lots of those lower class, low income, workers going to the beach to enjoy their UI and food stamps, there should have been an increase in real median wages as firms competed for the smaller pool of workers. After all, when there was a period of high economic growth and full employment, this is what happen in the 1990s, and before that in the 1950s and 60s. Instead, we have seen a period of declining real wages and employers being very selective and picky about the workers they hire. Statistically, there have been roughly four applicants for every vacancy, And during the period when Mulligan said all the slackers were busy reclinning rather than take low wage jobs, thousands lined up for jobs at McDonalds. http://www.cleveland.com/business/index.ssf/2011/04/hundreds_line_up_for_mcdonalds.html Finally, the changes in the employment patterns in the labor force contradict Professor Mulligans premises, where the “high marginal” tax rate effects the desirability of low wage jobs, as most of the jobs lost in the Great Recession were “middle income” jobs, and most of the new jobs are low wage jobs, the exact opposite pattern then what one would expect from Professor Mulligan’s hypothesis. http://www.nytimes.com/2012/08/31/business/majority-of-new-jobs-pay-low-wages-study-finds.html?_r=0 Despite ignoring the data, Professor Mulligan and Prescott are the “scientists” here.
Finally, regarding the “Keynesian Multiplier,” apparently someone forgot to tell the IMF it was an “ancient superstition.” See https://www.imf.org/external/pubs/ft/wp/2013/wp1301.pdf
stryker,
“1) The minimum wage increases, signed by President Bush in 2007, produced 3 minimum wage hikes over 2007, 2008, and 2009. As we know, increases in the minimum wage have disemployment effects.”
not really true. the employment effects go both ways. and further, what percentage of the economy is directly affected by a minimum wage hike? if an increase in minimum wage has anything more than a minor ripple through the economy, then you should really reassess how robust your job infrastructure really is. minimum wage hikes are not what is causing stagnation of jobs and the economy-that is simply misdirection.
“2) We have talked about how the stimulus plan didn’t stimulate, since it did very little to increase government purchases, being mostly composed of temporary tax cuts and transfer programs. ”
you have talked about how it did not stimulate. the real world has viewed that outcome quite differently. You really think the continuous reduction in government employees at the state, local and federal level throughout the recession had no impact on unemployment, and served to counteract the efforts of the stimulus programs?
“The stimulus was poorly designed, providing very little in the way of Keynesian stimulus to be multiplied. ”
you think this was the fault of obama, or a reality of trying to get a stimulus passed while dealing with the politcal “anti” crowd such as yourself. you think it is really fair to sabotage the stimulus from the beginning and then cry victory when it falls short of the goals? if conservatives are so sure keynesian stimulus will fail, why not let the policy be implemented, allow the failure to occur, and take the leadership position in the next election? why don’t you let the policy be implemented? or do you honestly believe the stimulus is exactly what obama would have requested had their been no opposition?
stryker, that is three strikes and you’re out. go back to the bench.
I seem to recall a few of these New Classical types tried very hard to explain the Great Depression in terms of real shocks as opposed to a decline in aggregate demand. Their story about the 1930’s is about as incredulous as their story as to the 2008-current period.
Anyone here notice that persistently high unemployment, low interest rates and sluggish GDP growth are classic signs of a too tight monetary policy?
Added to that, ridiculously high marginal tax rates only make the economy worse (Mulligan’s argument). As Paul Krugman put it in his Peddling Prosperity, unemployment insurance in alleviating the pain of unemployment had a ‘hidden cost to this laudable goal’ (citing Martin Feldstein’s ‘cutting edge’ work). Who am I to argue with Paul Krugman.
Rick Stryker For someone who claims to be well read on the minimum wage, you sure seem to misunderstand the conclusions of most of those studies. Even those studies that find a statistically significant negative relationship between the minimum wage and employment also fail to find a policy significant relationship. A coefficient can be statistically different from zero, but still zero for all practical policy purposes. So it’s a bit hard to see how a miniscule policy effect had any large effect on employment.
And since when did conservatives start arguing that decoupling health insurance from employment somehow made labor markets less efficient? I thought you guys were all about distortions and deadweight loss?
Patrick R. Sullivan You and Rick Stryker have a lot in common; neither one of you can correctly read what Paul Krugman writes. Look, Krugman was talking the disincentive effects of unemployment insurance when the economy is near full employment. No one disputes that. That’s why unemployment compensation is normally limited to 26 weeks. Various studies have found that 26 weeks is about the best trade-off between the negative disincentive effects of unemployment compensation and the positive effects that unemployment compensation has on finding jobs with higher marginal product. But in case you hadn’t noticed, we’re not anywhere near full employment, so the disincentive effect is a red herring. If there are three unemployed people looking for work for every one job available, then it really doesn’t matter if two of them are slackers. It’s a zero sum game. Well, not quite. If all three of them aggressively look for work and each one is willing to undercut the other two in terms of real wages, then the net effect will be deflationary pressures and even more involuntary unemployment.
Sherparick and 2slugbaits,
You guys need to acquaint yourselves with the facts before you make such general statements. You could start by actually reading Mulligan’s book The Redistribution Recession. Sherparick, if you read the book, you’d see that Mulligan charts real employee compensation per hour in Figure 2.3 and shows that it did in fact rise over the recession and recovery. 2slugbaits, if you read the book, you’d know that Mulligan provides a couple of estimates of the job loss resulting from the minimum wage hikes. The first is Neumark’s own estimate of 300K for teens and workers under 25, which Mulligan assumes would be about 600K for all workers, although Mulligan acknowledges that the empirical evidence on effects of minimum wages on workers over 25 is limited. Second, Mulligan uses his own model to derive an estimate of 829K for all workers. Is that big? The labor force declined by about 8.5 million before it began to turn around in March 2010. So, the estimates of minimum wage job losses are between 7% and 9.7% of the total job loss. I think that’s significant. You may disagree but I bet the people who lost their jobs would agree with me.
Menzie wrote:
How can there be “a collapse in aggregate demand” without a previously created bubble? In other words isn’t the “collapse in aggregae demand” simply the Bust phase that follows the artificial Boom phase of the Austrian Boom-Bust cycl?
pgl,
Saying that a recession is caused by a decline in aggregate demand is like saying a person is dead because he stopped breathing. Both are true by definition but they tell us nothing. What caused the man to stop breathing or the decline in aggregate demand? Ususally you will find some fiscal policy that distorted the demand in the economy then white-washed by a loose monetary policy that only makes the problem worse by distorting the price signals in the rest of the economy.
‘Krugman was talking the disincentive effects of unemployment insurance when the economy is near full employment. No one disputes that.’
Really, can you produce a quote from Krugman to that effect?