Wisconsin continues to lag the other regional economies
The Wisconsin Department of Revenue today released its Winter Wisconsin Economic Outlook. The forecast indicates a shortfall relative to Governor Walker’s promise to create 250,000 new private sector jobs.
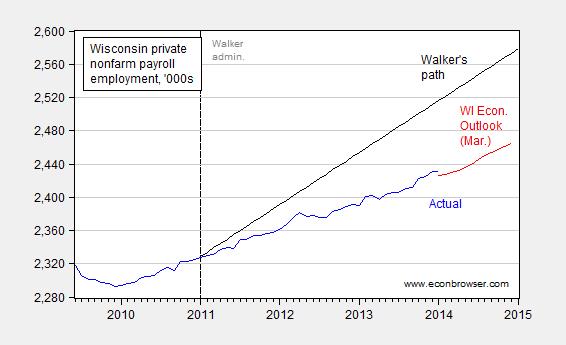
Figure 1: Nonfarm private payroll employment for Wisconsin (blue), quadratic match interpolation of quarterly forecast (red), and linear trend for Walker’s target of 250,000 new jobs (black). Source: BLS and Wisconsin Economic Outlook (March 2014).
In order to hit the target, 12,275 jobs per month would need to be created each month for the next year; the mean job creation rate since 2011M02 has been 2,892, with standard deviation of 3,817. Achievement of the Governor’s goal would therefore seem “unlikely”.
How about Wisconsin’s relative performance? As noted in an earlier post, Wisconsin private nonfarm payroll employment is flat going from December to January (the earlier post used state data, but the BLS released series are numerically indistinguishable). Of course, one should not put too much weight on one month’s numbers. It’s interesting to observe that while the 3 month annualized growth rate of Wisconsin private employment (Governor Walker’s preferred measure) is 1.5%, Minnesota’s is 2.4%.
Figure 2 depicts overall nonfarm payroll employment (which is more favorable to Wisconsin of late).
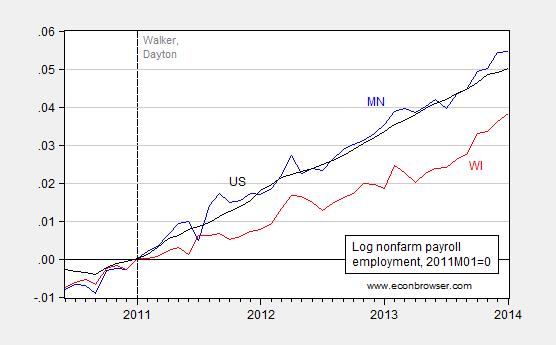
Figure 2: Log nonfarm payroll employment for Wisconsin (red), Minnesota (blue) and the US, all seasonally adjusted, 2011M01=0. Source: BLS, and author’s calculations.
Minnesota’s cumulative growth rate since 2011M01 relative to Wisconsin is 1.6% as of January 2014. Wisconsin’s performance relative to Minnesota is not unique. Using a broader measure of economic activity, the Philadelphia Fed’s coincident indices, one finds that Wisconsin is outpaced by all her neighbors. (see also [1])
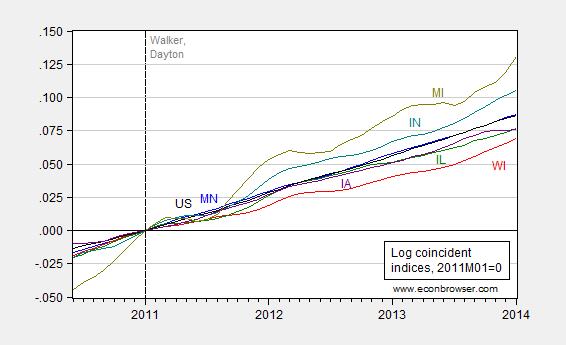
Figure 3: Log coincident indices for MN (blue), WI (red), IL (green), IA (purple), IN (teal), MI (olive), and US (black). Source: Philadelphia Fed, and author’s calculations.
Indiana and Michigan outpace the Nation, but these states experienced a much deeper drop during the Great Recession.
The cumulative growth gap since 2011M01 between Minnesota and Wisconsin is 1.8% (log terms); using the Philadelphia Fed leading indices as of the December release, the gap will shrink to 1.3% by June 2014 (as pointed out by some observors). However, with upwardly revised employment figures for Minnesota (more so than for Wisconsin), my guess is that the January release of the leading indices (slated for March 24) will imply faster Minnesota growth, so that the gap does not shrink as much as suggested by the current forecast (if at all). Furthermore, using the December forecasts, the US-WI gap will widen from 1.7% to 2.5%. Hence, Wisconsin also lags the Nation.
https://app.box.com/s/rq5yif6ndwwbgjh26gzi
https://app.box.com/s/wohw0hjvel77uks2t0oa
https://app.box.com/s/m0w4ql94t9g5mlsrpas9
https://app.box.com/s/wn1jycngc3bluq0nnxgs
https://app.box.com/s/so7cgboezfv5zs7xvcm5
Cyclical demand constraints for private investment and labor utilization occurred in Q3-Q4 2013 (consistent with Edward Lambert’s model) at the potential real final sales per capita trend of a bit below 1% annualized:
https://app.box.com/s/9vk80jffdy6aan0zk3b9
The U rate has likely bottomed and will rise throughout 2014 and into 2015 or 2016.
Hear is one stat that the Badger state leads in.
http://freebeacon.com/union-membership-plummeting-in-wisconsin/
What is the cause of this????
Just in case anyone is confused by Menzie’s presentation of the growth of Minnesota and Wisconsin in 2013, here are the nonfarm employment change for the two states in 2013.
Wisconsin (employment number 1/14 – employment number 1/13)
57400
Minnesota (employment number 1/14 – employment number 1/13)
46900
Perhaps this will give all a better understanding why Menzie refuses my request to present a new chart normalized to 1/13 for both states. I remind you that this is the date which each state retroactively enacted major tax changes, Wisconsin lower tax rates, Minnesota higher tax rates and new type of b to b taxation.
Ed
Oops, I messed up the above calculation mixing updated with nonupdated data. I guess I got excited to be able to post again after a long period of Capcha errors.
Anyway here is the correct data.
Wisconsin (employment number 1/14 – employment number 1/13)
56100
Minnesota (employment number 1/14 – employment number 1/13)
Still want that normalized to 1/13 chart.
Ed
53900
While Ed may have the overall numbers, he’s missing two important segments in that 1/13-1/14 jobs number.
Change in gov’t employment, 1/13-1/14
Minn +3,700
Wis. +15,200
Change in private sector employment, 1/13-1/14
Minn +50,200
Wis. +40,900
But hey, maybe it’s because Scott Walker really is a closet Keynesian. After all, this 40,900 is the best 12-month private sector job growth the state has had in his 3 years in office, and all it took was to add back the public sector jobs that were slashed at the start of his failing tenure!
We also know that Scotty loves deficit spending, as evidenced by the record debt offering for Wisconsin highway projects that came out this week.
But hey, we all know numbers and math are a liberal plot and should be disregarded as such. Ain’t that right Hans, Ricky, and Ed?
Here is good information to allow you to compare Wisconsin to Minnesota. Menzie’s hocus pocus on employment misses the point. Menzie, like a good Keynesian, believes that employment is a function of a state’s indebtedness. In truth it is the private sector that creates jobs. Menzie is focused on the fever while the medicine is curing the disease.
Both of these states have very, and I mean very serious over
taxing issues. These series of comparisons have little or no
meaning other than distracting the real issue of a bloated
governmental units….Howerver, TMZ, does wish to purchase
the copyrights.
http://www.cnbc.com/id/101504033
Hans
The greatest trouble with Wisconsin is that for decades it has been a high tax state. It has retarded new innovation and new business. It has allowed the bleed from old firms to slowly destroy the choices and mobility of both workers and entrepreneurs. The people of Wisconsin finally recognized this and resulted in the election of Walker and, more surprising, a republican majority in the legislature. The voter sentiment was confirmed by the aversion to the democrat tantrum tactics and the later recall elections. I suspect the voters of Wisconsin will recognize the benefits of the change of direction by the state and will, in the next election, continue this direction. So much for the general, now more specific.
How familiar are you with Wallethub? I am not but I noted that in their methodology, sales and use tax were calculated from 2012 data. Is the rest of their data from that year? I also noted for “simplicity” the methodology ignores deduction when calculating income taxes. This may be all right, but the conclusion of their study should be renamed as the best and worse for the taxpayer marginal dollar, the tax on the next dollar earned.
Ed
Mr Hanson, excellent post…You are certainly aware of your economic surroundings
unlike so many other taxslaves.
I must apologize as I am unfamiliar with WalletHub and their methodogy, however,
based on the top 5 and the bottom 5 they certainly have their facts straight.
What surprised me, was how Washington and Nebraska rank!