Total vehicle miles driven in the United States have not re-attained pre-recession peaks.
Upon inspecting Figure 1 in this post, reader Patrick R. Sullivan decries the current level of auto production. His reasoning?
Looking at Figure 1, I’d say that sales of cars are pathetic. Only back to the level of 2005. And that after years of far below normal sales figures, which should have resulted in pent-up demand. This is nothing to brag about for this economy.
In a similar vein, Bruce Hall writes:
Just curious how much the present demand still represents “pent-up demand.” With domestic production running at 300-350K per month and then dropping like a rock for three years, it would seem that just getting back to the old “normal” still represents “behind the curve.” There are plenty of anecdotal accounts of small fleets being run into the ground because owners are afraid to spend money on replacement vehicles.
I’d suggest there is still a story behind the chart that is not being told.
I agree that there is more aspects to consider. First, I think it is useful, when considering what is an appropriate level of production, to take into account what is the end-use of the product. In the case of motor vehicles, it’s miles driven. And here, the trend has been sideways — after a drop in 2009.
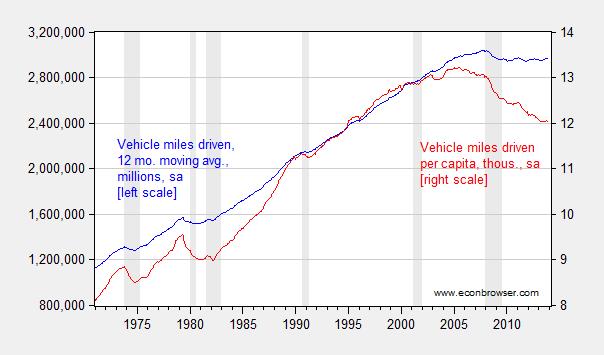
Figure 1: Total motor vehicle miles driven, in millions, 12 month moving average (blue, left scale), and vehicle miles driven per person, in thousands (red, right scale). NBER defined recession dates shaded gray. Source: Federal Highway Administration and BLS via FRED, and author’s calculations.
What is more interesting to me is the decline in per capita miles driven. This variable has dropped 9% (log terms) since 2005M08 (vehicle miles have fallen 2.1% since the miles peak of 2007M09).
Part of the reason for the reversed trend in per capita miles driven is surely elevated gasoline prices; however, this seems unlikely to be the only factor.
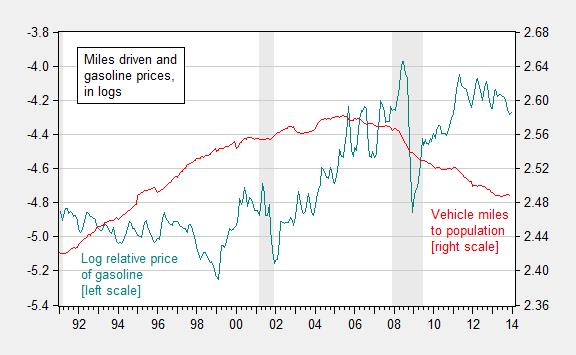
Figure 2: Log relative price of gasoline to core CPI (teal, left scale), and log vehicle miles driven per person, in thousands (red, right scale). NBER defined recession dates shaded gray. Source: Federal Highway Administration and BLS via FRED, and author’s calculations.
Calculated Risk observes:
[G]asoline prices are just part of the story. The lack of growth in miles driven over the last 6 years is probably also due to the lingering effects of the great recession (high unemployment rate and lack of wage growth), the aging of the overall population (over 55 drivers drive fewer miles) and changing driving habits of young drivers.
Update, 3/21 4PM Pacific: More from SSTI, here.
One other factor to consider: cars are getting more durable (especially since they are now required to drive fewer miles). If you put together a time series of the fleet turnover ratio (registered vehicles / annual sales), there is a distinct upward tilt to the trendline. This calculation would also indicate that sales are currently at what would be considered a sustainable level.
Professor Chinn,
I don’t see “vehicle miles driven per person, in thousands (red, right scale)” on Figure 1.
AS: Sorry, you are right. I have corrected.
The only way supply of cars would be an issue is if people are doing without cars now. There might be something in this: used car sales have risen and cars are being held longer so there could be a drop in the number of cars needed for the population … but the figures say the total number of vehicles has actually gone up and there’s no evidence the total car supply market was so tight before the recession (or used car prices probably would not have gone up so much, etc.). I haven’t done the math but it seems the effect, if any, wouldn’t be enough to bend the miles driven curve this much.
I think another factor, also hard to examine, is real estate related. My guess is that increasing value of houses on the edges of urban/employment areas had extended commuting patterns. Note that edge of area living also entails more driving in general because stores and other “life” infrastructure lag behind home building. That raises two possibilities. The first and I think primary one in the curve bending is that real estate motivated driving patterns were pushing up the number of miles driven, masking what would otherwise have been a leveling. A second factor is that edge communities have filled out their “life” infrastructure, though of course not at the level needed if the growth had continued and that would tend to reduce local miles driven. And of course people over time are more likely to find work closer to their homes.
In terms of data, a good starting point is the rate of household formation, which has taken a huge beating since the recession started. Even if households have the same number of cars, they aren’t separating into separate households and that likely reduces miles driven.
If you’re not working, you don’t commute. Also, not using a true zero on your graphs over dramatizes the impact. In particular, having two metrics on same graph (per capita and total miles) and then having different non zero scales, really distorts things.
Nony: congratulations. In nearly 9 years of blogging, you are only the second person to complain about no-zero scales and crossplots.
Menzie,
I find non-zero scales and crossplots very useful. One detail, though: I would suggest making the ratio of the upper and lower values equal, in order to make them comparable. For instance, in this case I’d make the upper and lower values on the right-hand y-axis equal to 16 and 4: we’d see that the per-capita variation isn’t quite as different from pure VMT as the original graph suggests.
You trying to make me feel smart or feel small? 😉
http://community.us.playstation.com/t5/image/serverpage/image-id/12893i8EF3BDD4BE64C0EF/image-size/original?v=mpbl-1&px=-1
Hi Nony,
that’s irony. And if you are asking Menzie if his irony means you might be smart, that for sure can only result in the non-zero scale statement : Nony is a bit dumb.
Question; how do you get the data on miles driven?
Patrick R. Sullivan: Google and ye shall know:
http://www.fhwa.dot.gov/policyinformation/travel_monitoring/tvt.cfm
Thanks, but things like this;
‘At a minimum, a State should have 6 permanent sites for each grouping of functional classified roadway. ‘
make me very sceptical of the data. If there are changes in traffic patterns, how do we know if the states pick up on that? I have had a non-trivial amount of contact with state DOTs over the years, and my experience is not conducive to relying on them to be accurate.
Patrick, FHTA http://www.fhwa.dot.gov/policyinformation/travel_monitoring/tvt.cfm
They release data monthly and do a reanalysis every couple of years. I recommend looking at both the original number (data is usually finalized about two month after original reporting) and the revised numbers. I suspect the reanalysis introduces some bias in these unusual times.
I think we might actually be over estimating VMT. I used to follow the data closely. Between 2005 and 2010, VMT declined faster than fuel consumption, suggesting our roads were becoming less efficient. After reanalysis in 2010/2011, this trend disappeared. I originally started looking at the data because my commutes seemed to be getting longer, and fuel economy went down, despite there being less vehicle on the road. I suspect that the reasons the roads became less efficient is that people wrongly responded to high fuel prices by accelerating slower (it’s counter intuitive, but quick, smooth acceleration is much more efficient than gradual acceleration, both mechanically and by increasing throughput at bottlenecks). I think increasing use of cellphones also contributed (if the trend I saw was real).
Steve Jessberger was the contact listed back in 2010, he was very responsive and friendly.
http://www.fhwa.dot.gov/policyinformation/staff.cfm
TEST TEST TEST
TEST TEST TEST
Works now but not in an earlier thread
Is there any way to get around CAPCHA blocking posting on other threads?
Menzie,
An additional analysis that I think you’d find helpful is the first derivative of Figure 1. In other words, we need to look at the rate of growth of VMT, not just the total. I think you’ll find that the rate of growth has been dropping in a fairly linear fashion starting well before either the beginning of high oil prices, or the Great Recession.
The change in VMT is happening primarily with young people, and it’s happening at roughly the same rate for employed and unemployed young people (so it’s not caused by unemployment, despite a correlation between unemployment and lack of car ownership). Primary causes of this change appear to include the replacement of “cruising” (to meet others) with social media, and lower fashionability of driving due to Climate Change concerns. Car sharing (such as zipcar.com), probably contribute as well, and services like Uber seems likely to accelerate the trend a bit.
As far as pentup demand goes, I’d say car sales plateaued in 1975, and that much greater durability has contributed to a lack of growth in car sales. It also looks to me like the car industry fought this trend with discounts and easy financing to the point that they “stuffed the sales channel”, and set themselves up for a situation where consumers could easily put off purchases for several year, thus making their industry’s sales very delicate and volatile. And, where sales volume may recover from a slowdown very slowly, if at all.
Maybe the roads are finally reaching saturation point. If more miles driven per capita and more restaurant meals is how people choose to spend their money, I say take it away from them. The costs (in terms of the environment, congestion and health care) are not sufficiently internalized.
The economy – as measured by the employment to population ratio – is still far weaker than it was in 2005. Plus as noted – gasoline prices are much higher. So yea – we are driving fewer miles per capita. Which if one cares about global warming is not entirely a bad thing. If more U.S. cities had decent public transportation systems, we would certainly need less cars.
The average price of oil since Peak Oil in 2005-07 has been $80-$88.
Real final sales per capita have grown little, if at all, during the period.
US total petroleum liquids consumption is down 20% per capita and down 17% for gasoline since Peak Oil.
Private, full-time employment is at the level of 1999, and at the level of 1987 per capita, the latter date coincident with US oil production being down 40% per capita since, along with US deindustrialization and financialization, culminating with the peak of the secular debt cycle in 2008.
Demand destruction per capita from Peak Oil and the end of the post-WW II secular debt cycle has been occurring for 7-9 years while most economists have only recently recognized it.
BC,
US oil consumption is lower than it was in 1979, while GDP is 150% higher and manufacturing is 50% higher.
If you want to go by correlation, oil has been bad for US growth: US GDP growth was lower in the 2nd half of the 20th century (the plateau of the “Age of oil”) than it was in the first half. It was lower in the 1st half (the growth phase of the “Age of oil”) than in the 19th century (the age of coal).
Oil dependence is bad for the economy, bad for our climate, bad for our security, and bad for democracy (think Saudi kings and Koch oligarchs). It’s time to kick that addiction.
Nick G, how much of the reported GDP is due to increasing debt to wages and GDP, gov’t/GDP, and so-called “health care” (18% of nominal GDP, 25% of private GDP, and an equivalent of $24,000/household)? How much of the associated debt service, gov’t, and “health care” costs to GDP is now prohibiting further growth of real final sales per capita?
We replaced energy-intensive goods production and capital-deep labor product with unprecedented debt to wages and GDP, cheap imported goods with US foreign subsidiaries’ production, and non-productive services such as “education”, gov’t, and “health care”.
We “exported” valued-added goods-producing jobs and energy-intensive production, leaving us with debilitating debt to wages and GDP and capital formation to GDP back to the levels of 20-25 years ago. The energy costs to GDP so many claim we have saved were transformed into “rentier taxes” from imputed compounding interest costs from increasing debt to wages, profit, and gov’t receipts in perpetuity, as well as insufficient capital formation to grow real final sales per capita.
Now we are dependent upon increasing extraction of $100 oil fewer Americans can afford to burn, AND we are left with a debilitating private and public debt service burden to wages and GDP that will constrain growth of private investment, employment, purchasing power, and gov’t receipts for a generation.
BC
Do you agree that we now have an output gap?
Nick G, the output gap, if any, is much smaller than assumed because of secular demographic drag effects and the permanent drag effect from Peak Oil and excessive private debt and debt service to wages and GDP.
Similar to Japan, the new US and EU trend for real GDP per capita hereafter is closer to 0-0.6% from 2007-08 than the historical average of 2%. By 2020, the US will have lost ~40% of real GDP per capita growth since 2000 that otherwise would have occurred had the long-term trend continued after 2000.
The resulting loss of growth of real GDP per capita, employment, purchasing power of wages, savings, and gov’t receipts will have severe consequences for the Millennials’ standard of living and that of their children over the course of the next generation.
secular demographic drag effects…excessive private debt and debt service
Conventional economists take into account aging baby boomers and deleveraging after a credit crunch. What have you identified that isn’t in conventional economic models?
the permanent drag effect from Peak Oil
That’s unrealistic. Oil has no magical powers that can’t be replaced by other kinds of motive power. A Prius or a Leaf takes you to work just as well as a Tahoe. A Tesla gets you there rather faster than it’s competition.
“[G]asoline prices are just part of the story. The lack of growth in miles driven over the last 6 years is probably also due to the lingering effects of the great recession (high unemployment rate and lack of wage growth), the aging of the overall population (over 55 drivers drive fewer miles) and changing driving habits of young drivers.”
Gasoline prices are likely the overwhelming part of the story.
Let’s consider CR’s assertions in turn.
People don’t want to drive anymore.
If this were the case, then we would expect that on-road diesel and gasoline sales would have fallen faster than other oil applications like flying, heating homes, and using oil products in industrial and other uses. The reality is just the opposite.
On-road diesel and gasoline consumption, from 2005 to 2013, are down -1% and -4%, respectively. Every other oil product category is down more, a typically by a substantial margin. Asphalt, -41%; Fuel oil (including heating oil), -40%; Distillate to power sector, -57%; Jet fuel, -15%. On the other hand, ethane/ethylene product–related to natural gas liquids production–is up 48%. The data speak to dramatic substitution for oil or a reduction in consumption across the board–except in road transportation.
To believe that driving tastes have changed, one would also have to believe that flying tastes had changed even more, and home temperature preferences even more than that. How plausible is such a scenario? Far more likely is that drivers are desperately struggling to hold on to mobility, and they are cutting back (or the downstream industry) is cutting back on virtually every other petroleum product in an effort to sustain on-road mobility. (See slides 37-38 of the presentation: http://energypolicy.columbia.edu/sites/default/files/energy/Kopits%20-%20Oil%20and%20Economic%20Growth%20%28SIPA%2C%202014%29%20-%20Presentation%20Version%5B1%5D.pdf)
In addition, we can see that new car mileage was increasing faster than CAFE standards, suggesting that oil prices, not standards, were the binding constraint on consumer purchase behavior. (Slide 36.)
And we can see that, if prices fall at the pump, as they did in October and November, then demand can come soaring back. The US added 5% to its oil consumption in about six weeks when gasoline prices were low. There’s plenty of latent demand out there.
Older folks don’t want to drive
Here again, the data is unsupportive. The relative probability of purchasing a car for every older ten year age group (45, 55, 65, 75 year old cuts) has risen, while that of each 18-44 year old group has fallen. Slide 34.
Younger people don’t want to drive
Again the data is unsupportive. According to the UMTRI (Sivak), only 18.8% of survey respondents aged 18-39 without a driver’s license were employed full time. That’s a simply phenomenal statistic. Simple interpretation: No drive, no job. Moreover, the HDLI finds that a lack of job represents 80% of the reason young people are driving less. (Slide 35.)
So, we can conclude that high oil prices and unemployment are preventing people from driving.
Does GDP drive oil consumption, or does oil consumption drive GDP?
Could US oil consumption have been more had the economy been stronger? Well, we know that the oil industry invested $4 trillion in the legacy (2005) upstream oil and gas sector since 2005, and oil production has actually fallen. The supply chain was fully maxed out during this period. It’s unlikely we could have produced more, even with higher oil prices.
Shale oil has certainly been a success, but does anyone think it could have developed faster than it did had oil prices been, say, $10 higher? I personally don’t think oil prices have been the binding constraint on shale oil production in the last three years.
Thus, we’re left with a total oil supply which is largely inelastic. We could not have produced materially more oil than we did under any feasibly scenarios. In turn, if we believe this to be true, then oil consumption must necessarily be a zero sum game. Had the US consumed more, someone else would have had to consume less. Who would that have been? Well, European consumption could have plummeted as the economy there collapsed. Which it did. But then China was still drawing large volumes of incremental oil, so for the US to increase consumption, China would have to take less of the upside. And guess what, China’s year on year oil consumption growth is zero (3 mma, yoy). And US consumption has been increasing. So that’s where we’ve gotten our incremental fuel. But that pattern can persist only as long as China remains on the sidelines. It won’t be forever.
Does VMT matter?
Maybe VMT doesn’t matter to the economy. Who needs mobility? We could stop every truck and car in the country and it would have zero effect on GDP. Perhaps Nick G would endorse that view.
Oh, please. The only question is how much VMT matters, but there is no question that it is important.
Will efficiency save us?
We can roll VMT into the broader issue of oil efficiency gains. This issue is still poorly understood. Jim has mooted 2.5% as potential annual gains; I’ve said that 3% might be possible. But if I divide VMT by on-road diesel and motor gasoline sales, the improvement is pretty minimal, less than a 5% total improvement from 2005 to 2013. This represents an annual efficiency gain of only 0.6% per year, a far cry from either Jim’s or my number.
To summarize: The data suggests that high oil prices and unemployment explain 80% of the current reduction in VMT. If you believe that GDP is driving jobs and oil consumption, then you must believe that i) oil production could have been higher and could respond better in the future (ie, the US could increase consumption without another country decreasing theirs); or ii) that the US can consistently win the market share game against other countries for incremental oil; or ii) mobility doesn’t matter for GDP, or iii) that other areas of the economy can offset flagging mobility, ie, efficiency gains can be greater elsewhere, thereby making oil not a binding constraint on GDP growth.
I think on aggregate the data show a country starved of oil, with good reason to believe this is holding back economic growth.
To believe that driving tastes have changed, one would also have to believe that flying tastes had changed even more, and home temperature preferences even more than that.
Why? Declining consumption in those areas are due to efficiency and substitution, not changing preferences, or turning down the thermostat. Airlines have become more efficient (e.g., increased flight/seat occupancy), and home-owners are insulating and switching to NG and heat pumps. How does the pace of change in those areas tell us anything about driver preferences?
Far more likely is that drivers are desperately struggling to hold on to mobility
It’s pretty clear that personal transportation modes (or the lack thereof) in the US are not driven by a need to economize. The average new car sells for 2.5x more than the lowest vehicle price, and the distribution of sale prices shows diminishing demand at the low end of prices – in other words, Nissan sells 2.5x as many Elantras as Sentras, Toyota sells more Camry’s than Corollas, and about 10x as many Camry’s as Yarises, etc, etc. Yearly depreciation of vehicles is far higher than is accounted for by increasing repair costs. It’s very clear that consumers are not being driven by necessity or deprivation in their vehicle and transportation choices.
we can see that new car mileage was increasing faster than CAFE standards, suggesting that oil prices, not standards, were the binding constraint on consumer purchase behavior.
“Binding constraint” is an odd phrase. It suggest some kind of poverty-driven coercion. I’d frame it this way: no one wants to pay more than necessary, however much money they have (unless we’re talking luxury goods, of course…). So, people resist paying more than a certain amount for oil, and they start switching to better and cheaper alternatives.
The US added 5% to its oil consumption in about six weeks when gasoline prices were low. There’s plenty of latent demand out there.
“latent demand” is an odd phrase. Demand hasn’t changed, just prices. How about something along the lines of “consumers moving along the demand curve”?
Simple interpretation: No drive, no job. Moreover, the HDLI finds that a lack of job represents 80% of the reason young people are driving less.
Those two statements appear contradictory. If the HDLI finds that a lack of a job is the primary reason for driving less, then low youth-VMT is the result of unemployment, not the cause. So, it’s: no job means no drive.
Thus, we’re left with a total oil supply which is largely inelastic.
That doesn’t answer the question of whether GDP drives oil consumption or vice versa. It just repeats your unstated assumption that GDP is limited by oil supplies.
Who needs mobility?…Perhaps Nick G would endorse that view
Indeed. Freight doesn’t need oil. Rail uses 3x less, and can be electrified. Shopping doesn’t need oil: order online (local trucks drive far fewer miles, and can be electrified). Socializing doesn’t need oil: use Facebook, instead of cruising the mall. Commuting doesn’t need oil: use electric commuter trains (I do – I only drive about 2k miles per year).
an annual efficiency gain of only 0.6% per year
Yes, personal driving isn’t affected by oil prices as strongly or as quickly as one might think. But, it will get there. Hybrid electrics, extended range electrics, EVs are all falling in cost every year. One day soon we’ll look around and say: “wow, old-style cars just can’t compete, can they?”.
Luxury car makers can’t compete *right now*. High powered electric motors are fundamentally much cheaper than high powered ICE engines, which offsets the cost penalty of relatively expensive batteries.
To summarize: The data suggests that high oil prices and unemployment explain 80% of the current reduction in VMT.
Your slide doesn’t include high oil prices: it says unemployment alone explains 80% of the reduction in VMT.
you must believe that…
You don’t include the choice of increasing efficiency in transport. That’s easy: rotation towards under-utilized high mileage vehicles; movement to hybrids, EVs, etc. Heck, carpooling alone could reduce personal transport fuel consumption overnight (not conveniently, but it would work).
the data show a country starved of oil, with good reason to believe this is holding back economic growth.
If an activity becomes not worth doing because fuel costs have risen from $.20 per litre to less than $1 per litre, it simply isn’t worth doing.
That last sentence should note first that the data we’ve looked here doesn’t support the argument that the economy is “starved” for oil. But even if we stipulated that it did, if an activity becomes not worth doing because fuel costs have risen from $.20 per litre to less than $1 per litre, it simply isn’t worth doing.