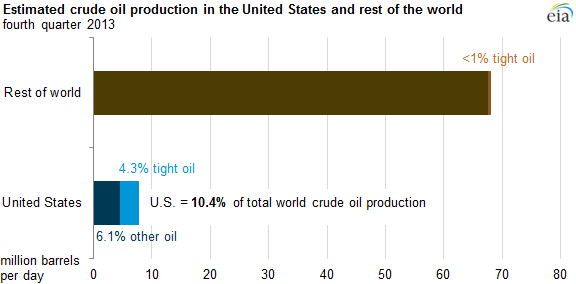
Oil produced from tight formations in the United States inaccessible before the days of horizontal fracturing is now accounting for 4.3% of total global crude oil production, according to new estimates released by the EIA last week.
Source: EIA.
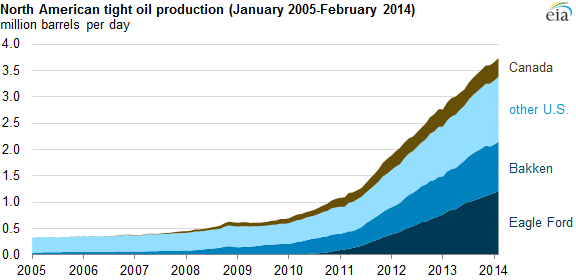
Most of the tight oil production is coming from the Bakken in North Dakota and Eagle Ford in Texas, though 340,000 b/d is now also being produced in Canada and 120,000 b/d in Russia.
Source: EIA.
But this does not mean a flood of new oil is about to come on market. If it were not for the new tight oil, total world field production would be lower today than it was in 2005. And the new stuff is expensive. Chevron CEO John Watson last month said “Essentially, for a company like mine and many others, $100 a barrel is becoming the new $20 in our business”. And even with these elevated prices, Royal Dutch Shell; recently gave up on its large investments in Texan tight oil after concluding they couldn’t make a profit.
New production from tight formations drove the price of natural gas below the point at which it was profitable to produce. We’re still in the process of correcting that, and I expect natural gas prices to continue to rise from here. That same cycle of undershooting the sustainable price could replay in oil markets.
We’re used to thinking of a technological advance as something that enables us to produce better products at a lower price. Accessing tight oil formations using fracking is an important technological advance. But it’s clearly a much inferior source of energy compared to the days when we could just drill a few hundred feet into the earth and the oil would come gushing out. And anyone interpreting the recent trends as signaling that we’re about to return to that kind of a world is misreading the true meaning of what is happening.
“But it’s clearly a much inferior source of energy compared to the days when we could just drill a few hundred feet into the earth and the oil would come gushing out. And anyone interpreting the recent trends as signaling that we’re about to return to that kind of a world is misreading the true meaning of what is happening.”
Amen, brother Hamilton.
http://www.exergy.se/ftp/exergetics.pdf
Exergetics (quantity AND quality) matter, especially in terms of the rate of growth of net energy per real final sales per unit time per capita.
As such, the US has extracted 30-35% of proven reserves in the space of ~5 years, with proven reserves reported at 10 years’ worth of extraction/consumption/exports, i.e., an extraction/consumption profile that exemplifies the “Seneca cliff”.
Moreover, the destination of the fastest rate of growth of refined petroleum product exports since 2010-11 is . . . China, which is to say US supranational firms’ subsidiaries and contract producers in China, in addition to the Anglo-American imperial military’s energy requirements abroad.
At the current rate of extraction/consumption/exports of light/tight oil and refined products, the US (and the world) faces a net exergetic crisis of log-linear limit-bound constraint accompanying public and private debt service and fiscal constraints to wages and GDP no later than 2017-2021, and a non-trivial probability that the crisis point occurs as soon as 2015-16.
This is occurring with petroleum production per capita having declined 10-11% since Peak Oil in 2005, and the rate of change of growth of grain production and utilization per capita at a precarious juncture that threatens half or more of the world’s population that must spend ~33-50% of income for food and cooking oil.
Moreover, the profile of the petroleum production per capita of the world has now reached that of the US in the mid- to late 1970s, the point at which the US experienced the onset of peak real wages, deindustrialization, financialization, and the resulting unprecedented debt bubble to wages and GDP. However, this time around, China-Asia is encountering the once-in-history global peak of petroleum production per capita with the price of oil at $100 versus the constant-dollar price of oil in the US in the 1970s at $45-$50.
More troubling still, when the US reached the similar level of real GDP per capita in 1929-30 as has China today, the constant-dollar price of oil was $15, and the US had a population of 9-10% of that of China today.
Global growth of real GDP per capita is done, only we collectively don’t know it yet, and economists, CEOs, politicians, Wall St., and the financial media influentials employed and vetted by the former cannot tell us this, for obvious reasons.
Regrettably, at $100 oil, the US and the world can no longer afford to build out an “alternative energy” infrastructure AND simultaneously maintain the fossil fuel infrastructure to sustain such a build-out, AND sustain growth of real GDP per capita in the process.
The net exergetic capacity to sustain the western standard of material consumption per capita does not exist for the West, let alone for the rest of the world hereafter.
That’s not unrealistic. Liquid fuels just aren’t that necessary: freight uses about 10%. More than 50% is used in the US for relatively low value personal transportation: commuting alone in SUVs, and recreational travel. In China, electric vehicles (scooters) outsell gas vehicles.
The US could reduce it’s liquid fuel consumption in months with aggressive fuel taxes and car-pooling measures. There is an enormous surplus of fuel available: over 50% of US liquid fuel is used to move an average of 1.15 people per vehicle at 23MPG. Raise that to 2.3 people and 30 MPG, and you reduce overall fuel consumption by 30%. Of course, such measures would be inconvenient, but that’s far from falling off a “Seneca cliff”.
Finding the energy to make hybrds and EVs will be easy. There’s very little liquid fuel used to manufacture vehicles, not that all that much in other kinds of energy (mostly electricity, which is abundant), and electric vehicles don’t take more energy to manufacture.
Just properly price oil, and consumption would fall far faster than available supplies. And we’d all be more prosperous.
Oops – that first sentence should read “That’s not realistic.”
And that doesn’t include many real costs, called externalities because they’re not properly accounted for.
Those costs include security, such as the $2 trillion Iraq war; continuing US military costs related to the ME around $250B per year; pollution, including NO2, particulates, CO2, etc.,etc.; homeland security costs like TSA and private security (private security in the US outnumbers official sworn officers!); and low level anxiety for many millions of people (yes, that’s one reason why there are so many police procedurals on TV – they reassure people that someone has all that danger under control…).
I’d roughly estimate that European taxes on personal transportation fuel are about right: about $1 per litre ($4 per gallon US).
Oil consumers and importers would be more prosperous, and safer, if they were to dramatically reduce their oil consumption.
http://www.theguardian.com/environment/earth-insight/2014/mar/28/global-market-shock-oil-crash-2015-peak
I’d say that article makes my case: oil dependency is dangerous, and the faster we transition away from oil, the better. Here’s a quote from the article:
“Despite its serious tone, The Energy of Nations: Risk Blindness and the Road to Renaissance, published by the reputable academic publisher Routledge, makes a compelling and ultimately hopeful case for the prospects of transitioning to a clean energy system in tandem with a new form of sustainable prosperity.”
“Oil consumers and importers would be more prosperous, and safer, if they were to dramatically reduce their oil consumption.”
http://www.csmonitor.com/USA/Society/2013/0911/Face-of-US-poverty-These-days-more-poor-live-in-suburbs-than-in-cities
http://www.pbs.org/newshour/bb/nation-jan-june14-povertysuburb_01-11/
http://www.washingtonpost.com/blogs/wonkblog/wp/2013/05/23/poverty-is-now-growing-twice-as-fast-in-the-suburbs-as-in-the-city/
https://www.youtube.com/watch?v=Vf8jvSPA3XQ
https://www.youtube.com/watch?v=UDxahkQUiQE
Nick G, the oil-, auto-, debt-, and suburban-/exurban-based, increasingly globalized, economy is a dead end for economic well-being for a growing share of the US population, and most especially Millennials who cannot hope to afford the “American Dream” because they can’t even expect to be a “working man” (or woman) to secure the after-tax and -debt-serve income to covet “the dream”.
That the Millennials can’t afford the “American Dream” means that neither can they afford to fund out of after-tax and -debt service wages the imperial military, Social Security, Medicare, Obummercares, “education”, “health care”, financialized housing, and the mass-consumer economy in general.
I’m not quite sure how these articles relate to this discussion. The articles say things like “since 2000, the number of poor people living in suburbs has grown by 65 percent….The main explanation for this shift is simply demographics. Many more Americans have moved to suburbs in recent years, and that growth included low-income residents and new immigrants.”
I’m struck by the poor single mother, driving an SUV. She should have bought a fuel efficient vehicle, long ago. Likely she was misled by people who claimed cheap gas was coming back.
I agree that an oil-based economy is slowly dying. The new, more prosperous, cleaner, safer electric economy is being born.
er…. the Iraq War only cost about $500 Billion. A small sum compared to what the US has spent under Obama, even if we just count 2010-present.
But yes, oil consumption should fall. Through free-market means.
Darren: I don’t know where you are getting your numbers. Even using current dollars, direct expenditures in the Iraq theater of operations exceeded $800 billion. See this post which references US government documents. Not included are interest costs associated with cumulated expenses, nor are future VA costs.
Here’s an estimate of 2.2 trillion, excluding debt costs.
http://costsofwar.org/sites/all/themes/costsofwar/images/US_Budgetary_Costs_of_the_Iraq_War%5B2%5D.pdf
Through free-market means.
Exactly what I’ve been arguing for. Oil products should bear their full cost including pollution, security, and supply risk. Otherwise, they’re being subsidized.
Prof. Hamilton
I believe you are overstating the case when you wrote;
“We’re used to thinking of a technological advance as something that enables us to produce better products at a lower price. Accessing tight oil formations using fracking is an important technological advance. But it’s clearly a much inferior source of energy compared to the days when we could just drill a few hundred feet into the earth and the oil would come gushing out. And anyone interpreting the recent trends as signaling that we’re about to return to that kind of a world is misreading the true meaning of what is happening.”
The combination of new and old technology is still producing a better product at a lower price compared to the next best available product. Please note that this is true in general as well as the specific. Example of a lower price than in the past – computer memory. Example of a higher price than in the past – new life saving drugs. But all still meet the test of next best alternative.
It is not an inferior source of energy, it is the same source that modern technology has found better and greater use out of each barrel.
A question. What would be the price of the product in the good old days if in those good old days we used as much as we do today?
The true meaning today is the same as it ever has been. Competition and the consumer will control the price of a product. The price will rise and fall until the next best alternative meets or beats the price . Scarcity is a basis of economics.
Ed
Ed Hanson: Perhaps I should be a little more precise in using words. Certainly we are better off with this technological improvement than we would be without. I instead meant to be addressing the perception many people have that improving technology means that each generation will be wealthier and better off than the one before. I believe that tight oil is an example where improving technology does not necessarily have that implication, because it is only partially offsetting another dynamic factor, naming declining resource base.
James,
I think you’ve been getting a perspective that’s unduly influenced by the oil industry. They naturally think that the world can only run on oil, and that Peak Oil means The End of The World As We Know It.
If oil were properly priced to include externalities, high cost oil might very well get no interest at all. Instead, oil consumption would be lower, and older, lower cost fields might well suffice. At the same time, higher efficiency and electrification of transportation would provide better and less expensive substitutes for high priced oil.
We *don’t* have a declining energy resource base. We are surrounded by an abundance of affordable energy: it’s only a question of our ingenuity in taking advantage of it. For instance, current human energy consumption is very roughly 12 terawatts. Well, the sun bathes the earth in 100,000 terawatts of continuous, very high quality energy!
The English in Roman times were surrounded by coal. Why didn’t they use it? It took time to develop the ingenuity to take advantage of it. In the same way, we’re surround by wind, solar and nuclear power. They are scalable, affordable, high energy-ROI, etc., etc. Their cost is declining quickly – they’re already affordable, and well on their way to being truly cheap, in a way that fossil fuels never truly were.
You’re a proponent of free markets. Well, those markets are bringing hybrids, EVs and solar power pretty quickly. Proper pricing would accelerate things greatly.
The world as we know it has already ended. Or didn’t you notice that?
So, the world ends with neither a bang, nor a whimper, but a ringtone?
——————————————————-
Seriously, Steven, you’re going to be need to be more specific, because I’m not seeing signs of the apocalypse. If you’re referring to the slow recovery from the Great Recession, i’d ask: have you read a book called “This Time Is Different”? It makes a pretty compelling argument that this is just like many credit crunches in the past, which were marked by slow recoveries.
You don’t see problems with high structural unemployment (or low labor force participation), stagnant wages, high energy prices, recurring recessions in Europe, and sky high national debt?
To me, this is a qualitatively different economy than it was in 2007. It is leaner and harder. I can tell you that my family is worse off financially than it was five years ago: wages have not kept up with expenses, and we have a top 4% income. I don’t know how the average person gets by.
As for recoveries and RR, why not check out the US GDP growth rates in the 1930s? I seem to recall they were around 7%, even allowing for the 1937 recession. And the 1990s, Euro examples are of limited value, I think. The fall of communism required the wholesale micro level reorganization of the European economy, which took from 1990 to 1997, at least in Hungary, where I spent that period. In any event, US private debt started growing strongly in Q4 of last year. If your hypothesis is right, we should see the resumption of normal growth pretty soon. The data will tell us soon enough.
You don’t see problems….
Of course – that’s the slow recovery. But, again, have you read “This Time is Different – 800 years of Financial Folly”?
Stagnant wages are related more to lack of unions and increasing income inequality: GDP is growing, but wages aren’t. All the extra income is going to the 1% (or .1%).
Recession in Europe is partly the slow recovery, partly the structural problems caused by the Euro.
Sky high debt is, of course, due to the credit crunch. I’d agree that oil imports contribute to the trade deficit. That, of course, is in the process of being fixed: oil imports have fallen by 55% in the last 6 years or so.
Regarding the Great Depression, keep in mind the depth of the crash, before recovery started. Another good example is the Long Depression from 1870-1890.
And, no, I wouldn’t predict fast growth soon – even with credit growth, I believe the credit crunch analysis suggests a looong slow recovery.
On the other hand, I repeat: oil is expensive, dirty, and risky. . The transition away from it is being delayed by those industries that produce and use it (as principally represented by the Kochs). As long as we’re dependent on it, we’ll have problems.
Question: What might be the biggest con job in world history?
Answer: The ongoing efforts to convince us that the increased liquids production from the by-products of natural gas production and from biofuels means that global crude oil production has not peaked.
Definitions:
C+C = Crude + Condensate
Crude oil = Generally defined as oil with an API gravity of 45 degrees or less (per RBN Energy)
Condensate = Generally defined as liquid with an API gravity of more than 45 degrees API (up to 75 degrees API)
NGL’s = Natural Gas Liquids (ethane, propane, butane, etc.)
Condensate and NGL’s are by-products of natural gas production. And the key question, when we look at the increase in global crude + condensate production since 2005 is what percentage of the increase is from condensate, and not actual crude oil production?
I don’t think it’s an unreasonable expectation that global condensate production increased at about the same rate as the rate of increase in global NGL’s and at about the same rate as the rate of increase in global gas production, but unfortunately we don’t have a global data base for condensate production or for crude only production.
2005 to 2012 Global Data (EIA, rounding off to two significant figures):
C+C: 74 mbpd to 76 mbpd (+0.4%/year rate of change), an increase of 2 mbpd
Condensate: ?
NGL’s: 7.6 mbpd to 9.1 mbpd (+2.6%/year rate of change)
Dry Processed Gas: 270 BCF/day to 328 BCF/day (+2.8%/year rate of change)
Crude Oil: ?
12 OPEC Countries (Crude only) 2005 to 2012 (OPEC data), accounting for 43% of Global C+C production:
31 mbpd to 31 mbpd (0%/year rate of change)
In my opinion, the OPEC countries, accounting for 43% of global C+C production in 2012, are a pretty good representation of global crude oil production. Note that the EIA data for OPEC C+C production are consistent with what they show for the global increase in global C+C production. So, OPEC shows no increase in crude oil production for the OPEC 12, while the EIA shows a small increase in C+C production for OPEC.
In my opinion, it’s a near certainty that we have not seen a material increase in global crude oil production since 2005, as the annual price of Brent crude oil prices doubled from $55 in 2005 to the $110 range from 2011 on, and virtually all of the increase in global liquids production since 2005 has been from byproducts of natural gas production and from biofuels.
An RBN Energy article on condensate:
Neither Fish nor Fowl – Condensates Muscle in on NGL and Crude Markets (February, 2012)
https://rbnenergy.com/Neither-Fish-nor-Fowl-Condensates-Muscle-in-on-NGL-and-Crude
Hi Jeff,
For Texas from 1993 to 2009 the condensate output was about 8 barrels per MMCF of GW gas based on RRC data.
Using the numbers in your comment above for wordwide Natural Gas and assuming Texas is representative of the World (probably not) this would amount to about a 0.5 MMb/d increase in condensate output over the period in question, to account for the actual increase the worldwide condensate to GW gas would need to be 4 times higher if there was no increase in Crude output.
Also I realize that for the world natural gas I am including both GW gas and casinghead gas (associated gas). So for Texas the number would be a little lower than 8 if all natural gas had been included so this estimate was pretty conservative. I will try to do a similar calculation for OPEC, which may be mor representative of World condenstate prodection per MCF of Natural gas.
I don’t know if it’s accurate or not, but presumably based on 2010 data, RBN Energy estimated, in early 2012, that condensate accounted for 11% of global C+C, and then we have a 20% increase in global gas production from 2005 to 2012. If we assume, using the RBN Energy data, that the condensate percentage was about 10% in 2005, about 7.4 mbpd, and then take into account a 20% increase in gas production from 2005 to 2012, it would suggest something like a 1.5 mbpd increase in condensate production from 2005 2012.
Also, if we take the OPEC data at face value, and rounding to two significant figures, countries that accounted for 43% of global C+C production in 2012 showed no increase in crude oil production from 2005 to 2012. And of course, the increase in US condensate production since 2005 would fall in the other 57%. Also, the implied increase in OPEC condensate production (based on OPEC and EIA data) was about 1.0 mbpd from 2005 to 2012. As noted above, the total increase in global C+C production from 2005 to 2012 was 2.0 mbpd.
If we use OPEC, accounting for 43% for global C+C production in 2012, as a model for global production, i.e., assuming that they are approximately representative of global production, it would imply no increase in global crude oil production from 2005 to 2012, with a condensate increase of about 2.3 mbpd (100% divided 43%) X a one mbpd increase in condensate production.
Texas has shown such a large decline in GOR that it’s hard to pick a GOR to use, but the crux of my argument is that global condensate as a percentage of global C+C has increased, as global dry processed gas production increased by 21% from 2005 to 2012. Of course, you agree about an increase, but the question is, what was the magnitude of the increase in the Condensate/C+C Ratio?
Incidentally, thanks for the Texas RRC crude oil and condensate data.
As noted above, RBN Energy estimated in early 2012 that condensate as a percentage of global C+C was 11%, presumably based on 2010 data.
The data you provided showed that for Texas in 2005 condensate as a percentage of C+C was 11.1% in 2005 and 15.3% in 2012*. As also noted above, I am assuming a Condensate/C+C ratio of about 10% globally in 2005, which would imply condensate production of about 7.4 mbpd globally in 2005.
To get to 9.4 mbpd of condensate production in 2012 would require an increase in the Condensate/C+C ratio of only 2.4 percentage points, from 10.0% in 2005 to 12.4% in 2012, or a 24% increase in the ratio, versus the 38% increase in the ratio that we saw for Texas, from 2005 to 2012.
Or in the alternative, globally, if we saw a 38% increase in the Condensate/C+C ratio (assuming 10% in 2005), condensate production would have increased from 7.4 mbpd in 2005 to 10.5 mbpd in 2012, an increase of 3.1 mbpd, implying a crude oil production decline of about 1.1 mbpd from 2005 to 2012.
*44/393 in 2005 to 109/712 in 2012 (million barrels per year)
For those of us of a certain age, actual crude oil is the stuff that Jed Clampitt* found.
*Beverly Hillbillies, “Black gold, Texas tea”
https://www.youtube.com/watch?v=NwzaxUF0k18
James:
1. I still remember you talking about 200 oil back in 2008. Did you ever face up to that bad prediction?
2. Shale gas has been much more substantial an economic impact from fracking than on oil. If you poopoo gas, then you’re not being unbiased. And you’re also not being sophisticated in assuming peak oil/gas or cornie oil/gas.
3. Shell is a single company. Who cares. It’s a fluid market. Lots of firms, some succeed some don’t.
4. Knowledge drives the cost curve to the right. Depletion drives it to the left. That’s obvious. Deciding which wins requires analysis of the specifics. But just saying “oooh look, depletion” is not high content.
5. I wonder why you are predicting an overshoot in oil? Very different features in terms of storage, in terms of global pricing and in terms of the small fraction from US fracking.
6. I would love it if we could break the cartel though…
Nony: (1) You’re sitting here on an archive of 8 years of real-time statements and predictions of mine. Please provide a link in support of what you claim to “remember.”
(5) Nor did I predict in the current post an overshooting in oil price. I said that did happen with natural gas and could replay with oil prices.
One strategy some people favor for debating is to make up something the other person did not say and then assert that such a position is biased and unsophisticated.
“One strategy some people favor for debating is to make up something the other person did not say…”
And that’s a good indicator they don’t have a strong argument of their own.
5. Well, why are you speculating that it may happen? The dynamics are very different (local market as opposed to global), hpb drilling frenzy, etc. I’m not saying it’s impossible…but it seems less likely, if only for the % difference LTO to overall crude as compared to NA shale gas versus NA overall gas. A crash would seem to be more related to fracturing of the cartel, anticipation of shale spreading, etc. IOW more systemic issues as opposed to overdrilling. Heck LTO is pretty measured and can turn/off on a dime. Look at what happened in 2008 in the Bakken.
1. Give me a minute (or more). I don’t keep this stuff on my computer like the archivist.
http://www.politicsforum.org/images/flame_warriors/flame_40.php
(But I’m not lying…I remember your comments.)
“2. Shale gas has been much more substantial an economic impact from fracking than on oil. If you poopoo gas, then you’re not being unbiased. And you’re also not being sophisticated in assuming peak oil/gas or cornie oil/gas.”
US incremental shale oil production is 3 mbpd x 365 days x $110 barrel = $120 bn
US incremental shale gas production is 16 mbpd x 365 days x $4.5 mmcf = $26 bn
If I allow the US benefit to be the cost savings on all US natural gas consumption, then 71 bcf/day x 365 days x $4 / mcf savings = $104 bn
Shale oil is probably more important than shale gas overall. It is far more important to the trade deficit, as almost all of the shale oil production has displaced imports.
“3. Shell is a single company. Who cares. It’s a fluid market. Lots of firms, some succeed some don’t.”
Shell’s problems are not unique, but affect all the IOCs to varying degrees. Thus, at risk is deepwater, Arctic and LNG activity. If Shell can’t make money in the Eagle Ford, you have to wonder about the economics for other producers.
“4. Knowledge drives the cost curve to the right. Depletion drives it to the left. That’s obvious. Deciding which wins requires analysis of the specifics. But just saying “oooh look, depletion” is not high content.”
Capex per barrel has been rising 11% per year net of technology improvements. Shell’s opex costs have also been rising at that rate. Oil prices are flat. It’s not hard to see which side is winning.
“6. I would love it if we could break the cartel though…”
What do you mean? Do you mean, “Make Saudi Arabia produce 15 mbpd”?; do you mean “Force the Argentines permit international companies to frack there without requiring some partnership with YPF”?; do you mean, “Invade Venezuela and kick Maduro out”?; or do you mean “Implement the FAA in Iraq”? I am a bit lost as to what your specific policy suggestions are and which part of the “cartel” you would like to break.
“If Shell can’t make money in the Eagle Ford, you have to wonder about the economics for other producers.”
Mr Kopits, you can continue to rely on the old and stagnant energy companies ( Shell does not impress me much)
or those whom were there first to spud wells…You of anyone should know, that the mainline oil companies
were the last to embrace and commit to shale oil..
“Capex per barrel has been rising 11% per year net of technology improvements. Shell’s opex costs have also been rising at that rate. ” How about a link, please..? Again, you refer to Shell, who is not a pace setter in the Eagle Ford play nor another frack play.
In the Bakken, well cost are down by around 20% over the past five or six years…The cost of fracking has also decline in the past two years as well…
Hans –
Capex costs come from Barclays semi-annual E&P survey. Opex come from Shell’s annual financials, from the associated spreadsheet, my calculations.
Keep in mind that three absolutely fantastic years of shale oil growth have increased global oil production by 3 mbpd. The oil majors produce 14 mbpd. We still don’t know if the independents actually make money in shale oil. By and large, they still don’t in shale gas. So, I’m all for shale oil and gas. I think it’s great. But the majors remain an important part of the story, and frankly, many of the NOCs have the same cost issues as the majors. I would not be so quick to write off the big boys.
2. Very additive point about the $$ value. Thanks…wan’t really what I was talking about but interesting. My point was that LTO plays have less impact on crude price than gas does on gas prices. Also, that at current production, gas has decades of run room. Oil is much more temporary. Overall my point is don’t be an unthinking pessimist or unthinking optimist. The shale oil and gas situations have differences. It’s possible for one to have more (less) legs than the other.
3. The plays are getting drilled so the value is there. And by companies who have to access the public equity and debt markets to justify themselves (not some huge internal cash supply). So that shows market confidence. Shell got in late and has screwed up management. CLR and EOG are making out just fine. I’m sure they prefer being in the Bakken to being in Kashagan! 🙂
4. Good points and better explication. Heck, just the current high price helps that argument. Seguing: I would love to see some analysis of CAPEX per barrel from 1950 to present. A broad view and discussion of the industry evolution and comparing to price. When did the CAPEX costs go through the roof? How did we have cheap oil from 1985 to 2005? Is there some cartel effect on this situation?
6. I don’t have a canned answer. I’m just tossing it out to think about. Let’s say we determine that an effective cartel is causing $100, when an ineffective one would lead to 40. Well, if that is the case, then our policy ought to be in the direction of trying to get the 40. After all, we had the 20 years of cheap oil from 1985 to 2005. And this was even after a lot of investments were made that were counting on the high late 70s price remaining (remember synfuels?)
At a minimum, encouraging US production as a destabilizer is an idea. (It seemed to work in the 80s, e.g. removal of price controls). Even if the boom turns off (as happened to Texas in the 80s), we still benefit from a crash. Some things we could do here: approve Keystone, approve LNG terminals, allow drilling on continental shelf, allow exported crude, allow Alaskan drilling, etc. In terms of international stuff, I’m not advocating invading and stealing people’s oil. Just that we should consider the dimensions of the cartel stability (and desirability of free completion of suppliers) in our foreign policy. Like, no more sanctions please. And why do we have to make it our business to stop the Libyan crude tanker. Again, I’m not sure all the dimensions and I’m not advocating theft…but I do think we should think about our interests and not do counterproductive things.
“The plays are getting drilled so the value is there. And by companies who have to access the public equity and debt markets to justify themselves (not some huge internal cash supply). So that shows market confidence. Shell got in late and has screwed up management. CLR and EOG are making out just fine. I’m sure they prefer being in the Bakken to being in Kashagan!”
You’re outlining the problem exactly. Investors were willing to throw money at shale operators as the “next big thing”, without requiring dividends or positive cash flow otherwise. Why? Because it is assumed that all cash will be invested in growth, and that growth will eventually lead to profits or dividends. Put another way, for high growth companies, investors are willing to value revenues or potential revenues, rather than profits or dividends. In this respective, the shale operators were treated roughly as, say, Facebook or Twitter.
At some point, however, investors may require dividends and not have much confidence in growth. This is exactly where the IOCs find themselves, and what changed in 2013. This in turn leads to cost cutting, asset sales and “capex compression”.
We don’t really know whether the majority of shale operators are profitable. Their free cash flow as a group in the last two years has been negative. So maybe shale is a very profitable business, maybe not. We’ll find out when the investors demand the companies to be net cash flow positive, But until that time, the shale operators will have some license to operate as a Ponzi scheme: assume debt, issue equity, drill, produce volumes and revenues, but little or no profits or free cash flow; on the basis of increased revenues, assume more debt, issue more equity, etc.
It’s not just about fundamentals; it’s about perceptions.
What is the “true cost” of the tight oil adjusted for the efficiencies in use of that oil since the “good old days?” Certainly, the low hanging fruit is mostly gone, but that simply means that the marketplace has adjusted for the less available, more costly raw materials. How about natural gas? Today’s highly insulated homes with super-efficient furnaces are a far cry from those built in the 1940s.
Sure, one can focus on one aspect of the marketplace… the raw materials… but that hardly accounts for the dynamics of the marketplace in the distribution and use of those raw materials. When wood was the chief source of heating and was available readily and cheaply, how quickly did the technology for burning that wood advance? One could speculate that the same would have been the case for oil if we were awash in oceans of the stuff.
Why not follow the logic of this discussion onto the merits of serious investments in birth control?
In the future countries with zero or negative population growth will be laughing at the likes of the US and India. As for Africa and S. America….
And that is before climate change hits crop yields.
Japan and Germany have negative population growth. Are they laughing at the US?
Much of population growth is already built in, notably through the simple increase in life expectancy, much of it in Africa. Here’s Hans Rosling’s presentation on the matter. A must watch: https://www.youtube.com/watch?v=fTznEIZRkLg
Climate change, to the extent it is happening, has both negative and positive aspects. The growing season has lengthened in the US, if I recall correctly, and will do so in Canada and Russia, to very important providers of grains.
Climate change, to the extent it is happening, has both negative and positive aspects.
The scientific community disagrees. For instance, the American Physical Society “strives to be the leading voice for physics and an authoritative source of physics information for the advancement of physics and the benefit of humanity”.
Their current statement about Climate Change is as follows:
“The evidence is incontrovertible: Global warming is occurring. If no mitigating actions are taken, significant disruptions in the Earth’s physical and ecological systems, social systems, security and human health are likely to occur. We must reduce emissions of greenhouse gases beginning now.”
That’s a strong statement.
See http://www.aps.org/policy/statements/07_1.cfm
Climate Change & crop yields????? AR5 has backed down from several previous claims, (i.e. species extinctions, and climate sensitivity, etc) Crop yields continue to increase and a greater portion is use for fuel production. the biggest and most easily documented changes due to climate change is the increased death rates due to “fuel poverty” caused by the misplaced belief in ACO2 climate impacts.
The ignorance is astounding!
BTW, when will we decide that alternative nuclear energy will ever be safe and clean enough? We must also thank the Russians for forcing W. Europe to look at its own natural (not solar and wind) resources for energy production. Fracking and local supply will be much faster than any outside source.
I agree. The ‘trim the population’ cult is insanely marinated in their own groupthink.
I notice that the ‘population should shrink’ cult happens to be comprised of people with mortgaged houses, who intend to depend on Social Security and Medicare when they retire. The irony…..
Birth control, Population control, and Climate control; am I
watching CNN news with Wolf Blitzer?
There has been a lot of talk lately about a coming population bomb but that really doesn’t seem to be a problem, on current forecasts.
Not sure why you claim that negative population growth would be a good thing. It just means a country with a very large share of pensioners and a relatively small and shrinking number of working-age adults. In other words, huge economic troubles. The germans are worrying about dying out(because of negative population growth), they certainly aren’t laughing
Even if climate change were to decrease crop yields, there is more than enough arable land to support the worlds population. If its farmers were to use modern(Western European/US) technology, Africa alone could provide for the 10 billion people the earth is estimated to have by year 2100.
So spaceship earth can always add more people?
No population anywhere can ever decline without dire results?
And Africa isn’t really a mess and you would love to live in Nairobi or Lagos?
And this is the best of all possible worlds?
” I instead meant to be addressing the perception many people have that improving technology means that each generation will be wealthier and better off than the one before. ” -JDH
JDH, you are implicitly assuming that cheap energy has been somehow overall beneficial to the USA in recent years. Historically, there is no question that cheap energy has been on net beneficial despite the collateral damage. Recently? Not so much.
Cheap energy has caused all kinds of problems. Among others, America’s apparent reputation for willingness to kill innocents in order to secure energy. In what can be characterized as an emerging information technology-based economy, human capital becomes the key scarce resource. Cheap energy policy-induced recessions do not help.
This terrorist reputation that the USA enjoys might keep the USA ‘safe’ in the near-term, but otherwise appears to penalize American firms working in South America for example, and appears to be one of the biggest threats to US hegemony and all the privileges that come with being unequivocal top dog. Colonial violence ultimately destroyed the European powers. The same will occur to the USA.
“Cheap energy has caused all kinds of problems. Among others, America’s apparent reputation for willingness to kill innocents in order to secure energy.”
You must be referring to the Federal governmental unit..
“Colonial violence ultimately destroyed the European powers.” Westslope, could you give an example?
“Colonial violence ultimately destroyed the European powers.” Westslope, could you give an example?
Inter-power rivalry: WW I and WW II.
Various wars of colonial liberation: Algeria (France), Mozambique and Angola (Portugal).
Note that the British were relatively successful by generously sharing power with local elites and then ultimately allowing increasing autonomy if not out-right national independence for a number of former colonial possessions. The British Commonwealth has been relatively successful.
These days, colonies are held for purely political reasons. All of Britain’s remaining colonies are very expensive to maintain. France may be doing better in parts of Africa but the humanitarian politics that is driving French military intervention in various parts of west and central Africa are nothing but a massive bill for the French taxpayer. For example, preventing ethnic cleansing in the Central African Republic will in the best of scenarios provide a positive return to France in about 40 years or more from now.
Westpoint, I had no idea that the World Wars was a colonial event…
Your Vietnamese’s passport has been revoked unless you attend
reeducation camp in Dien Bien Phu.
France’s loss of it’s Algeria possession had little if any effect upon
it’s power base…It was Waterloo that brought on the great decline.
As for Portugal, we have to transgress some five centuries to find
any semblance of power.
CAP, was a case of religious cleaning by Muslim lead Terrorists and
not an Archie Bunker event.
I had no idea that the World Wars was a colonial event
WWI was started in large part because Germany wanted a part of the colonial pie.
Historically the oil industry was one of very high or sunk fixed cost.
So when prices fell as long as revenues covered variable cost it paid to continue producing even if fixed cost were not covered.
But fracking has much higher variable cost and the wells have a much shorter life span –maybe just two or three years.
Consequently, this creates a floor price for oil in the $80 to $100 range. If the market price falls below this level
firms will quit drilling new fracking wells and may even shut down some producing wells.
“the wells have a much shorter life span –maybe just two or three years.”
Patently untrue.
Agreed, if anything well life is now longer.
Spencer, Interesting post.
I can readily imagine how parts of the fracking operation would drive up variable costs but have those costs gone up enough to match the costs of larger drill pads, multi-wells drilled from the same well pad, the longer pipe used in directionally-drilled wells and deeper wells, as well as the gathering and distribution pipe whose standards have improved considerably? Water treatment facilities, re-injection wells, etc., are all sunk fixed costs. Seismic studies–another fixed, sunk cost–are more sophisticated and more costly.
Then there are the social license costs that have skyrocketed in recent years. Social license costs include environmental impact assessment, community relations, litigation, and unexpected moratoria (public lands in Pennsylvania, New York state, Québec).
The good news is that tight oil will not be able to delay the shift to sustainable energy by outcompeting solar and wind.
Petroleum extraction is becoming increasing capital intensive. According to standard theory, that suggests that oil and natural gas prices will become more volatile not less. In the standard story, firms shut down when average variable costs are no longer covered. Average variable costs are increasingly a smaller proportion of average total costs.
There are a number of potential outcomes.
– firms will not only continue to produce even if the return on capital is negative, but produce at relatively lower output prices than in the past.
– the US economy could one day once again find itself vulnerable to an oil price shock.
– some investors will be caught off side when oil prices stay well below total average costs for extended periods of time just like many were caught off side by natural gas prices that dipped to near US$2/mcf
Majors like Exxon or Chevron cannot compete, and have never really been a driving force in the US tight oil/gas market. The recent US oil boom was started and is continued to be run by mostly small independent operators. With that said, EOG is set to be the largest producer of oil in the US in just a couple of years, developing only unconventional liquids rich plays. Dare I say “unconventional” resources are soon to be considered conventional. The majors need to become more lean if they want to continue to compete in the US market.
Good post, mous!
In a strange way, it is a race.
The world is producing 3x the GDP per barrel of oil, as in 1982. Businesses like Google, Facebook, etc. are energy efficient per dollar of value created.
But there is less and less oil that can be produced below $90.
So the ceiling that the world can sustain without crimping growth, is rising (currently, $110 Brent oil doesn’t scare anyone).
But as new oil has higher floors of profitability, it is in a contest with the aforementioned ceiling.
Darren understanding supply-constrained forecasting.
Darren understands supply constrained forecasting, more precisely.
How will more expensive oil slow down the growth of companies like Google and Facebook?
Caution:
Tight oil production depletes at 20%/year compared to conventional oil at about 5%/year.
Depletion and Decline Curve Analysis in Crude Oil Production, Mikael Hook
That requires a very high level of ongoing drilling – resulting in the Red Queen requiring ever increasing drilling rate to maintain production in a given field.
Mr Hagen, Mr Likevern and his Red Queen have been fully and
certifiably discredit…He is an active member of the Peak Oil
“community,” which in itself is now relegated to the House of
Laughter.
As noted up the thread, it seems very likely that global crude oil* production virtually stopped increasing in 2005 (as annual Brent crude prices doubled from 2005 to 2012), while global natural gas production continued to increase, resulting in higher levels of liquids produced with natural gas–NGL and condensate production–but no material increase in actual crude oil production.
As I have noted before, when we ask what the price of oil is, we get the price of 45 or lower API gravity oil, but when we ask about volumes, we get some combination of the volumes of crude + condensate + NGL’s + biofuels + refinery gains. It’s as if you ask a butcher what the price of beef is, and he gives you the price of steak, but if you ask him how much beef he has on hand, he gives you total pounds of steak + roast + ground beef.
Regarding the “House of Laughter,” I’m reminded of the reports that some passengers on the Titanic ridiculed the first passengers to board a lifeboat.
*45 or lower API gravity oil
JDH In the past you have argued that oil prices follow a random walk. And up to this point I think the evidence pretty clearly supports that. But my take is that some of your more recent comments sorta, kinda suggest that you might be rethinking that in light of what looks like permanently tight oil supplies. So perhaps a drift term?
Also, as easily accessible oil gets harder to find, do you think interest rates will influence production flows ala Hotelling’s rule? Again, up until now there hasn’t been any evidence of Hotelling’s rule applying to the oil market, but I find it hard to believe that this will go on indefinitely. Eventually somebody is going to catch on to the reality of ever tighter oil supplies.
Right now, they are backwarded. So it’s not even a matter of degree of following Hotelling, they are not at all showing the picture expected of a depleting resource.
That doesn’t mean that they may not over long periods of time go up (after all we’ve had several years of 80-120 oil now as compared to decades of 20-40. But it at least says the market doesn’t really think the current level is correct microeconomically. I wonder if it is pricing in some percentage chance of a crash (e.g. from OPEC falling apart).
I will have an article on this, probably later this week, at Platts Barrel blog.
As for random walk, oil prices have most certainly not been on a random walk in the last three years or so. Volatility has collapsed.
“Good points and better explication. Heck, just the current high price helps that argument. Seguing: I would love to see some analysis of CAPEX per barrel from 1950 to present. A broad view and discussion of the industry evolution and comparing to price. When did the CAPEX costs go through the roof?”
Slides 40, 41, 50.
Why not watch the whole presentation?
http://energypolicy.columbia.edu/events-calendar/global-oil-market-forecasting-main-approaches-key-drivers
“How did we have cheap oil from 1985 to 2005? Is there some cartel effect on this situation?”
The history lesson.
In 1970, US crude oil production peaked, with market power shifting to a rising OPEC. Global capacity ran out in 1973, leading to the first oil shock, and a substantial step-up in oil prices. However, demand recovered very quickly and steeply in the US following this shock, and by 1979, spare capacity was once again consumed, leading to the second oil shock. (There were political events as well.)
During the second oil shock, Saudi Arabia believed a higher price–about $100 / barrel in current terms–could be maintained. Thus, Saudi committed to defending this price with reductions in output. This had three notable effects. First, Saudi had to cut production by about 2 mbpd / year. Thus, its production fell from 10 mbpd in 1979 to 3 mbpd in 1984 (my dates might be off by a year or so). Had the Saudis stuck with a high price policy, they would have exited oil markets completely by 1985/1986.
Meanwhile, new non-OPEC supplies came on line, notably in the North Sea and Gulf of Mexico. Thus, by 1983, supply had increased by 7 mbpd (all crude) compared to 1979, the result of high oil prices.
Importantly, demand also fell. Here, Saudi (the inestimable Zaki Yamani) made a critical strategic mistake. After the first oil shock, demand rebounded sharply. However, the western countries were just reaching the top of the “S” curve, the point at which per capita oil consumption really doesn’t increase much anymore. Thus, while the market rebound had been robust after 1975; after 1979, demand simply fell and never recovered (and on a per capita basis, has not done so to this day). Saudi policy had the effect of destroying 6 mbpd of demand–in effect, permanently–by 1984. Yamani had miscalculated, and in doing so, had destroyed the Saudi economy for a generation.
In aggregate, then, by 1984 the world had 7 mbpd increased capacity and 6 mbpd decreased consumption (in effect, idle Saudi capacity), that is, 13 mbpd of spare capacity on annual consumption of 54 mbpd. This spare capacity by 1984, just four years after the start of the second oil shock, represented an astounding 25% of global consumption. That’s a huge, huge amount, and it took a generation to absorb it. And this generation has a name: The Great Moderation. (See slide 31 of the presentation.)
Had we been monitoring the situation in, say, 1982, we could have already seen that the OPEC cartel would disintegrate, and we could have predicted the timing of that disintegration with some accuracy. Clearly, Saudi Arabia would never exit oil markets just to support the oil price, so it would have been a matter of simple math to determine when Saudi would throw in the towel. Interestingly, this was never discussed in the press at the time to the best of my recollection.
Now, fast forward to 2005. There are no supply outages, but all spare capacity is being consumed and China has entered into its own motorization phase, bringing along with it other emerging economies, Brazil, Middle East, some of Africa. The demand pressures seen in the west in the 1960s were now being repeated in the east in the 2000s. (See slide 20.)
At the same time, the oil supply stalled out–in 2005–just as Ken Deffeyes had predicted, and as BC has noted, virtually to the month. Oil prices started to rise at a 25% per annum pace, bringing big profits to the oil companies and their service providers. This in turn provided cash for increased investment, and capex soared. By and large, however, this tsunami of capex was unable to lift production in the legacy (2005) system, which today produces less crude than it did then. Whereas, from 1979-1983–in just four years–the crude supply increased by 7 mbpd, in the nine years to 2014 it has not increased at all. There has been some offset with other liquids, notably shale oil and NGLs, but the legacy crude system has not held pace since 2005.
Moreover, whereas demand fell by 6 mbpd from 1979-1983, it is 6 mbpd higher today than in 2007. High prices have not discouraged consumption, and that’s because high prices are not the result of a supply outage–supply has grown, if modestly–but rather because China and other emerging economies continue to demand more oil as they grow, and because the legacy oil supply has really peaked.
So, to speak of cracking the OPEC cartel, the situation is vastly different today–virtually the polar opposite–compared to what it was during the second oil shock. The oil supply has struggled to grow, even as China demands much more oil. There is very little dispatchable spare capacity in the system, perhaps 2 mbpd in Saudi. No one is holding anything back, really.
Could the world produce more oil? Sure, if all countries were run like, say, Shell or Texas, then global production, over a period of many years, could be 15-20 mbpd higher than it is today, at least in principle. But the factors holding back Libya, Iraq, Iran, Nigeria, Argentina, Russia, Mexico, Brazil, or Alaska have nothing to do with cartel behavior and everything to do with national or local governance. That will never be solved by anti-cartel actions.
By the way, it is the first and second oil shocks–as they are primarily the result of cartel behavior and therefore artificial (a kind of controlled experiment)–which establish the values of carrying capacity for the US. If you examine these periods (as I do, in my article, “Oil: What Price can America Afford?”), you can see clearly that above 4.5% of GDP, consumers prefer to reduce oil expenditure rather than accept higher prices. This limit was confirmed in 2008, and more importantly, in 2010 and 2011, which clearly demonstrate the tolerance thresholds of the US consumer. If you know this number, then you also know how capex compression will unfold and the likely through-put of the downstream sector.
But I digress.
The situation today is not the same as it was in 1979. There is no meaningful cartel to crack today. Instead, we see the grinding economics of a China which wishes to take its rightful place in the global economy, and an oil supply which is reaching its natural limits of expansion. That’s the sober reality.
Shale oil is oil. If you want to separate out NGLs, OK. But Bakken = WTI. Within couple points of point of API and even less sulfur. Excluding tight oil smacks of excluding Gulf of Mexico or North Sea or Alaska…since they’re sort of different.
P.s. Thanks for all your replies. You are my favorite peaker.
Not sure I’d classify myself as a ‘peaker’, at least ideologically. Data leads, analysis follows.
What I can see is a collapse of capital efficiency in upstream, an inability to move the needle on non-shale / oil sands production, a huge amount of capex being committed, and an absolute train wreck in the IOC’s free cash flow and oil production situation. Offsetting that to a degree is North America unconventionals–all of global production growth since 2005–and some upside potential in Iraq and Brazil.
Among unconventionals, the Bakken and Eagle Ford are the only ones which have panned out at scale so far. These, in turn, have been unable to reduce global oil prices, even as we have seen significant conservation and substitution in non-transportation areas. And US unconventionals are likely to peak around 2016/2017 on current trends, barring some new discoveries. Meanwhile, shale plays in other parts of the world are unlikely to reproduce US success for legal, infrastructure and industry reasons.
If I project out to 2017, it’s not particularly difficult to anticipate significant supply-side pressures, barring some to date unforeseen new source of oil. Now, perhaps improving access and technological progress will save us. It could. Certainly shale oil has helped, although it has not been a game changer in aggregate global terms. (I would argue that it has been very important in national terms.) Oil prices remain near historical highs, even after three absolutely spectacular years of shale oil production growth. It hasn’t moved the needle, really.
So, I believe that the evidence on balance suggests supply remains constrained, with significant supply risks as shale growth decelerates into 2016/2017.
Does that make me a peaker? Probably more than anyone else right now. But that’s what I think the data suggests.
Systemic exergetics, the Seneca Cliff, and population overshoot are concepts to understand thoroughly as we progress hereafter during the post-Peak Oil epoch and on our way back to Olduvai. Most economists, CEOs, politicians, and financial media pundits have never heard of the concepts, and thus have no basis for understanding or having a reason to know and understand.
To the overwhelming majority of credentialed economists around the world, the ecological system (and natural resources and related stocks and flows) is a subset of “the economy”, which itself is a flawed first principle, when, in fact, the precise converse is the reality.
Growth of the “renewables” infrastructure (on which Mr. Musk’s Teslas will increasingly depend) requires growth of profitable petroleum extraction per capita AND real final sales per capita (real GDP less seasonal inventories) to sustain simulataneously the growth and maintenance of “renewable” and fossil fuel infrastructures; but petroleum extraction per capita and real final sales per capita has not grown since 2005-08.
Moreover, the doubling of US “oil” extraction since 2008 has resulted in the extraction of some 35% of US proven “oil” reserves, i.e., one definition of the “Seneca Cliff”. At the trend rate of extraction, consumption, and exports of “oil” (refined products, increasingly to China), the US is on a direct course to systemic exergetic crisis in terms of real wages to GDP and real final sales per capita by no later than 2017-20.
That is to say, the bottom 90%+ of US households (especially Millennials) can no longer afford the oil-, auto-, suburban housing-, and debt-based economy, and a cyclical decline in housing, auto sales, and real wages after taxes, debt service, and “health care” (18% of GDP and an equivalent spending of $24,000/household) is dead ahead, which will prove the point.
The TBTE banks have persuaded their central bank enablers and bought-and-paid-for politicians in DC that increasingly larger asset bubbles are the only way to avoid systemic collapse of consumer and business confidence and of nominal GDP, leading to protracted wage, price, and asset deflation, and a kind of end-game existential risk to the debt-based mass-consumer economy and society, and by extension the risk to Anglo-American oil empire. What they have yet to concede, and probably won’t until it’s obvious, is that the financial asset bubbles result in ever-growing and debilitating claims by the top 0.01-0.1% to 1% on wages, profits, and gov’t receipts in perpetuity.
As such, the net flows from value-added economic output to the financial sector and top 0.1-1% in captial income now exceeds the annual growth of nominal GDP. Not only is the US economy experiencing oil supply constraints at unaffordable prices to permit growth of real final sales per capita, the US is being subjected to an unprecedented “rentier tax” as a share of wages, profits, and gov’t receipts from the record public and private debt to wages and GDP, resulting from the hoarding of overvalued equities at no velocity concentrated to the top 0.01-0.1% to 1%.
For the few economists who understand this dynamic that has emerged and factors coalesced since 2000-2005 and 2008, the vast majority are not in the position to affirm the situation and its implications for fear of losing funding for their departments, being denied tenure, not getting on the A list for an endowment, or losing their jobs, McMansions, wives, European luxury vehicles, childrens’ private school tuition, and public or private pensions.
Growth of the “renewables” infrastructure (on which Mr. Musk’s Teslas will increasingly depend) requires growth of profitable petroleum extraction per capita AND real final sales per capita (real GDP less seasonal inventories) to sustain simulataneously the growth and maintenance of “renewable” and fossil fuel infrastructures
Nah. Car manufacturing requires very little oil. Manufacturing hybrids and EV’s doesn’t require any more energy than conventional cars – the modest energy needed is mostly electricity, and electricity is in surplus in the US. And if new things require that we need to move a little oil consumption away from current uses, single occupant SUV commuting will more than suffice as a place from which to take it.
Oh, and exactly the same thing applies to wind, solar and nuclear- we have plenty of energy (or exergy, for that matter) for building and maintaining them.
I got tired after skim reading through June of 2008 at this blog…and still had not consulted TOD posts by James either. I’ll take James’s word if I’m wrong on the remembrance of 200 oil prediction. I was sure I rememberd that around the time of the 147. Maybe it was Saniford. Meh.
BTW, there’s a bunch of other interesting stuff when you look back. Mildly amused by JDH’s white paper which had to be revised for the crash from 147 to sub-40. And then still does not have an updated version for the subsequent build back to 100. 😉
I feel mildly prescient with my 2005-2008 comments about OPEC being behind the oil price and about the possibility of resurgent production in the US (and I didn’t even know what Bakken or Eagle Ford were…just figured drilling could help and remembering how things went down in the 80s with US production as an anti-OPEC wedge disrupter).
In particular the comments about OPEC not being a functioning price-setter seem pretty flawed after we saw the 2008 episode of 6 billion barrels being withdrawn from the market and price doubled in response. If you want to say that OPEC only functions when price crashes…well that’s a pretty damned cartel action (draw the lines for what happens in free competition). Taking 6 billion barrels per day off the market, coordinating at least 3 participants, and jacking price up 2X. That’s some hard core and effective monopolist action, peeps.
Walk down the hall and talk to Phil Parker, James. He’ll tell ya about market power. 😉