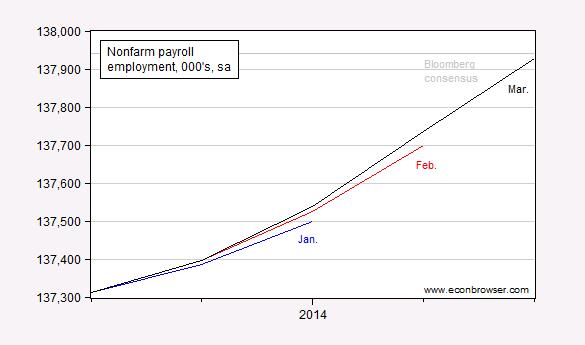
BLS reports nonfarm payroll employment up by 192 thousand, and prior months revised up.
Figure 1: Nonfarm payroll employment from January release (blue), from February release (red), from March release (black), in thousands, seasonally adjusted. Bloomberg consensus in gray (based upon 206 thousand increase, using March series observation on February employment). Source: BLS, Bloomberg, author’s calculations.
For more on the release, see Portlock/WSJ RTE Leubsdorff/WSJ RTE, Furman/CEA.

Per-capita real private non-residential investment to real final sales is not growing yoy.
Growth of per capita real private non-residential investment less private employment is not growing yoy.
Private employment will not grow faster than investment with revenues flat, costs of “health care” rising, and oil at $100.
Private investment and employment has reached a cyclical constraint.
Production will decelerate and contract yoy later this year.
Employment growth has peaked for the cycle and will rapidly decelerate hereafter.
The U rate has bottomed.
The stock market has peaked at another terminal bubble blow-off acceleration as in 2007, 2000, 1989, 1987, 1937, and 1929.
Gov’t cyclical spending as a share of final sales will accelerate hereafter by default as real final sales per capita decelerate below 1%.
The Chair will likely be directed to taper the taper, or reverse it, later this year.
And the stock market is down, not believing word from the jobs report.
Interesting. Stimulus down, austerity up, unemployment down. Even Menzie has to agree that maybe the government may not play a huge role in decreasing or increasing employment. Sometimes the private sector just needs some time to get back on track.
Anonymous, the U rate is down because of the commensurate decline in labor force participation; otherwise, the U rate would be ~11%.
Federal gov’t spending has not grown largely because of a drawdown in the spending for never-ending imperial wars and for unemployment payments; but that is about to change.
Now per-capita private investment to final sales implies that we are at a cyclical constraint for investment and employment, suggesting that employment has peaked, the U rate has bottomed, real finals sales per capita will decelerate below 1% (long-term average of 2%), and gov’t spending as a share of final sales will hereafter accelerate, owing largely to accelerating growth of drawdown by Boomers on Social Security, Medicare, Medicaid, food stamps, SSI, HUD housing vouchers for low-income elders, etc.
Consequently, there will be little or no incremental gov’t spending for “stimulus” after Boomer drawdown effects and otherwise for unemployment payments, Obummercares/Medicaid, and food stamps for Americans under age 62-65.
Thus, growth of gov’t spending hereafter, apart from spending for additional never-ending imperial wars, will be for subsistence income support for one-third of the US population, if not more, in the years ahead.