After government spending fell, industrial production, GDP, and consumption decline, and unemployment rises.
Reader Patrick R. Sullivan tries to argue that the US economy boomed immediately after the reduction in government spending at the end of World War II.
I find it useful when asserting something to have some facts at hand. Here are data showing what happened as government expenditures rose, in 1941, and as they fell, in 1945.
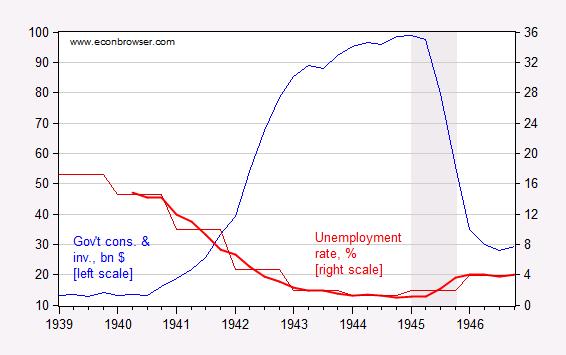
Figure 1: Government consumption and investment spending, at annual rates, in billions of dollars (blue), and unemployment rate (bold red), and annual averages from Lebergott (1957) (red). NBER defined recession dates shaded gray. Source: NBER Macrohistory database via FRED, and Lebergott (1957), and NBER.
Bottom line: Historical data indicate when government spending rose tenfold, unemployment fell from 12% to 1%; when spending fell to about 1/3 of peak, then unemployment rose to 4%.
Update, 4/5 8:25AM Pacific: Mr. Sullivan rules unemployment (as well as GDP) as meaningless during this period. Specifically, for unemployment, he writes that it’s a meaningless statistics since so many individuals are in the military. So, I will repeat this Figure from the previous post that sparked the debate — plotting GDP, employment (not unemployment), and industrial production.
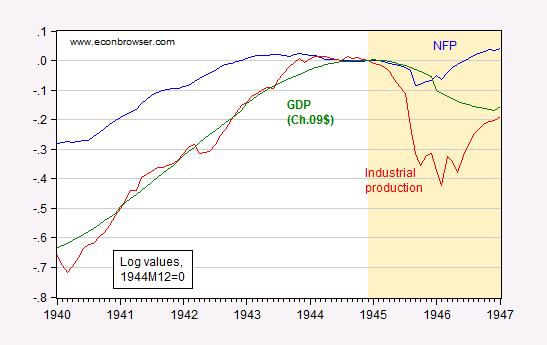
Figure 2: Log nonfarm payroll employment (blue), log industrial production (red) and log real GDP measured in Ch.2009$ (bold green), all normalized to 1944M12=0. Real GDP interpolated using quadratic-match-average. Tan shaded area is 1945 onward. Source: BLS and Federal Reserve via FRED, and Measuring Worth, and author’s calculations.
I fully expect a exegesis from Mr. Sullivan on how down is actually up for industrial production and employment.
Update, 4/5 9:25AM Pacific: Now one could define a “boom” by reference to private activity. Here is consumption expenditures, deflated by the wholesale price index.
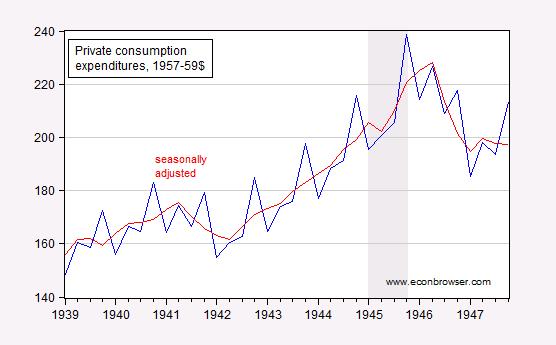
Figure 3: Real consumption expenditures (blue), and seasonally adjusted using ARIMA X-12 over 1939-64 by MDC (red), both at annual rates, in billions of 1957-59$. The deflator is the wholesale price index, 1957-59=100. Source: NBER Macrohistory database via FRED,NBER, and author’s calculations.
Note that unadjusted consumption declines after 1945Q4, and seasonally adjusted consumption peaks at 1946Q2.
These are absurd questions to raise. Between 1945 and 1950, the US had 2 recessions, something that can be found listed in wikipedia (list of NBER declared recessions). And after WWII, these recessions occurred despite an astounding backlog of consumer demand completely repressed by war time rationing. My parents, grandparents, etc. described how they couldn’t buy tires, let alone a new car, and how there was a huge rush to build houses and to convert war production to the making of everything from irons to refrigerators and washing machines. Even with this absurdly high demand and with cheap credit for turning war production into consumer production and with vast numbers of workers, the decrease in government spending obviously reduced output. And this even though large numbers of people received lump sum payments from the military and contractors at the end of the war.
Really. I have trouble fathoming the inability of people to look things up and their credulity in trusting sources they want to believe.
But then I gather Allen West has just put out a book that contains a whole bunch of quotes from Thomas Jefferson, Benjamin Franklin, Alexander Hamilton and the like which are made up. Those are again among the easiest things to fact check in the entire world. All you have to do is type them into Google and click on a few links. Heck, there’s a Jefferson Foundation that checks quotes.
Well Said, Jonathan. We are in an era when fly-by-the-seat-of-your-pants analysis can quickly be backstopped by real data. My sense would be that as government spending fell, there wasn’t a transition plan for retuning to civillian consumer production. In addition, there was likely significant worker displacement with women leaving the factories and men returning home trying to get their bearings and heading into the workforce.
Additionally, the American government was focused on rebuilding Europe and Japan with available discretionary spending. Gralhs that drop out of the sky are like videos that are posted in 30-second clips without showing the context of the full video. Get enough of these clips, put them together and you have what’s knkwn as a mashup – a clever grouping of disconnected information to make a point.
Jonathon, an excellent narrative!
IMHO, it is completely illogical to use any time frame after the WWII, until 1950.
Professor Chinn, like GM, should recall this article as it is defective and could
cause consumer harm.
Besides, these topics below to the purview of practitioners such as historical economists.
Hans: In the purview of economic historians? I didn’t know they had a monopoly — quick, somebody call Ken Rogoff and Carmen Reinhart. Well, say we restrict to the work of economic historians — does this include Robert J. Gordon’s work?
Hans,
There are two sciences: physical and social. While time enters both, it is impossible to do macro-economic research without explicitly accounting for time. To the best knowledge of modern physicists, the physical properties of the universe are timeless. There are 100s of physical laws. But only a handful of “laws” of economics. One being the law of supply and demand. But since demand is rooted in the human mind, and the human mind has evolved over time, the law of supply and demand as it pertains to humans can hardly have been constant over the eons like the speed of light.
For time series like those charted here, the historical context makes a difference. Initial conditions are at the root of this difference. At the war’s end, one important condition of many was the distribution of employment between civilian and military. Releasing millions of military from active duty caused the plunge in economic activity immediately after the war. From its Q1 1945 peak, real GDP plunged for six quarters back to nearly where it was at the start of the war. Over this span, C, I, and Ex rose, and Im declined. [Here is real consumption from the Gordon Krenn dataset for the 12 quarters 1945-1947: 4.61, 3.92, 4.65, 6.42, 7.81, 9.28, 10.01, 10.5, 10.76, 11.1, 11.32, 11.63.] This was a consumer boom within a larger slump. The slump in GDP was wholly due to the drop in G. The same thing happened after WWI. As similar as post-WWI and post-WWII were regarding length and depth of immediate slump, there were important differences. These fall under the rubric of context. And context in in a time series is historical.
It is not the history of economic thought that is important. It is economic history which piecewise connects one historically unique context to the next that’s important. And vitally so. Were government purchases to decline 77% today as they did then, it would (almost certainly) be far more catastrophic. Even though G was a larger fraction of GDP in 1945 than it is today, C and I would go in the opposite direction than they did in those six quarters after the war. That’s because (initial) conditions today are vastly different than in 1945. US culture (including but not limited to work ethic and welfare dole), the state of optimism then vs pessimism about the future today, global competition, technological opportunities, risks inherent in all the technology created between 1945 and today, and so on. Not to mention huge differences in a half-dozen or more important stock variables in the sphere of economics proper.
Although historic context makes economics far more difficult than chemistry or physics, grasping this complication is the necessary first step for the advancement of economics. Most classical economists understood this to one degree or another. But the advent of Keynes effectively lobotomized the profession. It seems the more highly trained you are in mainstream economics, the harder it is to grasp this simple yet profound point.
None of this naysays Menzie’s main point – that the instantaneous effect on growth of cutting G is negative. However, Menzie does not go far enough. He begs the larger issue which includes both short and longer-run. The full cost-benefit of deficit reduction must take into account both. That analysis is nowhere to be seen in this thread of posts and comments. Not only is historic context important. An eye on future context is important too. Best estimates out over a sufficiently long horizon must be made and time-discounted to reveal the full story. It is precisely the focus on short-term, driven by the election cycle and abetted by the Keynesian focus on short-term, that has gotten the US economy into this box canyon of abysmal growth and high debt. Predictably, the short-term fix leads to greater long-term damage, so that when the next short-term comes around it is worse than the last. Beckoning forth yet another short-term fix even more damaging to the longer-term. And so on in an ongoing spiral. Commenters like Ed Hanson try to point this out: “It is more likely than not that the output gap you like so much is the result of an over-controlling Federal government in taxation, borrowing and regulation. Less of it and you will get a more vigorous economy.” The above is a fuller elaboration of the germane and valid point Hanson is making.
Nicely done JBH!
CoRev, thank you.
I love you guys. For all out, full fledged, damn the torpedos, full speed ahead denial, there’s no topping you.
As I pointed out in the earlier thread, the unemployment rate DURING WWII was affected a bit by the fact that 12 million Americans were serving in the military. Equally affecting the rate during 1946 when 10 million of those service men were rapidly demobilized back into the civilian workforce. This in a country with a population of about 140 million.
Your problem is to explain how the civilian economy smoothly absorbed all those GIs. So smoothly that the first year post war, the rate (according to the NBER) was a mere 3.9% and dropping through the three years, until the recession of 1949. Without using the work ‘boom’.
Are we really so bad at economics–George Stigler would be appalled at the decline in rigor at Renton High School–that we can’t get it through our thick heads that, contrary to the predictions of Paul Samuelson (and others) there was almost no hitch whatsoever in the transition. Even in the face of the greatest cut in govt. spending of all time.
“[A]t the end of 1946, less than a year and a half after V-J day, more than 10 million demobilized veterans and other millions of wartime workers have found employment in the swiftest and most gigantic change-over that any nation has ever made from war to peace.”
—Harry S. Truman, Economic Report, January 8, 1947, p. 1
What started this little discussion was my original comment to Ed Hanson in which I asked him if he thought it was a good idea to cut the deficit when there was still a significant output gap. Ed Hanson replied that he could think of a few periods where that was true. Patrick R. Sullivan then volunteered late 1945 as a case in point. Patrick R. Sullivan’s response was a bit weird since he didn’t tell us what the output gap was in late 1945. We know the direction of the unemployment rate, and from that we might infer something about the output gap, but I am not aware of any actual data comparing potential GDP (or GNP as it would have been called then) to actual GDP. My sense is that during WWII the government had other things to worry about beyond collecting economic data.
Going back to Ed Hanson’s non-responsive reply, should the government cut deficits when there is still a significant output gap? No one disputes that there are plenty of times when the government should cut the deficit. For example, the mid-2000s were a period when the government should have been cutting the deficit much more aggressively than it did. In fact, we probably should have been running a surplus during those years. The CBO and BEA data show that actual GDP was above potential GDP during that period. But that was then and this is now. We are still looking at a significant output gap today. So let me repeat my original question: who thinks that it’s a good idea to aggressively cut the deficit as long as there is a significant output gap? Apparently Paul Ryan thinks so. Anyone else?
BTW, I am willing to allow for the theoretical case for expansionary austerity policies under certain conditions. For example, if a country’s major trading partners are in an economic boom and if the Fed interest rate is significantly above zero. But we don’t live in that world. Our trading partners are in even worse shape than we are and the Fed has been stuck at the zero lower bound longer than it took to defeat the Axis Powers. The way things are looking the Cubs might win the World Series before we see interest rates at normal levels again.
So, Menzie, you think Harry Truman was lying?
Boy, I’m still puzzled how the NBER could call the 45-47 period a recovery. GDP, employment, industrial production, private consumption all went down. Unemployment went up.
The fact that that things might have been expected to be even worse after a major post-WWII demobilization doesn’t really change that picture.
Well, Truman was being very political. That 10 million drawdown did not occur immediately after V-J day. A lot of troops were being kept in occupation zones after the war. In fact, throughout much of the first half of 1946 Truman was taking a lot of heat for the slow pace of the drawdown. The draft didn’t even end until 31 March 1947…well after Truman’s speech. That 10 million man (and woman) reduction didn’t actually happen until 6 months after Truman’s Jan 1947 speech. So technically he did lie. In any event, what does Jan 1947 have to do with Sep 1945?
You also overlooked the fact that after the war a lot of women removed themselves from the labor force. A lot of women resented this and it led to a law in 1946 that tried to protect women who were being pushed out of the labor force, but there were still plenty of women who voluntarily left the labor force. We don’t have labor force numbers between 1945 through 1947, but we do know that at the end of the war there were 19.2M employed women and that in Jan 1948 that number was down to 16.9M in the labor force, of which 16.3M were employed. And the evidence suggests that by 1948 the number of women in the labor force was actually increasing from what it was shortly after the war’s end. So at least 3 million of that 10 million demobilized were re-employed through simple job swaps between genders.
You also overlooked the fact that many of the men who were demobilized were not able to enter the labor force because…well, you know…wars mangle bodies and minds. Those people had to find other ways of getting by. In my family history it usually involved siblings, uncles and cousins rotating around familial households that took care of them until they could re-enter the labor force. I’m pretty sure that happened on a lot. It wasn’t always “The Best Years of Our Lives.” Think about former Sen. Robert Dole.
In any event, you still haven’t explained why it’s a good idea to aggressively cut the deficit when there is a significant output gap and interest rates are that the ZLB.
First things first, thank-you very much, Patrick R. Sullivan, for your example of post WWII expansion despite huge reduction of Federal Government spending. It fits the answer to the question quite nicely, an answer, by the way, I was mostly unaware of. Up until Patrick stimulated a start of my study of that period, I was limited on the fact of how poorly Keynesian adherents were, so wrong in their prediction of what would happen after the War, Depression.
Second. On a broader perspective. Note the silence of Mnezie on the original question. I will put this speculation out without apology, He certainly knows of instances which answer the original question. But true to the nature of the left, never give ground which might lead to weaken position(*).
Third. Not silence but a grudgingly non-answer from Slug. First he gives a negative answer, when the Government should have but didn’t, then states to possible theoretical times with example, but refuses to answer an actual instance although they are out there. No surprise.
Four. Back to post WWII. Patrick is well supported. Robert Higgs is a leading authority. My recent search for a beginning of an education of that era brought the following. <a href="http://mercatus.org/sites/default/files/publication/U.S.%20Postwar%20Miracle.Henderson.11.4.10.pdf . A short but well documented analysis of the time. Read it if you are interested in economics from different perspectives.
5. The question is still open. As demonstrated by Patrick, it is not just for Slug or Menzie. I will add a reward for taking a shot. A possible 15 minute of fame as Menzie highlights Your Name in a new post .
Ed
(*) A corollary to the rule, “No Enemies on the Left.”
Multi-dimensional decision problems are so much easier to solve, when you plot them two-dimensional, and just forget about all the other influences.
Menzie, that’s the beauty of teaching : you can forget reality and dream, dream on.
Johnny: I look forward to seeing the link to your hyperdimensional graph, which demonstrates the invalidity of my points. Or, a multivariate regression that does so; I would welcome your discussion of whether you implemented in a structural VAR, or perhaps you opted for the Cowles Commission method of identification. That would be useful, as opposed to your general attack on teachers (by the way, you should look at the cv of the people you assert are “just” teachers).
So many debates about government spending. Has anybody determined what the optimal “pump priming” level is versus the “well draining” point? There is no doubt that up to some magical point government spending stimulates the economy in the short term. When does that stimulation become electrocution? Okay, those are my two metaphors for the day.
I’ve been patiently waiting for someone in the blogosphere to remember the existence of World War 2 after thousands of references to the Great Depression. I mean, why spend all our time looking at a time that had similar problems, when we could look at a time when they found the solution to those problems: to wit, a planned economy. We wring our hands trying to figure out if QE works, or if the multiplier is larger than zero when the WW2 solution is right in front of us. Face it, if the tiny size of a Soviet GDP in the late 1980s discredited Communism, then the existence of such an economic success as WW2 discredits neoliberalism. Game over, case closed. Yes, unemployment was made lower by putting millions in the Army, just like it could be made lower by offering a governmental job guarantee. That stuff works. It is as though we’ve struggled for the past five years trying to find what solutions we could while not upsetting any of the assumptions of corporatist neoliberalism. All we’ve learned is that if you constrain a problem too rigorously you can’t solve it.
Be nice if Patrick came up with data to refute Menzies rather than resorting to “you think Harry Truman was lying”. I guess Presidents never lie.
After the war , we had the perfect conditions for the private sector to take the baton from the public , as private savings were high , debt was low , and pent-up demand was straining to be unleashed. The decline in federal deficit spending was largely offset by private sector borrowing. Nothing mysterious here :
http://static.squarespace.com/static/52c4c212e4b019e1bba20f52/52f87b66e4b0e482df7d70ed/52f87b66e4b0bae912c8e3f5/1392016231108/Chart%20Debt%20to%20GDP%20ratios.JPG
Robert Hurley
I suspect Patrick has other things to do, so until he can here are some statistics you can mull over.**
Federal Government Consumption Expenditure and Gross Investment (a statistic close to the heart of Menzie)
Between 1944 (the peak) and 1948 spending by Federal government reduced by 75%. In other terms from 44% of GNP to 8.9%, a drop of 35% points in GNP.*
Government employment, and military related industrial employment change
Between 1945 and 1947, the number in armed forces fell by 10.5 million.*
By July 1946, the number of men in the military had already dropped by 9.3 million*
Between 1945 and 1947, civilian employment by the military fell by 1.8 million*
Between 1945 and 1947, military related industry employment drop 10.2 million (to just a total of 0.8 million).*
Sounds dire doesn’t it. My God – Austerity.**
And there’s more.
GNP growth
Between 1941 and 1945 measured real GNP averaged a rise of 10.1% annually.*
In 1946 real GNP plummeted 12%.*
Oh, the humanity.**
The above is to inform you what you will hear from those who believe government must control the economy, Austerity never works.**
Now, Robert, something you asked to read.
Unemployment Statistics for the country
In 1946 the unemployment rate peaked at 3.9%*
Between September, 1945 and December, 1948 unemployment rate averaged just 3.5%.*
All those millions laid off from the reduction of government spending and yet employment was just fine
About statistics, GNP in particular (careful how they read)
In the war years GNP was rising rapidly, but you could not buy a new car or even a bicycle, forget about a new refrigerator, or a sewing machine.* Even the style of clothing was regulated.* Better not like meat too much either.* The list is long.
In 1946, people began to have things to buy, and jobs to earn the money to get them.** How do I know, I talked to my parents back when they were alive.** But that is anecdotal, so what is the statistic. What the 12% drop in real GNP doesn’t tell you, is that in 1946 real Private GDP rose 29.5%, the highest in US history.* Kind of gives you a feel to answering the title of this topic, “What Happened When Government Spending Rose … and Fell in WW II?”** The private sector, that’s you and me and millions other create wealth, and more importantly, the wealth we use.**
My earlier post a I thanked Patrick for leading me to this learning experience.** Robert, I suggest that you too, take the word from people who take the time (and risk on this blog) to challenge your preconceived opinions.** Search for what they assert, It is not hard to quickly determine if they have solid facts behind them or just blowing smoke.** Take the time for your own research, your informed opinion is of value.**
* Derived directly from The U.S. Postwar Miracle By David R. Henderson
** My opinion and words
Henderson’s working paper can be found at <a href="http://mercatus.org/sites/default/files/publication/U.S.%20Postwar%20Miracle.Henderson.11.4.10.pdf"
Ed
De nada.
Ed Hanson: Thank you for the verbose reiteration of what was largely covered in the graphs. But seriously, do you have anything constructive to say about Figure 3 which depicts the decline in private consumption in 1946. If it were a true “boom”, shouldn’t one expect consumption to have a long, continuous, upward move, especially given the pent-up demand in the aftermath of years of rationing? (And by the way, do you think your parents were the only ones alive before, during, and after WW II?)
Menzie, looking at your Figs 2 & 3 the answer is obvious. When did the war time price controls come off? What effect would that have on Fig 3 calculations if they were eased in 45-46? “By the fall of 1946, most federal price controls had been lifted. Price and production controls may have accomplished many things toward the end of the war, but they did not account for the speed and magnitude of their initial impact. With the onset of war, the American people made various adjustments to price controls that may still indirectly affect people today. ”
http://www.u-s-history.com/pages/h1689.html (Last paragraph)
So many of these arguments are circular. WWII saw a massive displacement of private money for public, rationing of consumer goods, etc. To then argue that reducing government “caused” a rapid increase in private spending is … well, if it didn’t happen that would have been because we lost the war and we didn’t. To say that reducing government at the end of WWII led to this great expansion and then cherry-picking to say “well I mean private expanded as government contracted” is misusing the English language to make one thing into another. To make this into a political statement about how reducing government leads to great things is not related to the data no matter how it is twisted around.
I can give some counter-examples. What if the war dragged on? Would reducing government spending while the war continued have led to this great expansion? If not, then what exactly is the argument being made because, surely, reducing government should always have this result. Let’s say we reduced the role of government as the war continued – to make it easy, say both fronts – until 1949. One could perhaps argue that we didn’t need to use as much productive capacity fighting the war after so many years and that let us shift resources to consumer goods, but the single thing remains: this was WWII and we put the resources into it we thought necessary to make sure we won. In other I hope simpler words, you can’t take WWII, strip out the war and use that as a parable about the size of government. It does great injustice to the war and to this country.
Ed:
Your link to Henderson does not work. At 74, I can remember a bit about the period and impact on my father’s business.; however, anecdotes are a poor substitute for statistics.
Admitting that I could be missing quite a few points here. The entire discussion around government ‘deficit spending’ seems to be quite narrow. I think the discussion is generally about spending and investment. Whether the spending and investment come from the government or from something(s) going on in the private economy is maybe not that significant if we’re discussing steady growth, a ‘boom,’ or something else; Unless someone here is proposing that a drop in spending and investment, from whatever source, is expansionary. Anyway, if the government abruptly cut its spending, and the economy didn’t tank, my first look would be to try and figure out where the replacement spending and investment came from. I don’t think anyone here is arguing that government spending is bad by itself, anymore than private spending is bad by itself. I’m one of those who think the government can put an economy into hyperdrive any time it wants, and the deficits don’t matter a whit if the increased spending increases economic output. Composition matters but where the spending comes from not so much. I sense this is an argument about whether or not government spending is good a little, a lot, or bad. And I don’t think the economy gives much of a crap about where the money comes from. If it’s good spending, it’s good. If it’s just for better scotch or for adding to the bank vault pile, then not so much. The metrics look unremarkable given the migration of labor out of wartime activities into peacetime ones. The demand dropped, but spending came from somewhere in a pretty significant way, is what I see the charts saying. Where the spending came from would be interesting and most informative.
Let’s put our thinking caps on. Anyone here ever see The Best Years of Our Lives, maybe on TCM? Near the end of that movie there is a scene that ought to shed a little light–hey, I’m an optimist–on this discussion.
I’m talking about when the Dana Andrews character wanders around the air base and discovers row upon row of mothballed bombers–B-17s, iirc. Turns out that they’re being turned into pre-fabricated housing. So, if Hollywood–and plenty of other immediate post-war movies depict the same war surplus into plowshares activity–had a clue, and the economists had the same clue…what’s wrong with Wisconsin?
Much of he activity in 1946 was a prelude to increased consumption. Americans couldn’t consume that which was in the sometimes lengthy process of being produced. Guess what happened to private investment in industry in 1946.
Btw, Menzie, where can we go to find the official, scholarly definition of ‘boom’? And how does it differ from the NBER’s definition of an expansion?
Patrick R. Sullivan: Re: the difference between a boom and an expansion. Well, if you thought 1946-48 was a boom, then you must think 2008-2010 was a super-boom. Using peaks, from 1946Q2-48Q2, nsa consumption declined 15.1% (log terms), while 2008Q2-2010Q2 declined 0.8% — and population growth was more rapid in the earlier period, so the per capita difference is even larger. And yet, let me think, let me think, who could have characterized the current recovery as “anemic”? Why, it was some fella named Patrick R. Sullivan. (This point only has an impact if one understands the concept of transitivity; my apologies if you do not).
Oh, by the way, yes seen “The Best Years of Our Lives” many times. Thanks for the plot synopsis.
I guess I missed where you explained what the professional definitional difference between ‘boom’ and ‘expansion’ is.
My previous post might seem contradictory because I believe the ‘economy’ doesn’t care from where the spending comes. But I would care to know where it came from, however.
Note the gross distortion associated with the US gov’t effectively taking over the US economy leading up to, and throughout, WW II:
https://app.box.com/s/4ccj1how2oy9hw3h9s09
https://app.box.com/s/g1qd63k4cq7vxpu6ojic
Then look at what the trend of real per-capita GDP would be without the “stimulus” from military Keynesianism for never-ending wars for oil empire:
https://app.box.com/s/qendym296b81lf9er0z4
What happens to the trend rate of real GDP per capita if the US cannot sustain the never-ending war “stimulus” owing to the net drawdown on elder transfer and other income support programs by Boomers over the next 25-30 years?
And now the Fed and its benefactor TBTE US, UK, and EU banks have created yet another real estate, corporate debt, and stock market bubble to cumulatively surpass as a share of GDP the bubbles in 1929, 2000, and 2007. Rather than a “wealth effect” that encourages and sustains productive capital formation (at the same level as a share of final sales as the late 1980s to early to mid-1990s) to create real “wealth”, the inflating asset bubbles are instead increasing rentier claims on future investment, production, labor income, and gov’t receipts in perpetuity.
Not only were the necessary lessons of the 2000-03 and 2008-09 episodes NOT learned by the principal officials in charge, the lesson learned was that larger financial bubbles are now the ONLY monetary and fiscal policies remaining in an attempt to avoid contraction of nominal GDP, asset and price deflation, and the risk of systemic implosion.
Yet, history, human nature, and exponential mathematics ensures that another 2008-09-like crisis is on the horizon, and the effect will be larger and global. It is only a matter of when the TBTE banksters pull the plug on the current bubble, which they always do.
But this is not new in the history of evolution of capitalism. We’ve been here at least five times before: “Tulipomania” in the 17th century; the South Seas Bubble in the 18th century; the first “Great Depression” of 1830s-40s following the “Era of Good Feelings”; the second “Great Depression” of the 1880s-90s of the “Gilded Age”; and the third “Great Depression” of 1930s-40s following the “Roaring Twenties”. Today’s fourth debt-deflationary “Great Depression” has been mitigated, postponed, or extended by way of unprecedented fiscal deficits and central banks’ crediting the balance sheets of TBTE banks fiat digital debt-money profits (financial profits now nearly half of all profits and 4-5% of GDP) while allowing the banks to accumulate nearly $3 trillion in cash without having to write off or mark to market non-performing “assets”; but this has resulted in an even larger global debt-deflationary risk to accumulate since 2007-08.
Tragic.
Per-capita real private non-residential investment to private employment
Real wage and salary disbursements per capita
http://research.stlouisfed.org/fred2/graph/?g=w6I
http://research.stlouisfed.org/fred2/graph/fredgraph.png?g=w6I
Unlike the the “mid-cycle pauses” during positively trending Juglar cycles in 1967 and 1986 (when the constant-dollar price of oil was $14 and fell from the $60s to the $20s in 1986) when real wages were growing around 3%, real wages and private investment per capita today are contracting simultaneously with the price of oil at $100. A toxic combination, to be sure.
While seemingly unrealized by Keynesian and supply-side economists today, cyclical effective demand constraints for private investment and labor utilization have been reached without inflation and wages accelerating, capacity utilization exceeding 80%, the Fed raising the reserve rate, short rates commensurately rising, and the yield curve inverting, which does not occur prior to demand-deficient recessions during debt-deflationary regimes, i.e., “Great Depressions”.
http://effectivedemand.typepad.com/ed/
https://research.stlouisfed.org/fredgraph.png?g=osi
https://twitter.com/wisegrowth
Ed Lambert’s work has demonstrated this process consistently well for a year or more.
In fact, despite record Fed reserve printing, deficit spending, and fiscal deficits to GDP, US money supply less bank cash assets has been contracting since summer-fall 2013 for the first time since 2009-10 and 1937-42, and three times in Japan since 1998.
Financial asset bubbles as monetary and fiscal policy by other means, and as a last resort, do not compensate for depression-like lows for labor’s share of GDP and cumulatively debilitating claims on labor, investment, and gov’t receipts by the rentier top 0.01-0.1% to 1%. The additional cost of Obummercares on Millennials, small businesses, and the self-employed only ensures less labor product and labor’s purchasing power as a share of GDP, which in turn further constrains real disposable demand per capita after debt service.
Next stop another post-bubble stock market crash, recession, and the next round of asset, wage, and price deflation. Fear not what the Fed and TBTE banksters WON’T DO in response but what they will be compelled to do to retain their self-defined credibility, legitimacy, and power to lord over the rest of us, capably enabled by the establishment rentier imperial ministerial intellectuals, otherwise known as Fed officials, economists, and financial media influentials, e.g., The Chair, Krugman, Stiglitz, Summers, et al.
Menzie,
sorry for the delay in answering your question to me about Figure 3. But unlike you I do not accept standard treatments of economic data in for years that when obvious distortions of price controls, severe shortages of accessible consumer goods, huge allocation of labor by means of government conscription, and other substantial interventions are prevalent. Actually let me restate in part, I suspect that you Menzie, as an economist, recognize the difficulties, but the blogging Menzie, chooses to put a political agenda ahead of the science. Your blog, so I accept that, but will continue to give warning to those who like me read economics blogs because of interest in a broader education.
But here is a more direct answer. Many economics studies have attempted to discern the economics in the war years and post war years. These studies recognize that past statistics are not capable of telling the true economic story. But I will focus my answer on just one. Milton Friedman and Anna Schwartz In Money Trends. *”Perhaps the most credible has been produced by Milton Friedman and Anna Schwartz. They found the official deflator for NNP to be understated by 3.7 percent in 1943, 7.7 percent in 1944, 8.9 percent in 1945, and 3.3 percent in 1946.”*. When applied to your statistics (Figure 3) would tell a completely different story. No when needs to read anything constructive to say by Ed Hanson about Figure 3. Real credible sources are out there. Sources, unfortunates, the history of your blogs show will never be referenced.
Menzie, your Figure. 3 is simplistic, inaccurate, and meant to be so.
* A direct quote found at <a href="http://www.independent.org/newsroom/article.asp?id=138", Wartime Prosperity? A Reassessment of the U.S. Economy in the 1940s By Robert Higgs. An Interesting article, with extensive references in the footnotes.
Robert Hurley, thank you, try this link <a href=http://"mercatus.org/publication/us-postwar-miracle", I hope it works better, it is worth the read.
Menzie, I have a proposal. It just might be possible that you have a copy of the Monetary History by Friedman and Schwartz. It so you do not use it. I have not found a copy I could afford. But would be glad to trade for it. I have a large group of books by and about Richard Nixon and many of those around that administration. These I would trade. Or perhaps you need some remodeling work in Madison, I have become a reasonably competent remodeler and could take the book in partial compensation, saving postal rates as I would come to Wisconsin. Or I still offer a dinner for you and yours with my wife and I next time you come to Colorado. Of course that offer has always been open, book or not.
Ed
Ed Hanson: I cannot claim to have read the entire Monetary History…, but I do not understand why you reference the use of the NNP in Figure 3 when I’m using the WPI. Why would anyone ever use the NNP deflator — which includes investment, government spending and exports — for consumption (which is what is plotted in Figure 3)?
Menzie
I referenced it to show that the basic information on prices, unemployment, and availability of civilian goods was absolutely distorted by government control. Many economic studies recognize this and have attempted adjustment to give a truer answer. You on the other hand, as best as I can tell, present wholesale prices at face value during the time of such distortions making no adjustment except to seasonally adjustment. While I do not expect you to spend years in study for a blog post, If the purpose was information and education of economics as , I would, at the least, expect reference to other studies from those who have spent those years of studies.
Ed
Robert Hurley
I was a little quick in the corrected link. Besides not including the proper HTML I neglected to write click the “DOWNLOAD PUBLICATION PDF ” button for the complete paper.
<a href=http://"mercatus.org/publication/us-postwar-miracle"
Ed
Totalitarian regimes never have a problem with unemployment. The old Soviet Union constitution guaranteed everyone a job. All such governments have to do is put everyone in the army. This is even more effective when you actually have a war because a larger army is easier to justify and killing hundreds of thousands will certainly take care of much of the unemployed.
I certainly feel more comfortable being a supply sider reducing unemployment through increasing goods and services, than being a Keynesian and sending thousands off to die to generate economic recovery.
Ricardo,
Did you oppose the US invasion of Iraq?
nick, you should not bother some folks on this blog with inconvenient truths!
It might shed some light on the subject to look at real civilian gdp, or real gdp less military spending.
…………………..%
1942……….+4.8
1943………-18.4
1944……….-14.8
1945……….+0.4
1946……… + 17.4
1947……… + 58.2
1948……… +4.2
In the post WWII period the civilian economy was coming off a plunge that was comparable to that experienced in the 1931-33 recession.
But during the 1943-45 collapse in civilian GDP income did not have a similar collapse as it rose like total GDP did.
There was a relatively small recession after the end of the war, but the personal saving accumulated during the war when consumption was artificially held down
generated a massive increase in consumer spending and a massive rebound in the civilian economy.
To a certain Sullivan is correct that the massive cut in government spending in 1945 did not damage the economy that much. But the underlying economics conditions were so unusual that their really is not many lessons to be learned from his example. The question is what would a normal economy do when it did not have the unusual savings and rationing preceding the cut in drop in government spending. Moreover, you can not ignore monetary policy that remained stimulative through out the post war period. In 1946-47 bond yields were actually lower than they had been during the war. I have no doubt that under more normal conditions the impact of a drop in government spending would be very different.
P.S. your gotcha is acting up
Spencer
Just a short comment on one paragraph. You wrote, “There was a relatively small recession after the end of the war, but the personal saving accumulated during the war when consumption was artificially held down generated a massive increase in consumer spending and a massive rebound in the civilian economy.”
That is what I thought until I read the following from the David R. Henderson working paper.
“The second part of the explanation is that people drew down their savings that they had accumulated during the war. But the term “savings” is what economists call a stock, whereas “saving” is a flow. If I draw down my savings this year, not only do I not save anything this year, but I also spend some of my stock of savings. So, if people were drawing down their savings, they would have a negative rate of saving. They didn’t. While the personal saving rate did fall substantially from a wartime peak of 25.5 percent in 1944 to 9.5 percent in 1946 and 4.3 percent in 1947, it remained positive.”
Repeat, the stock of saving was not drawn down, the flow of savings remained positive.
Learning that things can be different from the standard story came slowly me through the years. I still find that I can be surprised. If you accept what Henderson (and Higgs elsewhere), can it begin to change what you think you know?
Ed
I have to say I find this post rather amazing.
First, we know that the standard data from the WWII period is high distorted due to things like price controls and what was essentially a command and control economy. It is like saying that increased government spending has no effect on prices even when it increases massively since prices did not increase….due to price controls. But yeah, lets present data without even an attempt at disclaimers…until one is called on it.
Then we have the issue that much of the spending in question was military spending which is of dubious value to a society. Even Simon Kuznets struggled with how to count military spending. Is spending $100 million on a tank a good thing? You are dumping $100 million into something that is used to blow up other people and property. Granted having protection is a good thing, but spending on this kind of a thing is not something you’d do if you really did not have too.
“In addition, Kuznets had several insightful observations to make regarding the components of the national income and product accounts. For instance, national defense expenditures are classified as “regrettable necessities.””
— Simon Kuznets Facts
So reducing spending of a “regrettable necessity” is a bad thing? I think it should more likely be considered a good thing. We are spending less money on blowing up other people and destroying economic wealth. James was right about economists sometimes losing historical context and the original post, IMO, is an example of this. The original post is coming perilously close to making a broken window fallacy style argument.
“War prosperity is like the prosperity that an earthquake or a plague brings.”
—Ludwig von Mises
Further, Robert Higgs has done a considerable amount of work on how there was considerably less GDP once you remove military spending during the WWII years than they otherwise there would have been without the war. The U.S. economy was more of command and control economy than it has ever been. Spencer’s comment above supports this view as well. For more on this you can read more here.
Note that some of the Kuznets variants in table 2 show increases in GDP in 1946 relative to 1945 and it wasn’t until 1949 that GDP declined. Granted these are variants, but part of the point of these variants was to try and take into account the distortions due to various other government policies.