April nonfarm payroll employment surprises. The most recent trends in the labor market diverge from those of GDP.
Employment growth at 288K, reported by the BLS today, was noticeably above the Bloomberg consensus of 218K. Previous months’ data were revised upwards as well.
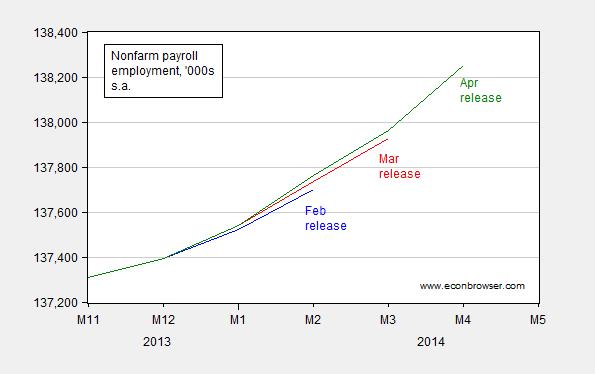
Figure 1: Nonfarm payroll employment from February release (blue), from March release (red), and from April release (green), in ‘000s, seasonally adjusted. Source: BLS, various releases.
Obviously, with the severe weather conditions experienced in half of the United States over the winter, one could wonder if the seasonal adjustment procedures were producing odd results. The seasonally adjusted and not-seasonally adjusted figures are shown in Figure 2.
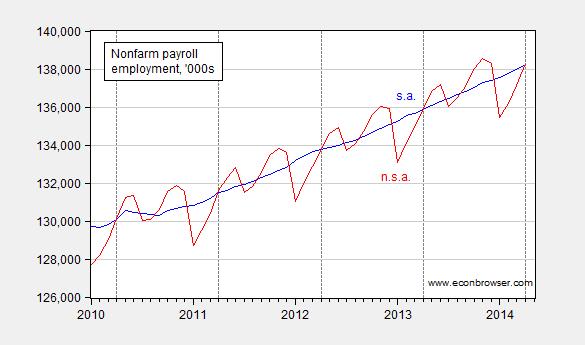
Figure 2: Nonfarm payroll employment, seasonally adjusted (blue) and not seasonally adjusted (red), both in ‘000s. Source: BLS via FRED.
In April, the seasonal adjustment factor is small, so that typically the seasonally adjusted and not seasonally adjusted series coincide. Hence, the level is not so much in question as the month on month change — that is one could legitimately wonder about the change relative to March.
On the other hand, one knows that it’s dangerous to rely upon high frequency movements in the NFP series (the 90% confidence interval is plus/minus 90K [1]; see also [2]). For those interested in the longer term changes, it’s noteworthy that the twelve month change in the seasonally adjusted and unadjusted series match exactly for April 2014.
In addition, aggregate hours worked in the private sector surged in April March, and continued to gain in April. Figure 3 depicts private sector employment and hours worked, both normalized to the previous peak, in 2007M12 (as identified by the NBER).
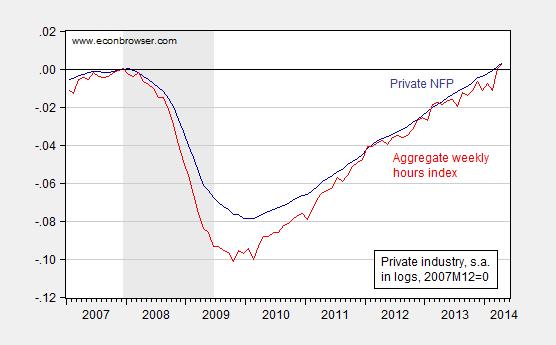
Figure 3: Log private nonfarm payroll employment, ‘000s (dark blue), and log private aggregate hours worked index (dark red), both normalized 2007M12=0. NBER defined recession dates shaded gray. Source: BLS via FRED, NBER, and author’s calculations.
Both series have now exceed their pre-recession peaks.
As noted by Furman/CEA, the growth in employment is broad based.
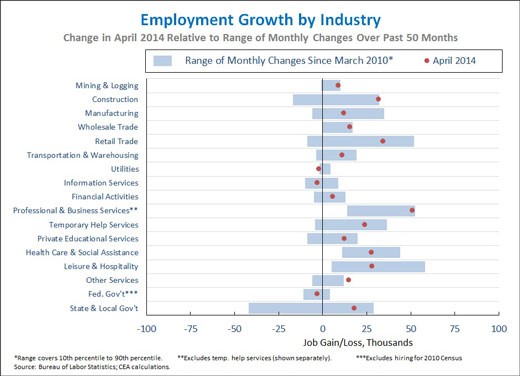
Figure from Jason Furman/CEA.
Finally, it’s of interest to note the disjuncture between recent employment trends and GDP trends. As noted by Jim, the 2014Q1 advance release indicated at minimum zero growth, q/q, and according to latest updates by Macroeconomic Advisers, negative growth.
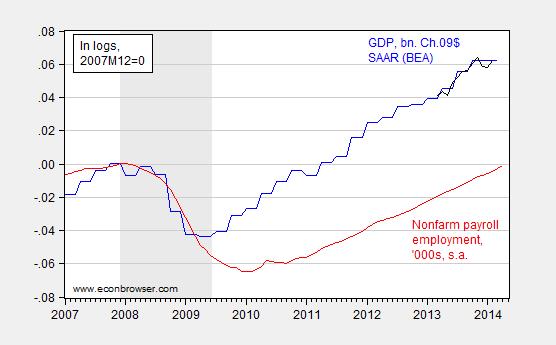
Figure 4: Log GDP from BEA (blue), from Macroeconomic Advisers (black), and log nonfarm payroll employment, s.a. (red), all normalized to 2007M12=0. NBER defined recession dates shaded gray. Source: BEA, Macroeconomic Advisers, BLS via FRED, NBER, and author’s calculations.
Figure 4 illustrates that flat GDP growth and employment in the last quarter appears a bit anomalous. However, given the variability associated with the employment-GDP link, one shouldn’t make too much of the divergence. (Note: the widening gap between trend GDP and employment is consistent with the cointegrating coefficient of about 0.62 estimated in Chinn, Ferrara and Mignon (2013), discussed in this post).
One thing to look for: March trade figures to be released on Tuesday. With exports accounting for a negative 1.2 percentage points of the first quarter growth (SAAR), surprises on this variable could have a noticeable impact on the overall growth number (the advance release uses estimates of the 3rd month trade figures).
On the employment release, see Furman/CEA, and McBride/CR. For survey of views, see Leubsdorf/WSJ RTE. More on the household survey from Irwin/NYT, and Madigan/WSJ RTE. Longer term view on household survey DeLong.
Real wages and hourly earnings less debt service and “health care” costs to wages are negative yoy, which began in Q4 2013 and is historically recessionary, at least for the income component.
Employment for age 25 to 54 per capita is not growing yoy.
The labor force declined 800,000 for the month of Apr, whereas there were nearly 1 million not in the labor force for Apr. The decline in the U rate is attributable to the decline in the labor force, which is invalidating Okun’s Law (or lowering the rate of growth required to reduce unemployment from people dropping out of the labor force).
Real non-residential investment to private employment is near 0% yoy, which historically is an indication of cyclical constraint to real final sales per capita, implying decelerating growth of investment, production, and employment hereafter.
The quarterly annualized real final sales per capita is at the post-2007 secular debt-deflationary trend rate around 0% and the post-2000 rate below 1%, which is consistent with the peak Boomer demographic drag effects and a real final sales below 1% indefinitely.
Treasuries are telling us that the economy is decelerating or in recession.
Finally, the 4-year change of the ECRI WLI is contracting for the first time since Feb 2008 and Mar and Jul 2001, i.e., onset of recessions. The stock market is no longer a leading nor a coincident indicator of recession; it is a lagging indicator since 1998-2001.
The US, EU, and Japanese economies will not require rising short-term interest rates nor a yield curve inversion to signal a future recession and bear market for stocks, as recessions and bear markets during debt-deflationary regimes of the capitalist Long Wave are not preceded by inverted yield curves. Rather, recessions occur because of insufficient growth of household and business income after taxes and debt service, which is the persistent condition today, worsening since Q3-Q4 2013 for the bottom 90%+ of US households and firms.
A very interesting read. Looking at the seasonally adjusted numbers for 2014 (See BEA GDP release), you can see that GDP for the first quarter of 2014 is down 2.5% from Q4 of 2013. This trend is quite normal though. Since 2010, GDP between the 4th quarters of the previous years has always had higher growth than the first quarters of the following years. This makes sense though, seeing as how consumption has historically always been down in Q1 because of the vast amounts of holiday shopping that has concluded, and households make less frivolous purchases. What is interesting to me about these numbers is that Fed Chairwoman Janet Yellen believes that weather can contribute to this underperformance. In a Wall Street Journal article (Link down below), Yellen agreed with the idea you expressed, believing that weather was severe enough to affect the GDP. These remarks were made by her around late February, so I think it would be interesting to look more into these numbers to see if Yellen’s theory has proven correct. Between 2010 and 2013, the Q4-Q1 GDP differential averages about a 1.4% decrease during these times. However, between the 2013 Q4 GDP and the 2014 Q1 GDP, we see a decrease of 2.5%. Based on this statistic, there is a possibility that there is in fact a weather effect on GDP growth last quarter. On top of this, domestic investment has also gone down about 1.4% between these two quarters. Exports have gone down about 1.1% , while we see imports increase .48 percent. We can also notice that there is a decrease of about .14% in state and local consumption expenditures. I think that each of these numbers could be attributed to bad weather, especially since Chairwoman Yellen believes that investment would also go down because of this weather.
Article: http://online.wsj.com/news/articles/SB10001424052702303801304579409012600892296?mod=WSJ_economy_LeftTopHighlights&mg=reno64-wsj
Watching the unemployment rate come down is satisfying, but watching the labor participation rate fall by 0.4 pp is not so satisfying. It might be fairer to calculate what the unemployment rate would be at the 66% pre-recession participation rate. Apples to apples rather than apples to cherries.
“Another hugely household depressing employment report: when the unemployment rate falls by 0.4%-points, but when none of the fall is due to a rise in the employment-to-adult-population ratio, it is very bad news indeed…”
I am amazed that Me DeLong made this admission!
One has to look closely at the BLS numbers to see how
healthy they really are…
Whether they do so or not, I am not sure…
Here is a survey of what kind of employment has
been created over the past four years…This is clearly
a phony recovery, tanks to FedZero…Or can we call it
the Food Stamp Recovery?
http://www.nelp.org/page/-/Reports/Low-Wage-Recovery-Industry-Employment-Wages-2014-Report.pdf?nocdn=1
I hope you are never in the position of having to depend on food stamps.
Mr Hurley, Asia and much of the rest of the world is talking
about work and production and we are worrying about food
stamps…Please SNAP out of it.
hans
“This is clearly a phony recovery, tanks to FedZero”
so exactly what should the fed be doing? raising interest rates?
They should do nothing (inflicting less economic pain) and
allow the market place to set interest rates rather than a group
of central planners whom have no idea what to do.
“[S]o exactly what should the fed be doing? raising interest rates?”
Start with ceasing to exist along with its benefactors, the TBTE int’l banking syndicate with the principals’ state-sponsored license to steal labor product, profits, and gov’t receipts (social goods) with impunity in perpetuity.
The Fed and its benefactors have created a situation today in which the net flows to the financial sector, i.e., “rentier taxes”, exceed nominal GDP and wage growth yoy, whereas the imputed compounding interest to total US credit market debt outstanding to term exceeds the private value-added output of the US economy forever.
US real final sales per capita cannot grow with this onerous rentier burden on labor, non-financial businesses, and gov’t.
The more the Fed prints book entry profits for the TBTE banks as a share of total profits and of GDP, and the TBTE banks get to pretend they’re solvent by not having to mark to market, the more financial markets bubble up, and the larger the imputed future rentier claims to wages, production, profits, and gov’t receipts, the slower the private sector demand, and the less productive capital is accumulated, and the poorer we become.
Someone has to say it: The TBTE banks are a thieving criminal racket that need to be put out of business, and the Fed’s job is to run political cover for the institutionalized rentier theft.
Were The Chair and her intellectual sophist peers to have any intellectual honesty and self-respect worthy of all the praise given her, she would call a press conference and come clean to Wall St., DC, corporate America, the financial media, the American public, academe, and anyone else who will listen, expose the political cover the Fed runs for the banksters’ fraud and license to steal, and announce her resignation in protest over the perpetual rentier fraud and theft by the oligarchic banksters and their Power Elite masters, parasites bleeding the US economy and society to a slow, lingering death.
BC, love your posts, as they are brilliant and a beauty to read…
The Central Bank has become nothing more than a willing tool
for the banking “community” and the central government which
it serves so well..
Has anyone notice how the establishment never questions their
motives or means…
I pity Baffing, as to answer your post will prove to be a most
difficult task…
i find it baffling how hans and bc can be so sure the fed has the rates wrong, but yet cannot answer the simple question “what should the current interest rate be?”
you both have a lot of talk, but nothing of substance to back it up. you think without a fed our interest rates will be ideal as well? you don’t think the big banks, which would still exist after the end of the fed, won’t manipulate the rates? i guess the libor scandal never occurred!
too much conspiracy theory in your worlds. your views are so unrealistic as to be naive. your “anti” viewpoint is simply clouding your understanding of reality!
bc, you are obviously against the financial sector. how does the world operate without a financial sector? while i am not a fan of the financial sector, i really don’t see a future where they simply don’t exist. you may dislike them out of spite, but unfortunately until you can develop a smooth operating world without financial firms you simply sound like a conspiracy argument.
http://seekingalpha.com/article/2188763-one-new-reason-to-ignore-the-bls-jobs-report
The bls jobs report proves one thing for sure, there is a critical election coming soon. 800,000 “leaving” the work force with over 10 million on SSI disability. With this trend by November “unemployment” should be about 4%.
FDR solved his unemployment problem by sending the unemployed to Europe to fight. Current governments have engineered a masterful technique of simply changing the numbers in the formula. Unemployment, we ain’t got no stinkin’ unemployment.
ricardo,
“FDR solved his unemployment problem by sending the unemployed to Europe to fight. ”
you ought to be embarrassed to make such outlandish statements. this is why nobody takes your comments seriously anymore. i would believe the soldiers that died in WWII, the Jews released from concentration camps, the minorities exterminated by the Nazi regime, and the rest of a now free europe would have more than words with you on such a silly political statement. your lack of respect is baffling.
I think you made a mistake on the hours worked.
……………………………………………………..MARCH……APRIL
aggregate hours private payroll……..1.13%………0.28%
weekly hours…………………………………0.7%………..0.3%
weekly payroll………………………………..0.87%…0.26%
They all show that the big month snap back was in March, not April
This would be more in line with the weather having a significant impact on February activityy.
Moreover, the monthly average earnings are in line with the big increase in March hours and a small increase in April.
Average weekly earnings of all private employees was 0.67% in March and 0.00% in April.
Average hourly earnings was 0.08% in March and 0.00 in April.
Over the last five quarters aggregate hours rose:
……………%……….annual rate
2013 I …0.79%…3.2%
2013 II..0.51%…..2.0%
2013 III..0.51%…..2.0%
2013 IV..0.37…….1.5%
2014…..0.40%…..1.6%
The first quarter index was 99.7 and the April reading was 100.4 — a 0.7% increase
This suggest we are starting the second quarter with hours worked expanding at a 2.8% growth rate.
This is less than last year 1st quarter more more than the other quarters.
spencer: You are absolutely correct — Figure 3 is correct, while I mis-characterized the surge as being in April. I have corrected the text.
“There are 58 million working-age people who are not working, and the labor force participation rate stands at 62.8 percent, the lowest level in 36 years.”