How much of the US employment shortfall is due to trend factors?
One of the central puzzles following the financial crisis and the ensuing Great Recession has been the sluggish growth in employment during the recovery which began in June 2009, given the growth rate of output (the growth rate of output is understandably low, given our knowledge of recoveries in the wake of balance sheet/financial crises). Our analysis is related to the issue of whether structural unemployment has risen in the wake of the Great Recession.
In a new paper coauthored by Laurent Ferrara and Valérie Mignon, we estimate a log-levels version of Okun’s law, so that we can specify a decomposition of employment between trend and cyclical factors. Following up on intuition laid out here and here, we implement an error correction model with nonlinear short run dynamics. While it is possible to interpret the trend factors as structural in nature, it is also possible to view our trend component in a purely statistical context.
Relying on a non-linear error-correction specification over the 1950-2012 period, we find:
- If one does not account for the long-term relationship between GDP and employment, then we overestimate employment by a substantial amount.
- A standard error-correction model is able to reproduce the general evolution of employment, but underpredicts the decline in employment during the recession, and therefore over-predicts employment during the recovery.
- Using an innovative non-linear smooth transition error-correction model (STECM), we better reproduce stylized facts associated with the business cycle.
- The nonlinear model estimated over the 1950-2007 period produces ex post historical simulation results that indicate employment is still on average 1.05% below its potential level after the recession. Some share of this mis-prediction might be attributable to structural factors.
Predicting Employment using and Error Correction and Differences Model
Assume a long run cointegrating relationship between log private nonfarm payroll employment and log real GDP:
empt = β0 +β1yt
One can estimate this relationship using a first differences specification, a first differences specification with lags, and a (linear) error correction model, over the 1950-2007 period, and then forecast out assuming knowledge of the right hand side variables. The error correction model incorporates one lag of the first differences.

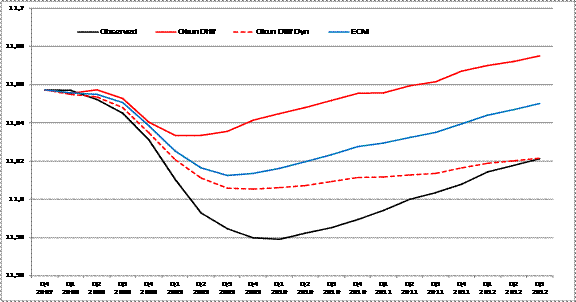
Figure 5 from Chinn, Ferrare and Mignon (2013): Conditional forecasts of log-employment stemming from linear models. Note: Conditional forecasts stemming from the model in differences (red), the model in differences with dynamics (dotted red) and the ECM (blue). Observed values are presented in the dark line.
Notice that neither first differences specifications fit the data very well. While the static first differences specification broadly matches the contours of actual employment, it overpredicts by a wide margin. By contrast, the dynamic first differences specification hits actual by 2012Q3, but missing completely the dip to trough in 2010Q1. The error correction model fits better, but still overpredicts on the order of 3% in log terms.
A Nonlinear in Dynamics Error Correction Model
Given the shortcomings of these linear models, we considered a smooth transition error correction model, wherein the short run dynamics vary depending upon the state of the business cycle (in this case, lagged GDP growth).

Where LEMP is log private employment, LGDP log real GDP, G denotes the transition function, γ is the slope parameter that determines the smoothness of the transition from one regime to the other, c is the threshold parameter, and Z denotes the transition variable. The smooth transition function, bounded between 0 and 1, takes a logistic form given by:
G(c, γ, Zt) = [1 + exp( – γ(Z t – c))]-1
Where:
Zt = 0.5 × (Δ LGDPt-2 + Δ LGDPt-3)
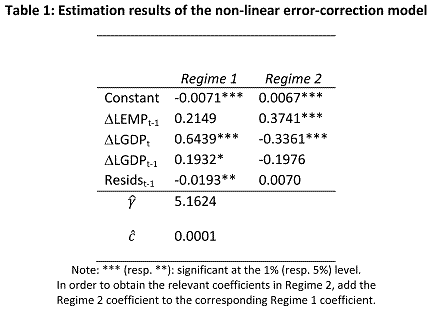
Details and references for the procedure are provided in this post. The results of estimating this over the 1950-2007 period are given y:

Most of the time, the economy is in regime 1, with regime 2 in effect usually right at the end of a recession. Estimating this model out of sample yields the following forecasts.

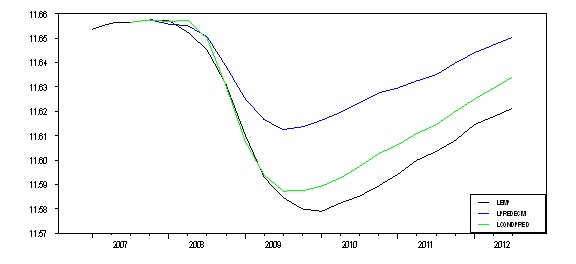
Figure 6: Conditional forecasts of log-employment stemming from linear and non-linear error-correction models. Note: Conditional forecasts stemming from the linear ECM (blue) and the non-linear ECM (green). Observed values are presented in the dark line.
The extent of mis-prediction is now much reduced. Employment is over-predicted by only about 1%.
One is tempted to conclude that the gap represents the extent of employment that is reduced by structural factors. One could do that, although the first point to recall is that the mis-prediction incorporates both structural factors (say demographic trends, skills mismatch, other policies that affect the benefit of work versus leisure) as well as model uncertainty.
In order to try to determine the source of the 1% overprediction, we estimated the nonlinear model over the entire 1950-2012Q3 sample, and then predicted employment. In this in-sample assessment, the over-prediction declines to 0.6%, suggesting that at least some noticeable share (perhaps around half?) of the 1% out-of-sample over-prediction is due to factors other than a rise in structural factors. However, this conjecture awaits further investigation.
So my answer to the question posed at the beginning: “not very much”. That conclusion is in line with most analyses, e.g., Lazear and Spletzer (2012) (see also this post).
Note that we have allowed only nonlinearities in short run dynamics. We have retained a constant employment-output elasticity over the long run. Had we allowed for time variation in the long run relationship, we might very well have obtained different results. However, the theory to validate the application of the smooth transition methods to integrated variables doesn’t yet exist, to our knowledge.
Update, May 13: Data [XLS] and RATS program now online.
Menzie
This Boston Fed article supports your claim of a cyclical rather than structural interpretation of current slow employment growth.
http://www.bostonfed.org/economic/ppb/2012/ppb123.pdf
The charts at the end of the paper show that the recent (structural) shift in the Beveridge curve is entirely explained by the unemployed with duration greater than 27 weeks. If the long duration unemployed are removed from the data, then there is no structural shift associated with the recent recovery.
The weak demand for labor is simply a reflection of weak growth with perhaps a pinch of Obamacare thrown in. We are entering the ‘look-back’ period that Obamacare will use to determine if employers are subject to ‘shared responsibility’ (fines) associated with the question of whether an employer employs 50 full-time + Full-Time Equivalent(FTE) workers.
The number of FTE’s is a function of the total monthly hours of the employer’s part-time work force. Full-time status = 30 hours per week. For example, an employer with 100 part-time workers working 15 hours per week will be categorized as a ‘large employer’ and subject to fines for not providing Obamacare approved healthcare plans.
However, the fines only apply to full-time workers. So, the firm above would pay no fines, while a firm with 50 actual full-time workers would pay fines for violations. Thus, Obamacare creates an incentive for employers to shift from full-time to part-work staffing to avoid an annual $2000 or $3000 fine per full-time employee.
If I were an employer, I would be using attrition to reduce my full-time workforce. I’d give the remaing full-time staff more hours and/or replace them with part-time workers.
Note that Obamacare applies to every employer with Full-time + FTE >= 50 workers, so even small changes at each firm will have a large impact on employment growth once the small changes are aggregated.
If employers react to the disemployment incentives in Obamacare, then Obamacare has the potential to create a structural shift in employment growth as employers begin to realize the impact of the policy on their bottom line.
Link with the metodology is not working!
Marco: Thanks. Link fixed now.
Menzie Instead of embedding an LSTAR formulation into the error correction model, would you have gotten better results if you had used a momentum threshold (M-TAR) instead? The M-TAR would allow variable amounts of autoregressive decay so that the speed of adjust could change with GDP.
tj Why do you assume that Obamacare only increases the wage bill? It may well be the case that Obamacare increases the wage bill for small businesses, but there’s also a good case to be made that Obamacare reduces the wage bill for large businesses. Small employers are acting as free riders by shifting healthcare costs onto large employers that do carry health insurance.
There may well be some fairly short-sighted small businessmen who will work overtime to avoid breaching the 50 employee threshold. But that’s shortsighted and reflects a mindset that the labor market will be forever weak. Hiring more part time workers at the expense of full time works also it increases fixed costs. And it increases the employee’s reservation wage. Finally, it effectively limits the size of a business, which reduces its value. On balance Obamacare reduces healthcare costs, so the overall effect on the economy will be lower the wage bill even if it raises the wage bill for some businesses. If you’re a small business person who obsesses about something that over the long run is a fourth order consideration, then you’re probably too dumb to be running a business.
I would like to see re-employment of capital compared to re-employment of labor. It may be that as the labor share of income dropped and as the capital share of income rose, less national income went into re-employing labor and more was directed into re-employing capital.
I see that labor income fell $400 billion from before the crisis to now. And that capital income rose $500 billion from before the crisis to now.
The issue may be as simple as seeing that there is less national income going to labor and by association, going to re-employment of labor.
2slugbaits: If you look at Table 1 coefficients, you see that the rate of reversion changes with regime, which is exactly what we wanted. So it might not be the exact parameter variation you’re looking for, but there is something of that nature embodied in the specification.
Any chance of posting some data and code? Very interesting stuff!
2slugs
I don’t want to hijack this thread and make it about Obamacare, so this will be my last post on it. All I will say is that your ‘theory’ doesn’t reflect reality and the definitions of Obamacare.
Small employers are acting as free riders by shifting healthcare costs onto large employers that do carry health insurance.
By definition, “small” employers are not subject to Obamacare. The data shows more firms in the 50 – 99 employee range than all greater firm sizes combined.
the overall effect on the economy will be lower the wage bill even if it raises the wage bill for some businesses
You claim costs reductions from Obamacare. Any cost reductions to firms are offset by an increase in turnover costs. Quits will rise because employees will be less likely to stay at a firm just for it’s healthcare package.
Hiring more part time workers at the expense of full time works also it increases fixed costs. And it increases the employee’s reservation wage.
Not necessarily. The full time workers who remain are more productive. Compliance costs associated will monitoring full time workers will be huge. At least as great or greater than any increase in costs from employing more part-timers.
I agree, the reservation wage will rise, but disagree with your reason. The reservation wage will rise because workers will have health coverage while under or unemployed, thus the level and duration of unemployment will rise ( a structural change in unemployment).
Of course a higher reservation wage will translate into a higher wage offer in equilibrium. So now we have higher wages and higher turnover costs to offset your claim that Obamacare will reduce the wage bill, which is doubtful.
TJ,
Since the thread has effectively been hijacked with the discussion of Obamacare, you may want to get your facts straight.
Employers with more than 50 fulltime and fulltime equivalents will have to offer insurance or face a penalty. However, if they offer insurance, they can avoid the penalty. Most businesses in this category (other than retail and restaurants)already offer insurance and will avoid the penalty.
Only those that are near the 50 threshold will have to make decisions about making their workforce partime, but only if they don’t want to offer insurance. They can easily avoid ALL penalties by offering a health plan and pricing it so that the employee has to pay 9% of their W2 income as their portion of the annual premium.
As for the reservation wage rising because workers will have healthcare when under or unemployed? WRONG! They will still have to have a way to pay health insurance premiums since the exchange subsidies will not cover 100%.
http://kff.org/interactive/subsidy-calculator/
I see Tim Watson has beaten me to the punch. I’d love to see code and data as well.
timwatson and Robert Bell:
I’ll have to consult with my co-authors regarding posting the code.
Menzie, is this a published paper in one of the journals? Most journals have this minimalist requirement: “Material and methods
Provide sufficient detail to allow the work to be reproduced….” Quote is from from JEL http://www.elsevier.com/journals/economics-letters/0165-1765/guide-for-authors
The reason I bring this up is because journals have been under fire for not making the source materials available to actually replicate the work, and this is often translated to be code and source data. Here’s an example: http://www.nature.com/news/announcement-reducing-our-irreproducibility-1.12852
CoRev: Well, if it were a published paper, would I post a link that doesn’t indicate it was published? No, I’d (proudly) mention it was forthcoming or published. Clearly, you didn’t click through. When I say, consult my coauthors, I mean they have the code, so they’d have to put it online.
Now, since you mention it, here are some data I do have online, pertaining to my most well cited papers: Chinn-Ito index, Aizenman-Chinn-Ito Trilemma indices, Long maturity interest rates
Since almost every statistical method I undertake is standard (either in EViews, TSP, or Stata), nobody usually asks for code.
gridlock
I’ll wait for an ACA post to point out your errors.
Menzie, I’m not trying to bust your chops, but it would have been adequate to just answer the question with Yes/No not published.
It just appears to be academic hubris, when you say this: “Since almost every statistical method I undertake is standard (either in EViews, TSP, or Stata), nobody usually asks for code.”
and the paper says this: “Third, accounting for the US business cycle by using an innovative non‐linear smooth transition error‐correction model enables a better reproduction of stylized facts, especially by taking the business cycle into account without integrating any exogenous information.”
To be clear, I can claim use of standard word processing packages to do my writing, but what is written is innovative and not standard. Otherwise, why even write the paper?
CoRev: Well, not sure what you mean by academic hubris. Oh, well, here goes: one can implement an innovative procedure (say instrumenting with a variable nobody thought of using before) using a standard off-the-shelf two-stage-least-squares routine that is in every statistical package. So, you’ll notice that I sometimes estimate error correction models; that specification is sometimes “innovative” in the context of a particular economic model, but the statistical procedure — estimating using OLS — is not.
I hope that clarifies matters in a non-hubristic manner.
Now in this specific case, the other members of the trio do have code that is not to my knowledge already available in the standard packages (although you can now do conventional regime-switching in EViews), so it’ll be up to them whether to post-online, particularly before publication.
Menzie, OK! As I said: “The reason I bring this up is because journals have been under fire for not making the source materials available to actually replicate the work, and this is often translated to be code and source data.”
It has obviously been an issue in the Life Sciences, and a growing issue in the Climate Sciences, so I was just curious. The R&R paper is an example in your field, although they showed their work.
CoRev and timwatson: data and RATS code online, links at end of post.