Last week I was at the annual meeting of the International Association for Energy Economics in New York City. One of the many interesting presentations was by Professor David Stern of Australian National University describing his research with Zsuzsanna Csereklyei and Maria del Mar Rubio Varas developing some stylized facts about energy and economic growth.
Below is one of the figures from Csereklyei, Rubio, and Stern (2014). Energy consumption per person is plotted on the vertical axis, and
GDP per person on the horizontal axis, both on logarithmic scales. Each dot represents the values for energy and GDP for one of 99 different countries in 2005. The slope of the relation implies that a country with 10% higher income than average would be expected to consume about 7% more energy than average.
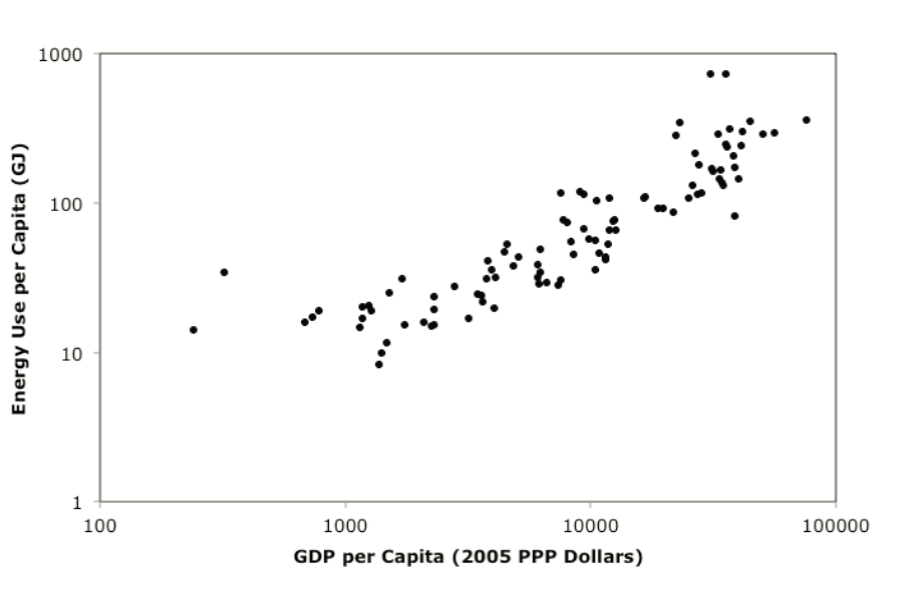
Source: Csereklyei, Rubio, and Stern (2014).
The team also put together a fun animated gif showing this relation for each different year between 1971 and 2010. You can see the scatterplot move to the right as countries become richer over time, but the relation and its slope remain remarkably stable.
Source: Stochastic Trend.
The IMF estimates that world GDP increased by 27.7% (logarithmically) between 2005 and 2013. I used Csereklyei, Rubio, and Stern’s income elasticity of 0.7 to calculate what world petroleum demand might have been expected to be for each year since 2003 if the price of oil had not risen.
These calculations are shown in the red line in the graph below. By contrast, the blue line shows actual crude oil production, which increased only 3% since 2005. The gap between the two amounts to 13.5 million barrels per day by 2013, a shortfall of about 16% (0.7 x 27.7 – 3.0 = 16.4).
![Blue line: actual world field production of crude oil and condensate, 2002-2013, in millions of barrels per day, from EIA. Red line: calculated by multiplying height of blue line in 2002 by exp(0.7 x [ln y_t - ln y_2002]) for y_t world GDP in year t, from IMF.](https://econbrowser.com/wp-content/uploads/2014/06/oil_gdp_june_14.png)
Blue line: actual world field production of crude oil and condensate, 2002-2013, in millions of barrels per day, from EIA. Red line: calculated by multiplying height of blue line in 2002 by exp(0.7 x [ln y_t – ln y_2002]) for y_t world GDP in year t, from IMF.
What happened to the 13 mb/d shortfall? Something else had to change to keep demand from rising, that something else being a rise in the price of oil. If we assume a long-run price elasticity of oil demand of 0.25, to achieve a 16% reduction in quantity demanded the change in the real price of oil would be expected to satisfy the equation 0.164 = 0.25 x [ln Pt – ln P2002]. With a price of oil of $60/barrel (in 2014 dollars) at the start of 2005, this would imply a predicted price of P2013 = 60 exp(0.164/0.25) = $116/barrel today, about where we are right now.
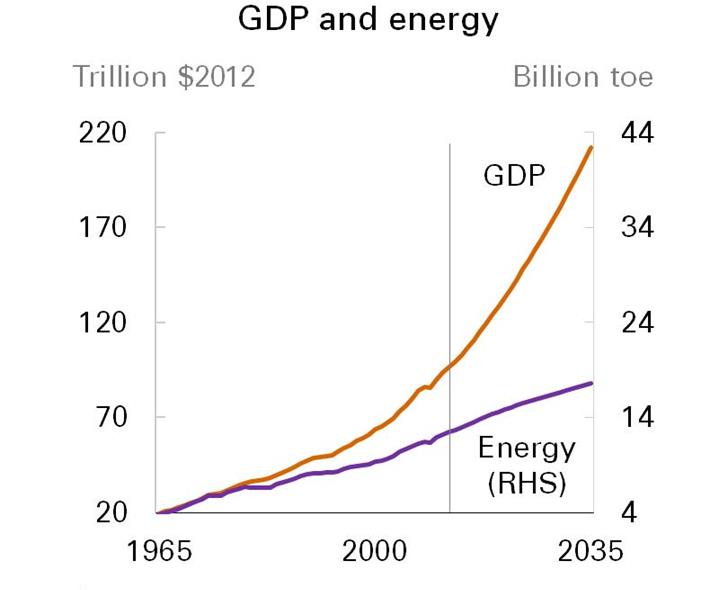
Steve Kopits (energy analyst and frequent contributor to the discussion at Econbrowser) was also at the IAEE meeting and raised an interesting observation. He noted that forecasts of the potential for future energy production by the companies that many may be counting on to meet future energy demand appear to be inconsistent with the relation between energy use and GDP growth that held for the last 40 years. For example, for the next 30 years ExxonMobil is anticipating an annual world GDP growth rate of 2.8% per year with only 1% annual growth of energy production, consistent with an income elasticity of 0.35, half the historically observed 0.7 elasticity. BP has a similar forecast.
One possibility is that GDP growth is going to be slower than it has been. Another is that energy price increases are likely to continue.
Normalized liquids consumption for China, India (2005) Top 33 net oil exporters and the US, from 2002 to 2012 (2002 values = 100%, BP Data), Versus annual Brent crude oil prices:
http://i1095.photobucket.com/albums/i475/westexas/Slide14_zpsb2fe0f1a.jpg
The BP data base shows that China’s consumption was up to 204% (of 2002 consumption) while the US, at 96%, was up from 2012, but still below the 2002 (and 2005) consumption level, as Brent averaged $108 in 2013. India was at 154%. I don’t have the (2005) Top 33 data yet.
Incidentally, William Cohen, former US Secretary of Defense, was just on CNBC discussing his concerns about ISIS triggered sectarian unrest spreading to Jordan and Saudi Arabia, and he called for a crash program to immediately militarily bolster defenses in Jordan and Saudi Arabia. He explicitly views ISIS as a threat to Saudi Arabia, and I’m a little puzzled since ISIS and Saudi Arabia royal family are both Sunnis, but perhaps ISIS regards the Saudi royal family as hopelessly corrupt. I had thought that the primary threat to Saudi Arabia was a revolt among the Shiite populace, combined with possible problems with which member of which branch of the very large royal family will become king.
Destabilization risk greater than Iraq: Expert
http://video.cnbc.com/gallery/?video=3000286417&play=1
Tuesday, 24 June 2014 9:15 AM ET
The $64 Trillion Question
Production by the (2005) Top 33 net exporters was up slightly from 2005 to 2012, but their increasing consumption caused their net exports (what I call Global Net Exports of oil, or GNE) in 2012 to be below 2005, with a sizable rate of decline in their ECI Ratio (ratio of production to consumption).
Furthermore, because of rapid increases in oil consumption by China & India (“Chindia”), what I define as Available Net Exports (ANE or GNE less Chindia’s Net Imports, or CNI) fell much more rapidly than GNE.
What happens from 2012 to 2022 is what I call the “$64 Trillion Question.”
Here are the 2012 values for the Top 33 net exporters in 2005, along with 2005 to 2012 rates of change (total petroleum liquids + other liquids, EIA, for net exports):
Production: 63 mbpd (+0.3%/year)
Consumption: 19 mbpd (+2.2%/year)
Net Exports: 44 mbpd (-0.5%/year)
Chindia’s Net Imports in 2012 and 2005 to 2012 rate of increase:
8.8 mbpd (+8.7%/year)
ANE (GNE less CNI) in 2012 and 2005 to 2012 rate of change:
35 mbpd (-2.3%/year)
If we assume that Top 33 production falls at 1.0%/year from 2012 to 2022 and if we assume that consumption continues to increase at the same rate (2.2%/year), GNE in 2022 would be down to 33 mbpd, almost a 3%/year rate of decline. Given this decline rate, unless Chindia’s consumption of GNE falls at 3%/year, or more, the resulting rate of decline in ANE will exceed the GNE decline rate, and the ANE decline rate will accelerate with time.
For example, let’s assume that Chindia’s rate of increase in net imports falls to 5%/year (versus 8.7%/year from 2005 to 2012). Their net imports in 2022 would be up to about 15 mbpd. ANE would be 33 (GNE) – 15 (CNI) = 18 mbpd (ANE), approximately a 50% reduction in the volume of Global Net Exports of oil available to about 155 net oil importing countries (versus 35 mbpd in 2012 and versus 41 mbpd in 2005). The 2012 to 2022 rate of decline in ANE would be 6.6%/year.
Jeffrey, perhaps the Saudi royals should hold a plebiscite to vote on a constitutional monarchy and free elections to determine the future of the kingdom/nation in the “21st century” (instead of the 9th-11th centuries).
No doubt the US would be enthusiastic about a democratic Saudi Arabia, which would encourage democracy breaking out all over the Middle East.
BIG wink.
If energy prices rise, that could change the composition of the graphs because it would make alternative sources more attractive and those alternative sources might then trend downwards in cost as they become widely available.
@jonathan, the net systemic exergetics per capita do not permit maintaining the necessary scale of the fossil fuel infrastructure AND building out and maintaining “alternatives” AND growing real GDP/final sales per capita.
Something has to give, and the differential calculus implies that fossil fuel production will decline with real GDP/final sales per capita, and the growth of oil “substitutes”/”alternatives”/”renewables” is coming to an end.
The larger inference is that we have reached the exergetic capacity for growth of the western fossil fuel-based, high-tech, high-entropy, colossally wasteful economic model.
There is not a single establishment economist, Wall Streeter, politician, CEO, nor financial media influential who would dare say so publicly, which means that we are collectively as a society utterly uninformed and unprepared for what is ahead.
the net systemic exergetics per capita do not permit maintaining the necessary scale of the fossil fuel infrastructure AND building out and maintaining “alternatives
You might want to quantify this. For instance, why do you think that oil is so essential, and that all of the other energy sources (including the other fossil fuels) won’t do? Why do you think that other sources are limited, or that they have low “net energy”?
Really, there’s no basis for this: all of the other energy sources (fossil, nuclear or renewable) have large resource bases, and high Energy Return on Energy Invested.
To suggest that long-run price elasticity of oil demand is linear, or stable, is highly unrealistic. There are attractive substitutes at certain price points, and those substitutes (and their equivalent price points) are changing relatively quickly.
A change in the price of oil from $20 to $80 is very different from a change in price from $80 to $140. Even with $100 oil we’re seeing rapid development of hybrids, extended range EVs (EREVs) and pure EVs. $140 oil will see much faster development of these substitutes, with an accompanying reduction in costs due to economies of scale and manufacturing experience.
Even now hybrids (with partial electric drivetrains) are less expensive than pure ICE vehicles. The cost of electric drivetrains will continue to decrease: hybrids will dominate, while Leafs and Volts etc. will fall in price, and Tesla moves into the mid-market.
Even now the superiority (in price and performance) of hybrids and EREVs will soon be clear to the average observer. That point will come much more quickly if prices rise well above current levels. At that point there will be a “rush to the exits” from ICE vehicles to electrics, and the oil market will be disrupted.
Let me clarify that I strongly agree that this article performs a great publice services: the coming supply gap needs to be pointed out as clearly as possible.
As a society we are currently foregoing great savings by not accelerating the transition away from oil. The more attention everyone gives to the need for this transition, the better.
Oil is not the only source of energy.
@Joseph: “Oil is not the only source of energy.”
Name an “alternative” or “substitute” that has a fraction of the net exergetic flow multiplier to real final sales per capita, energy return on energy invested, portability, and ease of transport and storage of crude oil.
What will be the cost of crude oil or its “substitutes” to maintain the fossil fuel infrastructure to then support the build out and maintenance of “alternatives” at necessary scale at net exergetic cost per capita to permit real final sales per capita to grow, or even avoid contraction?
How many wind mills, solar panels, wave power turbines can be produced with solar, wind, and wave power?
How many solar, wind, and wave advocates does it take to build a Tesla with the photo-electric effect and kinetic energy from moving air and ocean waves?
Name an “alternative” or “substitute” that has a fraction of the net exergetic flow multiplier to real final sales per capita, energy return on energy invested
Coal, natural gas, nuclear, wind, solar.
…portability, and ease of transport and storage of crude oil.
Electricity works quite nicely. Plugging in a car at night is much faster than stopping at a gas station.
What will be the cost of crude oil or its “substitutes” to maintain the fossil fuel infrastructure to then support the build out and maintenance of “alternatives” at necessary scale at net exergetic cost per capita to permit real final sales per capita to grow, or even avoid contraction?
Less than oil. Coal and natural gas are affordable. Wind is cheaper than new coal. Solar is affordable, and falling in price very fast.
How many wind mills, solar panels, wave power turbines can be produced with solar, wind, and wave power?
All that we need.
How many solar, wind, and wave advocates does it take to build a Tesla with the photo-electric effect and kinetic energy from moving air and ocean waves?
Not that many: wind and solar are manufactured items, with pretty good labor productivity.
Per capita energy use in the US is down for the decade, bigger trend than for oil.
http://www.eia.gov/totalenergy/
@aaron, that’s because real final sales per capita has been decelerating during the period and is at ~0%/year since 2007-08. We’re using less energy per capita in part because of efficiency gains but primarily because the bottom 90%+ are collectively poorer.
Yup.
Makes you wonder how much of our growth is real, real.
I didn’t look, but I expect energy use was up in the first quart and probably april too.
This winter probably drove increased use due to inefficiency from temperature extremes and road conditions.
International outsourcing of production probably is also a factor (and effectively increases our efficiency).
I think the part most troubling to me is the period after 2020. From there to 2035, the world is supposed to add an increment of GDP about equal to total GDP now with very little incremental energy. I have to question whether that’s possible.
@Steven: “I think the part most troubling to me is the period after 2020. From there to 2035, the world is supposed to add an increment of GDP about equal to total GDP now with very little incremental energy. I have to question whether that’s possible.”
Precisely, Steven, and it’s very unlikely. Peak Oil, population overshoot, depletion of water, arable land, forests, and fisheries, and record levels of debt and debt service to wages, profits, and gov’t receipts are the primary factors that have brought us to “Limits to Growth” and why there will not be sufficient growth of real final sales per capita hereafter to permit the realization of Nick G’s Tesla-based dream (if only it were possible).
Consequently, the shale boom/bubble is a Peak Oil-related transitory phenomenon, implying that China-Asia is 40-80 years too late to the oil-, auto-, debt-, and suburban/exurban housing-based model of economic growth.
But the top 0.01-0.1% western elites apparently have no Plan B that the rest of us could affirm (not that we’re every really asked to do, nor is it required), apart from a last-man-standing Hobbesian war of all against all for the remaining scarce resources of our finite spherical planet, culminating in an Elysium-like outcome, if the top 0.01-0.1% are lucky; and they have been so far.
BTW, as to the 2020 date, not to quibble, but the differential rates of US oil extraction, consumption, reserves, and exports imply that the point of no return for the post-Oil Age descent will begin as soon as 2017-19, so we’re within a business cycle of the wheels coming off of Oil Age civilization. But net exergetic (system’s capacity per capita to do the work of producing energy, food, and necessary goods and services for subsistence) per capita constraints and proximate effects are already being manifested at the weakest links of the global economic system of flows, notably where the populations are required to spend 35-50% of incomes on food prices, which are rising as a result of $115 oil, which is beyond the affordability of what is now half or more of the world’s population.
The more central banks expand no-cost bank reserves to the TBTE banks in an attempt to create a dubious “wealth effect”, and the more financial asset prices bubble up as a share of wages and GDP, the larger the net rentier claims to future wages, profits, production, and gov’t receipts hereafter, the slower real final sales per capita will be, and the more instability occurs at the margins of financial, economic, social, and political vulnerability in the US and around the world.
Tesla-based dream
Well, you don’t seem to be reading the new information I’m providing, but I’ll try again: Oil alternatives are cheap! Have you priced out a Nissan Leaf, Chevy Volt or Prius C lately? Take a look at Edmunds’ 5 year cost table: these are the cheapest cars on the road! As far as Teslas go, compare a Tesla to similarly priced luxury cars: it’s much cheaper to own, overall. I hear Tesla owners talking about saving $4k per year in fuel costs – Porsches get very low MPG!
Even if oil is scarce, it’s easy to manufacture electric cars: there’s very little liquid fuel used to manufacture vehicles, not that all that much in other kinds of energy (mostly electricity, which is abundant), and electric vehicles don’t take more energy to manufacture.
See http://www.greencarcongress.com/2014/05/gm-reduced-energy-intensity-and-carbon-intensity-per-vehicle-in-2013.html
Yes, Tesla eerily reminds me Dolorean.
steven, i would imagine a great deal will be accomplished by a combination of alternative fuel growth and extensive improvements in efficiency. a little example is the movement from standard incandescent light bulbs to led lights. i just replaced 8 40 watt bulbs with 8 6 watt led lights in my living room ceiling. not only am i saving on the dramatic reduction in wattage consumption, i no longer need the extra air conditioning to cool off the room from the heat given off of the incandescents. this is a little example. we have hundreds of thousands of engineers working on a whole spectrum of problems that will ultimately reduce energy consumption. the market will show money to be made from the need to reduce energy consumption, and so people we continue to work on those solutions. we just need to get out of the way and let it happen.
Bravo, Professor Hamilton! Thanks.
My own estimate for long-term real GDP/final sales per capita is within the margin of error of the deflator at around 0%, with a bias to the downside.
The US cannot grow real final sales per capita post-2007-08 (post-Peak Oil) with the constant US$ price of oil above $40-$50. At the current price of oil and oil consumption to after-tax wages, profits, and final sales, the US, EU, and Japan (and likely China-Asia, too) are at the cyclical effective demand constraint for growth of real final sales per capita, especially for real after-tax profits and incomes, and for real private investment and consumer spending.
Industrial production (IP) continues to be skewed higher by the shale boom/bubble, including growth of energy-related truck and rail transport. However, the shale bubble might be deflating, which will result in a drag on IP.
As such, post-Peak Oil real potential GDP is much slower than is currently assumed by the vast majority of economists.
Economists are likely to be quite surprised by the weakness of q-q annualized real final sales per capita for the rest of 2014 and hereafter. Stall speed for real final sales per capita is likely already occurring as of Q3-Q4 2013 to date.
The mix of energy consumption in the U.S. has changed over time. Chart:
http://en.wikipedia.org/wiki/File:US_historical_energy_consumption.png
Although, the U.S. is abundant in coal, consumption has declined substantially in recent years.
Energy growth has been in natural gas and, to a much smaller extent, in renewables (biomass, e.g. ethanol, accounts for roughly half of renewables).
It seems, to offset a decline in petroleum significantly, we need more natural gas, coal, nuclear, and, to a smaller extent, renewables, over the next few decades, along with more domestic oil production, including in the Gulf of Mexico, California, Alaska, etc..
Also, I may add, increasing domestic production of fossil fuels would create more jobs, including through a multiplier effect, to create taxpayers, instead of people collecting government benefits, while idle capital would be put to work, and oil prices would fall somewhat.
GDP would rise, and government would have more tax revenue to spend on renewable energy subsidies.
The purpose of renewable subsidies is to “internalize” the real cost of pollution, and reduce the burning of fossil fuels.
You agree that pollution is a real cost, right?
Maybe, in a few decades. There are many kinds of negative externalities.
More production of fossil fuels will employ some of the trillions of dollars of capital (earning enough for capital preservation), and employ some of the millions of unemployed Americans (collecting government benefits, including unemployment), along with paying for renewable energy subsidies.
You do agree losing $10 for $1 in net pollution savings isn’t worth it?
Maybe, in a few decades. There are many kinds of negative externalities.
uhm, yes, there are, and most of them are pretty immediate. Climate Change has it’s largest cost in the future (although I think insurers would take exception to the idea that we can ignore them), but others like asthma, mercury poisoning, Black Lung Disease, smog and acid rain happen fast. And, of course, we’re spending $100s of billions on security costs (including military and Homeland Security) to indulge our addiction to oil.
More production of fossil fuels will employ some of the trillions of dollars of capital (earning enough for capital preservation), and employ some of the millions of unemployed Americans (collecting government benefits, including unemployment)
Yes, and so would installation of wind turbines and solar panels. Actually, there’s no conflict here: just account for all of the costs of fossil fuels, allocate those indirect costs through taxes, and let the free market decide which forms of energy constitute the optimal allocation of resources.
along with paying for renewable energy subsidies.
Their costs are much, much greater. The external costs of coal are more than 10 cents per kWh, while the subsidies for wind are only about 1 cent (over it’s lifetime: the PTC ends after 10 years).
You do agree losing $10 for $1 in net pollution savings isn’t worth it?
Well, we actually save $10 in net external costs (including pollution), while spending $1 in subsidies, by going to renewables.
There has been climate change for billions of years. There’s no scientific evidence people have a significant effect on climate change.
Of course, some people believe they’re more important than they are.
Because of the tremendous rise in living standards from fossil fuels, civilization was able to afford massive and extensive regulations, make greater and faster improvements in medicine, spend and squander lots of money on renewables, etc..
The benefits from fossil fuels far exceed the costs, unlike renewable energy.
And, U.S. national defense spending as a percent of GDP was much higher before most Americans could find the Middle East on a map.
I suspect, without fossil fuels, average U.S. life expectancy would still be in the 40s.
peaktrader, there is plenty of evidence to suggest humans have an influence on climate change.
and your description of the importance of fossil fuels is a bit overstated. fossil fuels have served a purpose, but do not attribute fossil fuels as the reason for advancement. the reason for advancement is over the past 200 years, humans have finally discovered the ability to use ENERGY as a means to accomplish their tasks. natural stores of energy could be manipulated to accomplish useful work-hence the advancement of society. fossil fuels served as a convenient and easily accessible form of stored energy, but once the genie was out of the bottle regarding energy and work, there would be no putting it back. if fossil fuels were not easily utilized, we would have simply searched for another form and developed it. hydro was used to create electricity 100 years ago by tesla. many of these alternative sources would have developed more quickly and fully, except they were overlooked because of fossil fuels. but make no mistake, even without coal and oil burning, the energy age would have emerged.
There’s no scientific evidence people have a significant effect on climate change.
You’re focusing on Climate Change. The following article on coal should be helpful: you’ll see that out of 18 cents in external costs, only 3 are from climate change: Cost table on page 92 (20 of 26) includes 3.06 cents for CO2.
These other costs include occupational health costs, sulfur/acid rain, mercury in food, water consumption, etc., adding up to $.18 per kWh ($345B/year):
“The United States’ reliance on coal to generate almost half of its electricity, costs the economy about $345 billion a year in hidden expenses not borne by miners or utilities, including health problems in mining communities and pollution around power plants, a study found.
http://uk.reuters.com/article/2011/02/16/us-usa-coal-study-idUKTRE71F4X820110216?rpc=401&feedType=RSS&feedName=environmentNews&rpc=401
So, we’re agreed that external cots are very important?
——————-
There’s no scientific evidence people have a significant effect on climate change.
Now, the scientific community as a whole disagrees. Climate Change really is the international and scientific consensus. For example, here’s the American Physical Society. The American Physical Society “strives to be the leading voice for physics and an authoritative source of physics information for the advancement of physics and the benefit of humanity”.
Their current statement about Climate Change is as follows:
“The evidence is incontrovertible: Global warming is occurring. If no mitigating actions are taken, significant disruptions in the Earth’s physical and ecological systems, social systems, security and human health are likely to occur. We must reduce emissions of greenhouse gases beginning now.”
That’s a strong statement.
See http://www.aps.org/policy/statements/07_1.cfm
———
The benefits from fossil fuels far exceed the costs
The point is that there are better, cheaper alternatives.
U.S. national defense spending as a percent of GDP was much higher before most Americans could find the Middle East on a map.
No, not really. US defense spending before WWI was very, very low. It was pretty low before WWII. It rose because of the Korean and Vietnam wars, then fell again. It rose dramatically because of the Gulf Wars and the Iraq invasion, which were all about….oil.
I suspect, without fossil fuels, average U.S. life expectancy would still be in the 40s.
That’s certainly possible, though I suspect we’d have developed wind, water and solar a lot faster in this alternate history of the world.
But, it doesn’t matter: wind and solar (and nuclear) are better, and cheaper, now. And that’s what matters.
“The purpose of renewable subsidies is to “internalize” the real cost of pollution, and reduce the burning of fossil fuels.”
That’s probably the most wrong thing I have ever read.
hmmm. Do you believe in evolution?
I should clarify that. The scientific community has formed a consensus around many things, including the solar-centric solar system, a round earth, evolution, and the great risk of harm from anthropogenic Climate Change. Many of these things are still rejected by those who trust the teachings of their community more than they trust science.
From your strong reaction, I assume you’re taking issue with Climate Change. So, I’m curious about your general perspective on science. Hence the question: do you believe in evolution?
I believe you’re devolving.
Even if we knew all the variables that cause climate change, we don’t have the data to measure the effects of those variables. We don’t understand how all the variables interrelate and interact in climate change models.
And, how do you know curbing fossil fuels, at a steady and realistic rate, will have any effect on reducing temperatures?
Why forgo trillions of dollars of output for something no one understands?
And, the cheap energy of fossil fuels caused an explosion of output and population growth.
Clean coal technology may be more promising than wind mills and solar panels, over the next few decades.
Here’s what one engineer stated:
“Howard Herzog, principal research engineer for the Massachusetts Institute of Technology’s Energy Initiative, says coal, which already generates 50% of the nation’s electricity, is here to stay — like it or not.
“Coal is abundant and cheap, and we have increasing energy demand,” he says “We can wish all we want, but people are going to do what it takes to keep the lights on. And that means coal.””
Duke Energy is now awaiting an air permit from Indiana for a $2 billion, 630-megawatt coal plant, large enough to power about 200,000 homes a year.
Considered only average-size as traditional plants go, it would become the world’s largest coal-fired power plant to use a new, cleaner technology called integrated gasification combined cycle, or IGCC.
“It’s a technology that has the ability to take air pollution out of the debate over coal,” says John Thompson, director of the Coal Transition Program at the Clean Air Task Force, a Boston-based environmental group that supports the plant. “The day that plant opens, the 500 or so coal plants in the U.S. are obsolete.”
Even if we knew all the variables that cause climate change, we don’t have the data…We don’t understand how all the variables interrelate…how do you know curbing fossil fuels…will have any effect
We know enough to know that there’s a very large risk, and that curbing fossil fuels is a very good idea. Look again at the statement by the professional physicists’ society: “The evidence is incontrovertible: Global warming is occurring. If no mitigating actions are taken, significant disruptions in the Earth’s physical and ecological systems, social systems, security and human health are likely to occur. We must reduce emissions of greenhouse gases beginning now.” That’s a strong statement. See http://www.aps.org/policy/statements/07_1.cfm
Do you agree that there’s an international consensus between governments about Climate Change (all of the members of the UN signed on to the IPCC findings)?
Do you agree that there’s a general consensus in the scientific community? Look again at what physicists are saying.
Why forgo trillions of dollars of output for something no one understands?
We wouldn’t. Again, onshore wind in the US is cheaper than coal, and much cheaper when you take into account non-CO2 costs, like mercury, radioactive ash, slag, black lung, etc., etc.
Clean coal technology may be more promising than wind mills and solar panels
That’s not what Herzog is saying. He’s just saying that “clean coal” is better than non-“clean coal”, not that it’s better than other things, like wind, solar and nuclear.
Duke Energy is now awaiting an air permit from Indiana for a $2 billion, 630-megawatt coal plant… it would become the world’s largest coal-fired power plant to use a new, cleaner technology called integrated gasification combined cycle, or IGCC.
That plant doesn’t sequester CO2, it just has the ability to be retrofitted for sequestration later. Note also that this plant required $460M in subsidies to be competitive cost-wise. Sequestration is much more expensive than that: it greatly reduces net power output, and the CO2 has to be transported and injected somewhere. I certainly think that coal with Carbon Sequestration and Storage (CSS) is better than conventional coal, but it’s much more expensive than wind, solar and nuclear.
I agree that supply diversity is a very good thing, so a few CSS plants are likely to be built and be valuable, but they’re not likely to be more than a niche energy source.
one should note clearly the higher cost of the newer forms of coal consumptions. this is illuminating the true cost of pollution-something that has been either subsidized or completely ignored over the past decades. if fossil fuels want to be priced to better pay for this pollution, most people will say continue their use. it is when this pollution is not properly paid for that we run into problems. markets will work when they are not distorted!
It seems to me that the price elasticy measures elasticity on the (reasonable) short term. People can’t sell their car today immediately or move closer to work / closer together just because gas is a dollar more expensive.
I would expect a lower elasticity if you model over much longer timeperiods.
Steve Kopits,
Joseph’s point that oil is not the only source of energy is important. I realize that you and Professor Hamilton believe that economic activity is governed by oil (energy source) production, but in fact this gets the market structure backwards. Energy is a commodity and a factor of production. If sources of energy become scarce other sources will be discovered or become profitable. Energy production is actually determined by economic prosperity and production. When economies are producing they will find sources of energy. They always have and they always will.
Specifically to your point and the professor’s post, as long as government policies destroy production and the efficient use of capital energy will be scarce. The poorest consumers will suffer the most because the scarce sources of energy will be acquired by the rich and policitally connected. They poor always suffer in big government command economies. Only liberty and freedom turns back poverty and economic decline. Sadly, I agree with you about the period after 2020 concerning GDP growth. Government has so changed society that money and the normal economic signals are essentially meaningless. Economic statistics today do not measure the wants and needs of people but the actions of government. The average person has very little impact of real demand. Demand is determined by government dictate either through subsidy or taxation or other regulation.
When economies are producing they will find sources of energy.
Yes. Human innovation finds energy, incentivized by economic signals (prices).
We’re surrounded by enormous amounts of energy, and technology/innovation is what unlocks it and makes it cheap.
Why didn’t the Romans, Goths or Celts use coal? They were standing on top of enormous amounts – it washed up on the beach and showed it’s presence and value. The English suffered for centuries due to a wood shortage before they made use of coal, because they hadn’t developed the knowledge (aka technology) to make use of it. Native Americans and Mesopotamians lived in Pennsylvania and the ME for millennia before oil was turned into interior lighting. And, electricity and transportation (fueled by coal or oil) weren’t nearly as cheap as they are now until after WWII, when improved tech made them so.
Similarly, wind, solar (and nuclear, probably in a secondary role) now unlock enormous amounts of clean, cheap energy using modern tech.
Concerning the use of coal by the english people, It seems the problem is more complex that your explanation. Coal is known in the medieval world since the XIth century. Its energy content is higher than wood, but its use has undesirable polluting side effects : odor and carbon monoxyde dangers. So its use is limited as long as wood is available.
The pressure on deforestation is growing during the XIVth, just when the black Death kills between 33% and 55% of the population, relieving the constraint. Then the pest strikes every decade until the end of the XVth.
It is only when the population starts again to rise (despite the pest) in the XVIth century at a quicker pace, because the technology/energy macroeconomic engine initiated in the XIth-XIIIth with massive mills (water then wind) deployment in Europe is more and more powerful (and the understanding by populations of ways to prevent somehow epidemic spreading), that the english population hits the limit to growth : the size and consumption rate of english forests and woods.
What is marvelous is that the growing use of coal for heating triggered the technological innovation of the Newcomen engine. Not the other way round … But Europe was from the XIth at the heart of technological innovation.
My understanding is that England reached “Peak Wood” several centuries before the Black Death, that the scarcity of wood was an enormous problem during those centuries, and contributed greatly to the malnutrition that made people more vulnerable to dying during the pandemic.
Remember how in the 13th century Sherwood Forest was the King’s Wood, and how Robin Hood’s merry men were prohibited from harvesting wood from the forest? That was Peak Wood.
There are many other examples: Athens hit Peak Wood – that’s why it’s was so important for Athens to protect it’s imports during it’s wars with Sparta. So did Rome. Both of these fast growing civilizations desperately needed more and better energy, but they never figured out how to take advantage of the plentiful fossil, renewable and nuclear energy around them – they hadn’t developed the technology yet.
growing use of coal for heating triggered the technological innovation of the Newcomen engine. Not the other way round
I’m not quite sure what the argument here is. Coal production was limited by mine flooding – the steam engine was an innovation designed to allow the expansion of production.
According to many scholars, the tension on wood was real and growing, but I wouldn’t say their was a “peak wood” at that time. In 1346, in France (population was around 20 Millions at that time, and Paris was 200 000), there is the Ordonnance de Brunoy by the king, stating :
« Les maitres des Eaux et Forez […] enquerront et visiteront toutes les forez et bois et feront les ventes qui y sont, eu regard de ce que lesdites forez se puissent perpetuellement soustenir en bon estat »
As you can read, this is, to my knowledge, the first statement about “soustenable” development in France, and maybe in the West ?
According to some scholars, there is nothing to do between a supposed “economic crisis” in the first half of the XIVth century, and the Black death (1346 again). Black death stroke rich and poors alike. Black death seems on the contrary to be the consequence of a very dynamic economic world using massive transportation of wheat by sea, and thousand of markets inland, in order to support urbanization which had reached maybe 15% of the western population, and probably more than 40% in certain areas like Tuscany and Flanders.
It is true the use of coal started before the Black Death (see The 1285 commission on the burning of soft coal in London) , but because of its drawbacks, it was very limited. And coal production was no so limited before the Newcomen engine …
1346 was the year of the “limit to growth”, but then it ended with a spectacular “solution” many economic historians have misunderstood : the biggest catastrophe the world has ever encountered. For some scholar, it is not 33% of the population that died in a few months, but maybe around 55%.
I think that you’re arguing that the delay between “peak wood” and rising use of coal in England wasn’t as large as I suggested.
Perlin talks about this transition and wood depletion in detail in “A Forest Journey”. What do you think of his discussion?
Ricardo –
Both Jim’s and my analysis refers to energy, not oil, for purposes of this post. We are comparing BP and Exxon’s forecasts for energy usage with GDP growth. If we are to believe, say, BP, then growth must either i) be primarily related to intangible goods like intellectual property, IT, communications and pharmaceuticals, or ii) growth will be limited to efficiency gains wrt respect to energy usage. David Stern’s stylized facts suggest that the relationship of energy to GDP in quite stable over time, despite two oil shocks and massive increases in the price of oil, coal and gas over the last decade. This brings into question whether there is some maximum speed of adjustment which the global economy can handle. I think the evidence strongly suggests there is.
Remember, 2040 is not that far away. It is hardly farther than 1990 is from today. And the world is not so very different compared to then; therefore 2040 may not be so different from today. We will still need to drive, to fly, to eat, housing, to clothe ourselves, to provide for our children’s’ education and our elders’ pensions and healthcare. I think the onus is on BP or Exxon to explain why historical energy-to-GDP relationships will break down, rather than for Jim or David or myself to explain why they won’t. This is not to say that BP or Exxon are wrong; but that a more spirited defense of their position is called for.
As for price signals. These work until the price elasticity of demand (dQ/Q/dP/P) reaches -1.0. Beyond that, producers cannot raise prices because total revenue falls. That price today is right around the $116 / barrel number Jim cites. (My calculation is at $118.) Thus, price signals work within a range. Outside that, volume has to do all the work, and if the volumes aren’t there, then economic activity will adjust accordingly. That’s what I think the data is showing. Oil prices are not rising, even as OECD oil consumption continues to fall. Prices signals, in a static sense, have done about as much as they can do.
We will adapt. We are adapting. However, there is no guarantee that the pace of adaptation will sufficient to maintain customary rates of economic growth.
Both Jim’s and my analysis refers to energy, not oil, for purposes of this post.
Not really. There’s no clear limits to non-oil supply (coal, NG, nuclear, wind or solar). BP seems to be assuming slow demand growth, not supply problems.
.relationship of energy to GDP in quite stable over time
That’s because non-oil energy hasn’t been limited by supply. Why shouldn’t it grow with GDP? On the other hand, the relationship of oil to GPD hasn’t been stable at all.
price signals…work until the price elasticity of demand (dQ/Q/dP/P) reaches -1.0.
I’m not clear on your argument. If elasticity of demand is 100%, then price signals are 100% effective. They’re working extremely well: consumers don’t think oil is worth more than that price. They’re moving to alternatives: efficiency, electricity, mass transit, carpooling, relocation, etc.
You’re simply assuming that supply elasticity is due to an inability to pay. That certainly doesn’t apply to the great majority of consumers in the US or the OECD. Even in developing countries like China, E-bikes are selling better than ICE vehicles.
there is no guarantee that the pace of adaptation will sufficient to maintain customary rates of economic growth.
No doubt. That’s why these posts of Jim’s are so valuable: they give people more time to adapt.That’s something that Republicans seems to be trying to prevent with their claims that $2 gasoline will return if we’ll only elect elect them.
Yikes – I wish edits were possible. Let me clarify: in paragraph 4, instead of “supply elasticity” please read “demand elasticity, and damage to the economy”
Off topic. But on the much bigger one. Economic growth has been falling on trend for over 5 decades. Might it not benefit readers to address this topic more frequently? Why has this happened? What role have economists played? How responsible is the dominant Keynesian orthodoxy? Exactly what are the main pieces of the story (a comprehensive collection of such)? The consensus, the Fed, the IMF, the World Bank, all are adrift on the same rudderless raft. Is this not apparent? They did not forecast the crisis. And they did not forecast the 1.4% growth of the past two years and 1.6% the past year. (Updated after this morning’s GDP report.) It is not science when your models cannot forecast.
JBH,
Don’t you know? It is all because of income inequality. LOL!!!!
Good piece. I think you get both, slower growth and real energy price increases.
The comments here are very polarized between those who think GDP depends very strongly on oil output and those who think not at all. I’m not sure there’s any way to persuade people who are shouting at each other with their hands over their ears, but for what it’s worth, I think there’s some space in between.
Definitely natural gas will continue to substitute for oil. That’s what electric cars are really about, at least in the current, US situation. But that’s going to be more expensive all-in than current oil prices, not cheaper. We in the US have very cheap gas now because we suddenly discovered more than we’re prepared to use and there are no export outlets. That won’t last – productions costs are rising, not falling, and much pricier Asian export markets beckon. Longer out, coal and nuclear will make comebacks. Our descendants probably won’t have the luxury of shunning them.
“Renewables” I’m much less optimistic about. Hydro, the most environmentally destructive of all energy sources, sadly has the best prospects and will continue to wreck pristine valleys in places like Borneo and Burma. Wind, an eyesore and a bird-killer, has some limited prospects to expand even though most people hate it. Solar even after its recent price drop is a subsidized facade, behind which lies a dirty panel production process for very little net energy. Cane sugar ethanol is about the same, and corn ethanol is nothing but corruption. I don’t rule out major technological breakthroughs, but I wouldn’t make a forecast assuming them.
Energy is not oil. At a price, natural gas replaces most oil. At $4.5 mcf natgas, (which is that high only because of record cold winter), natgas is $27 a barrel, somewhere around 1980 price for oil. Price make people use nat gas rather than oil. Mexico is importing a lot of US natgas to replace oil they would use in power plants (they sell the oil to us at a higher price). Refiners use hydrocrackers to combine 80% oil and 20% nat gas to make 100% diesel. Companies produce an abundance of natural gas liquids, which now sells for much less than oil, which can be used instead of oil for a number of non fuel uses. Price is a wonderful thing.
At $100 oil and $4.5 natgas, all oil companies go for oil, even though natgas is much easier to find/produce in shale. Price is a wonderful thing.
Substitution is always a factor, at least incrementally.
However, in my opinion it is very likely that actual global crude oil production (45 or lower API gravity crude oil) peaked in 2005, while global natural gas production–and associated liquids, condensates & natural gas liquids (NGL)–have so far continued to increase.
As I have periodically noted, when we ask for the price of oil, we get the price of 45 or lower API gravity crude oil, but when we ask for the volume of oil, we get some combination of crude oil + condensate + NGL (Natural Gas Liquids) + biofuels + refinery gains.
Shouldn’t the price of an item relate to the quantity of the item being priced, not the item + (partial) substitutes?
In any case, a key question is the ratio of global condensate to Crude + Condensate (C+C) production. Unfortunately, we don’t appear to have any global data on the Condensate/(C+C) Ratio. Insofar as I know, the only complete Condensate/(C+C) data base, from one agency, is the Texas RRC data base for Texas, which is shown below for 2005 and 2012:
2005:
Condensate: 0.12 mbpd
C+C: 1.08 mbpd
Condensate/(C+C) Ratio: 11.1%
2012:
0.30 mbpd
C+C: 1.95 mbpd
Condensate/(C+C) Ratio: 15.4%
The 2013 Ratio (more subject to revision than the 2012 data) shows that the ratio fell slightly, down to 14.7%, which probably reflects more focus on the crude oil prone areas in the Eagle Ford. But rounded off, we are looking at about 15% for 2012 and 2013.
The EIA shows that Texas marketed gas production increased at 5%/year from 2005 to 2012, versus a 13%/year rate of increase in Condensate production. So, Texas condensate production increased 2.6 times faster than Texas marketed gas production increased, from 2005 to 2012.
The EIA shows that global dry gas production increased at 2.8%/year from 2005 to 2012, a 22% increase in seven years. What we don’t know is by what percentage that global condensate production increased from 2005 to 2012. What we do know is that global C+C production increased at only 0.4%/year from 2005 to 2012. In my opinion, the only reasonable conclusion is that rising condensate production accounted for virtually all of the increase in global C+C production from 2005 to 2012, which implies that actual global crude oil production was flat to down from 2005 to 2012, as annual Brent crude oil prices doubled from $55 in 2005 to $112 in 2012.
Normalized global gas, NGL and C+C production from 2002 to 2012 (2005 values = 100%):
http://i1095.photobucket.com/albums/i475/westexas/Slide1_zps45f11d98.jpg
Estimated normalized global condensate and crude oil production from 2002 to 2012 (2005 values = 100%):
http://i1095.photobucket.com/albums/i475/westexas/Slide2_zpse294f080.jpg
That’s why I noted above that total energy use has been in decline longer than oil. Some of this is due to efficiency gains, but most of it is probably due to declining growth.
Se eia link above.
Tom wrote: “Hydro, the most environmentally destructive of all energy sources, sadly has the best prospects and will continue to wreck pristine valleys in places like Borneo and Burma.”
Best prospects have PV and onshore wind. Get hard data.
Tom wrote: “Wind, an eyesore and a bird-killer, has some limited prospects to expand even though most people hate it.”
The windows in your living room are more dangerous for birds than a wind turbine, your pets, too. This birdkilling argument is bovine manure.
In many contries people actually like wind tuirbines and build them like hell. Hint: Possession of production capacity makes the difference between a eyesour and a beauty.
Tom wrote: “Solar even after its recent price drop is a subsidized facade, behind which lies a dirty panel production process for very little net energy.”
Nonsense, when it comes to economy; debatable at least when you are discussing EROEI. A modern production offers solar installations (modules + BOS) which have an energy return within 2 years for small roof top PV. Therefore, we are talking about an EROEI in the range of 10-20.
The enviromental impact of third tier Chinese producers is bad, however, Japanese or US producers deliver very good results, who will survive?
Tom wrote” I’m not sure there’s any way to persuade people who are shouting at each other with their hands over their ears, but for what it’s worth, I think there’s some space in between.”
Obviously only other have to find this middel ground, you ar exempted. 🙂
Nick G,
I loved your post right up to the last sentence. There is a reason wind and solar energy are not primary sources of energy. They are highly expensive sources of energy and very unreliable. While I totally agree with your ideas about energy production the next phase in energy production is not yet evident. One thing the market does tell us, though, is that it is not wind and solar. Without carbon based fuels we would be back in the dark ages with only wind and solar.
Ricardo,
I’m afraid you’ve been getting misinformation. Wind and solar work just fine, and are quite affordable.
Please keep in mind that we’re not talking about the technologies are changing pretty quickly. Renewables weren’t as useful decades or centuries ago (though our ancestors certainly got a great deal of utility from them), but they are now ready for primetime. Windpower is cheaper than new coal, and solar is at grid-parity in large areas of the world.
The variance of wind and solar isn’t nearly as hard to deal with as some opponents suggest: utilities have been dealing with such variance from *both* supply and demand since the birth of the industry. Again, every kind of generation has it’s variance: for instance, a 1GW nuclear plant can trip at a moment’s notice, and be out for days (or longer). There’s a wide range of proven techniques for dealing with variance. Among other things, demand side management is very powerful and underutilized, geographic diversity will reduce variance, and we have lots of NG for balancing. In the very, very long run we can use DSM and storage for daily variation, combined with overbuilding and some modest backup from biomass for seasonal variation.
Here’s one example of how utilities cope:
“forecasts are helping power companies deal with one of the biggest challenges of wind power: its intermittency. Using small amounts of wind power is no problem for utilities. They are accustomed to dealing with variability—after all, demand for electricity changes from season to season, even from minute to minute. However, a utility that wants to use a lot of wind power needs backup power to protect against a sudden loss of wind. These backup plants, which typically burn fossil fuels, are expensive and dirty. But with more accurate forecasts, utilities can cut the amount of power that needs to be held in reserve, minimizing their role.
Before the forecasts were developed, Xcel Energy, which supplies much of Colorado’s power, ran ads opposing a proposal that it use renewable sources for a modest 10 percent of its power. It mailed flyers to its customers claiming that such a mandate would increase electricity costs by as much as $1.5 billion over 20 years.
But thanks in large part to the improved forecasts, Xcel, one of the country’s largest utilities, has made an about-face.
It has installed more wind power than any other U.S. utility and supports a mandate for utilities to get 30 percent of their energy from renewable sources, saying it can easily handle much more than that.
..forecasts from NCAR are already having a big effect. Last year, on a windy weekend when power demand was low, Xcel set a record: during one hour, 60 percent of its electricity for Colorado was coming from the wind. “That kind of wind penetration would have given dispatchers a heart attack a few years ago,” says Drake Bartlett, who heads renewable-energy integration for Xcel. Back then, he notes, they wouldn’t have known whether they might suddenly lose all that power. “Now we’re taking it in stride,” he says. “And that record is going to fall.””
http://www.technologyreview.com/featuredstory/526541/smart-wind-and-solar-power/
Sheesh. The first sentence in the 2nd paragraph, should be “Please keep in mind that we’re not talking about “our father’s wind & solar”.” The…
“Renewables weren’t as useful decades or centuries ago …”
In fact, the US was on a renewable standard until about 1850, relying heavily on both wood and whale oil. That’s when coal starts making an appreciable contribution to energy consumption. However, coal did not overtake wood as an energy source until 1885. Oil did not overtake wood until around 1910. Modern civilization is built on coal and oil, and later, natural gas.
Now, if natural gas is a good substitute for oil, then the price of gas should be equal to the price of oil in btu terms. But the price of nat gas is not $18 / mmbtu, but rather $4.45 per mmbtu, an energy-equivalent ratio of 4. Today, natural gas is very far from being a substitute for oil in the United States. Nor is there interest by either the oil companies or the auto manufacturers in really pushing this technology.
Meanwhile, a large portion of the adjustment to higher oil prices has come in the form of reduced VMT and commercial airline departures. The easy and quick form of adjustment is lower economic activity. Finding cost effective substitutes or reorganizing society to do without energy takes much longer, and may not be fully possible.
In fact, the US was on a renewable standard until about 1850
Absolutely. I didn’t phrase that well: I just meant that renewable tech is greatly improved since then.
if natural gas is a good substitute for oil
I agree, especially for passenger transportation (that wasn’t something I discussed). It has it’s place for freight, though rail is the logical way to reduce freight oil consumption. Paradoxically, coal and oil hauling is crowding out other forms of freight, at the moment…
a large portion of the adjustment to higher oil prices has come in the form of reduced VMT and commercial airline departures.
No. Frustratingly enough, VMT hasn’t responded noticeably to oil prices. Instead, VMT growth has been declining in a linear fashion since long before oil prices rose. See Calculated Risk’s discussion. The second graph shows the year-over-year change from the same month in the previous year. We see a clear linear decrease. http://www.calculatedriskblog.com/2014/06/dot-vehicle-miles-driven-increased-18.html
It’s true that commercial airlines have increased their plane occupancy rates, thus reducing departures. It’s a little annoying not to have an empty seat next to you on a long flight, but in the larger scheme of things, who cares?
No, because fuel is badly underpriced in the US, drivers really don’t pay much attention to gas prices. They pay lip service, but they’re not flocking to hybrids, EREVs and EVs (and carpooling and transit) they way they would with the proper incentives.
Your reference to whale oil piqued my curiousity. A quick search suggests that whale oils never had very large volume. Wikipedia It says that it was “used as a cheap illuminant, though it gave off a strong odor when burnt and was not very popular”. Peak imports were about 5M gallons per year, which is only about 300 barrels per day. Sperm whale oil was about twice that – still not very large.
” In the 1700’s it was noted that the burning oil from sperm whales glowed brightly and clearly and did not have a disagreeable odor like the oil from right whales did (Bonner, 1989). The sperm whale was the main whale being sought for its oil when the petroleum industry opened in 1859. The whale fishery, however, was in a declining state and had been so a decade or more before Drake struck petroleum in his drilled well and before general refining of crude oil commenced in Oil Creek Valley and elsewhere.”
http://www.petroleumhistory.org/OilHistory/pages/Whale/whale.html
Steven,
More and more technology historians tell us that the US as well as Europe were still mostly relying on hydro (and in some places on wind) energy for the first part of the XIXth century. Useful mechanical energy.
Very heavily. For France for instance, there was more than 100 000 mils according to the 1809 census.
The GDP & energy production graphs tell me two things. First, they tell me that GDP is probably not the right variable. What we really care about isn’t how much we can produce today, but how much we can consume today while still being able to consume just as much tomorrow. In other words, what we really care about is NDP, not GDP. More specifically, what we really care about is NDP that correctly accounts for depreciation of exhaustible resources and the production of unwanted externalities that will impact future consumption flows. The second thing these graphs tell me is that historically oil has been mispriced. The well known absence of any evidence for Hotelling rents in the oil markets tells me that historically oil has been underpriced, so we shouldn’t be too surprised if this led to higher than optimal extraction rates. Maybe correctly accounting for the consumption of exhaustible resources and the production of unwanted pollution externalities would have given us a different looking NDP curve. Maybe a correctly priced oil would have given us a different looking oil production curve. In other words, maybe what these graphs are really telling us is that back in the good old days things weren’t really as good as they seemed at the time.
JBH I’m not sure how you managed to blame Keynesian economics for the long-run erosion of growth rates observed since WWII. I’m pretty sure growth rates were lower than current rates long before Keynes was even born, so it seems a bit much to lay all that at Keynes’ doorstep. Keynesian macro is largely silent when it comes to long-run growth. Keynesian macro is all about managing short-term aggregate demand to lean against overshooting and undershooting potential GDP. The truth is that I don’t think anyone really understands the determinants of long-run growth…at least not in a deep sense. Yes, capital deepening contributes to higher growth levels, although perhaps not to permanently higher growth rates. Yes, population growth contributes to economic growth in a mechanical sort of way. And yes, technology (broadly understood) seems important; but the problem is in that parenthetical “broadly understood.” It turns out that “broadly understood” is more aptly translated as “so broad and fuzzy as to be not well understood at all.” For example, take David Romer’s “Advanced Macroeconomics,” which is pretty much a standard textbook used almost everywhere and cited by almost everyone. The first three chapters are devoted to explaining the Heinz 57 different varieties of growth theory; viz., Solow, Ramsey, Diamond, Abel & Mankiw, etc. All of them end up being unsatisfactory in one way shape or form. Each invites more questions than it answers. Or take one of the top growth theorists out there today, Daron Acemoglu (winner of the John Bates Clark medal). His lecture slides from his advanced classes on growth theory certainly leave the student confident that this is a field with plenty of untilled soil yet to be worked.
http://economics.mit.edu/faculty/acemoglu/courses
The one thing that we can be fairly sure about is that whenever you hear politicians in general, and GOP politicians in particular, talk about their so called “pro growth” policies, you can bet your bottom dollar (and if you’re poor it will be your bottom dollar) that the plan will involve rent seeking schemes for the 1%, lower actual growth for the 99% and greater inequality.
I’m pretty sure growth rates were lower than current rates long before Keynes was even born
Yes, growth rates have been declining for quite some time. People ask if unusually strong growth since 1945 show the value of cheap energy in that period. No, US growth was faster before 1945, using moderately expensive, non-oil energy:
1800-1900: 4.13%
1900-1945: 3.53%
1945-2000: 3.17%
“real GDP” at http://www.measuringworth.com/growth/index.php
The 19th century economy was starting from a smaller base, but it’s tough to argue that the new kid on the block, oil, “goosed” the economy.
Oil is a bit more convenient – for instance, Churchill converted the British navy from coal to oil because they could “steam” just a little faster than the competition – but civilization would have been just fine without it. Rail would have kept it’s central role for freight and passenger traffic, cars and planes would have been less numerous and shorter range, and used batteries and ethanol, etc.
JDH: Something I haven’t heard discussed about the 1QGDP numbers is what role the drop in fossil fuel stocks (particularly natural gas storage) may have played in inventory reductions. It looks like it might explain a significant portion, given that natural gas stocks bottomed much lower than normal. Of course, I guess you’d have sales to go with those withdrawals, but maybe they are lagged?
…forecasts of the potential for future energy production by the companies that many may be counting on to meet future energy demand appear to be inconsistent with the relation between energy use and GDP growth that held for the last 40 years…One possibility is that GDP growth is going to be slower than it has been. Another is that energy price increases are likely to continue.
This appears to conflate oil and the overall energy mix. Many analysts would agree that oil supply growth has been unable to keep up with consumption. On the other hand, few mainstream analysts would agree that there are serious supply problems on the horizon for any other energy sources. Is there really any sign that BP thinks that coal supply will be a problem?
Further, US oil consumption was essentially flat between 1979 and 2004, while US GDP rose by 2.5x times. That didn’t happen because prices rose – they didn’t. It happened because of sensible, foresighted regulation, which increased vehicle fuel efficiency by 100% over that period.
I think BP expects that Climate Change will be recognized in the next several decades as a problem that actually needs to be dealt with, and governments will actually take effective action.
Hard to imagine in today’s environment of energy misinformation…
@NickG: “US oil consumption was essentially flat between 1979 and 2004, while US GDP rose by 2.5x times.”
http://research.stlouisfed.org/fred2/graph/?g=Epw
http://research.stlouisfed.org/fred2/graph/?g=Epz
http://research.stlouisfed.org/fred2/graph/?g=EpA
http://research.stlouisfed.org/fred2/graph/?g=EpD
http://research.stlouisfed.org/fred2/graph/?g=EpC
http://research.stlouisfed.org/fred2/graph/?g=EpF
You might be missing an important inference, NickG. See charts at the links above.
How did the US economy grow an approximate order of exponential magnitude during the period you cite with little growth of oil consumption?
How much did debt grow to wages and final sales?
What happened to value-added goods production to final sales and goods-producing employment during that period?
What has happened to debt to wages and final sales since 2008?
The US reached peak oil production per capita in 1970, after which production has declined 50% since 1970 and 33% since 1985, whereas mfg. employment has fallen 33%.
http://research.stlouisfed.org/fred2/graph/?g=EpJ
http://research.stlouisfed.org/fred2/graph/?g=EpM
During the exponential order of growth of debt to final sales and wages, employment in the increasingly financialized sectors, i.e., financial services, gov’t, “education”, and “health care”, grew proportionally to the increase in debt to final sales, including women entering the labor force en masse to be employed in the financialized sectors at a proportion of 65-80% to 85%.
Get it? When crude oil production per capita peaked in the US in 1970-85, the country could no longer afford an industrial economy, i.e., a symptom of having contracted so-called “Dutch Disease”. Since the 1980s, we replaced value-added goods production and employment for males, primarily, with exponential growth of debt to wages and final sales and employment growth disproportionately for women in the increasingly financialized sectors of gov’t, financial services, “education”, and “health care”.
Now total local, state, and federal gov’t spending, private “health care” spending, and household debt service (“rentier taxes”) combines for an equivalent of 50% of GDP (gov’t spending to GDP in the Eurozone is 52%, which includes state-sponsored “health care” services). The cumulative effect is that these sectors are now a net cost (not a value-added activity) to growth of investment and employment in the private sector.
In a hyper-financialized economy such as that of the US (and UK), the economy cannot grow in real per capita terms because debt to wages and GDP cannot grow. Without growth of the private sector and overall final sales per capita, gov’t receipts cannot grow, therefore, gov’t to final sales cannot grow. Because gov’t, “health care”, “education”, and financial services combined for 50% of GDP and a net cost, the US economy cannot grow these sectors as a share of final sales, nor can the private sector grow because of the net cost of these sectors.
High debt to final sales by definition reflects high asset prices to final sales and wages, which in turn coincides with increasing wealth and income inequality and falling labor’s share of GDP/final sales. Households, firms, and gov’ts are now so utterly in debt in perpetuity to the top 0.1-1% that real per capita growth is not possible after total debt service.
Thus, we are in a vicious cycle of excessive debt to wages and GDP, debilitating costs to wages and GDP from debt service, gov’t, energy, “education”, and “health care”, ongoing decline of labor’s share to GDP, declining self-employment and new small business creation, and peak Boomer demographic drag effects lasting for a generation hence, creating a post-2007 secular trend of real final sales per capita around 0% or possible negative hereafter.
This is the essence of the “secular stagnation”, which similarly occurred in the 1830s-40s, 1880s-90s, and 1930s-40s (early to mid-1950s in Europe). However, this time the stagnation is occurring with a secular (permanent?) demographic drag, unprecedented fixed costs of complex high-tech infrastructure and public claims as a share of wages and final sales, Peak Oil, population overshoot, and depletion of non-renewable resources on a planetary scale. There exists no conventional supply-side, Keynesian, Monetarist, socialist, communist, or any other “ist” prescriptions for the combination of constraints coalescing today and hereafter.
Radical/r-evolutionary thinking, experimentation, and policy innovation is required at the local, regional, and national levels to deal with the unprecedented challenges facing the US economy and society. Establishment eCONomists, captured politicians, CEOs, Wall St., “the market”, and vetted mass-media influentials and gatekeepers are not currently worthy of the task.
The US reached peak oil production per capita in 1970, after which production has declined 50% since 1970 and 33% since 1985, whereas mfg. employment has fallen 33%.
Employment in manufacturing has fallen, but manufacturing output has risen by 50%. So, instead of falling US oil output harming manufacturing, manufacturing increased it’s labor productivity. Right?
erm,
I know that is just a little off topic, at first glance,
but a POTUS mocks both US congress and SCOTUS.
http://finance.yahoo.com/news/obama-mocks-congress-one-day-174300383.html
Shouldn’t that be an urgent reason to start impeachment procedures?
Adolf had at least an Ermächtigungsgesetz