Production flows from a given oil field naturally decline over time, but we keep trying harder and technology keeps improving. Which force is winning the race?
An oil reservoir is a pool of hydrocarbons embedded and trapped under pressure in porous rock. As oil is taken out, the pressure decreases and the annual rate of flow necessarily declines. A recent study of every well drilled in Texas over 1990-2007 by Anderson, Kellogg, and Salant (2014) documents very clearly that production flows from existing wells fall at a very predictable rate that is quite unresponsive to any incentives based on fluctuations in oil prices.
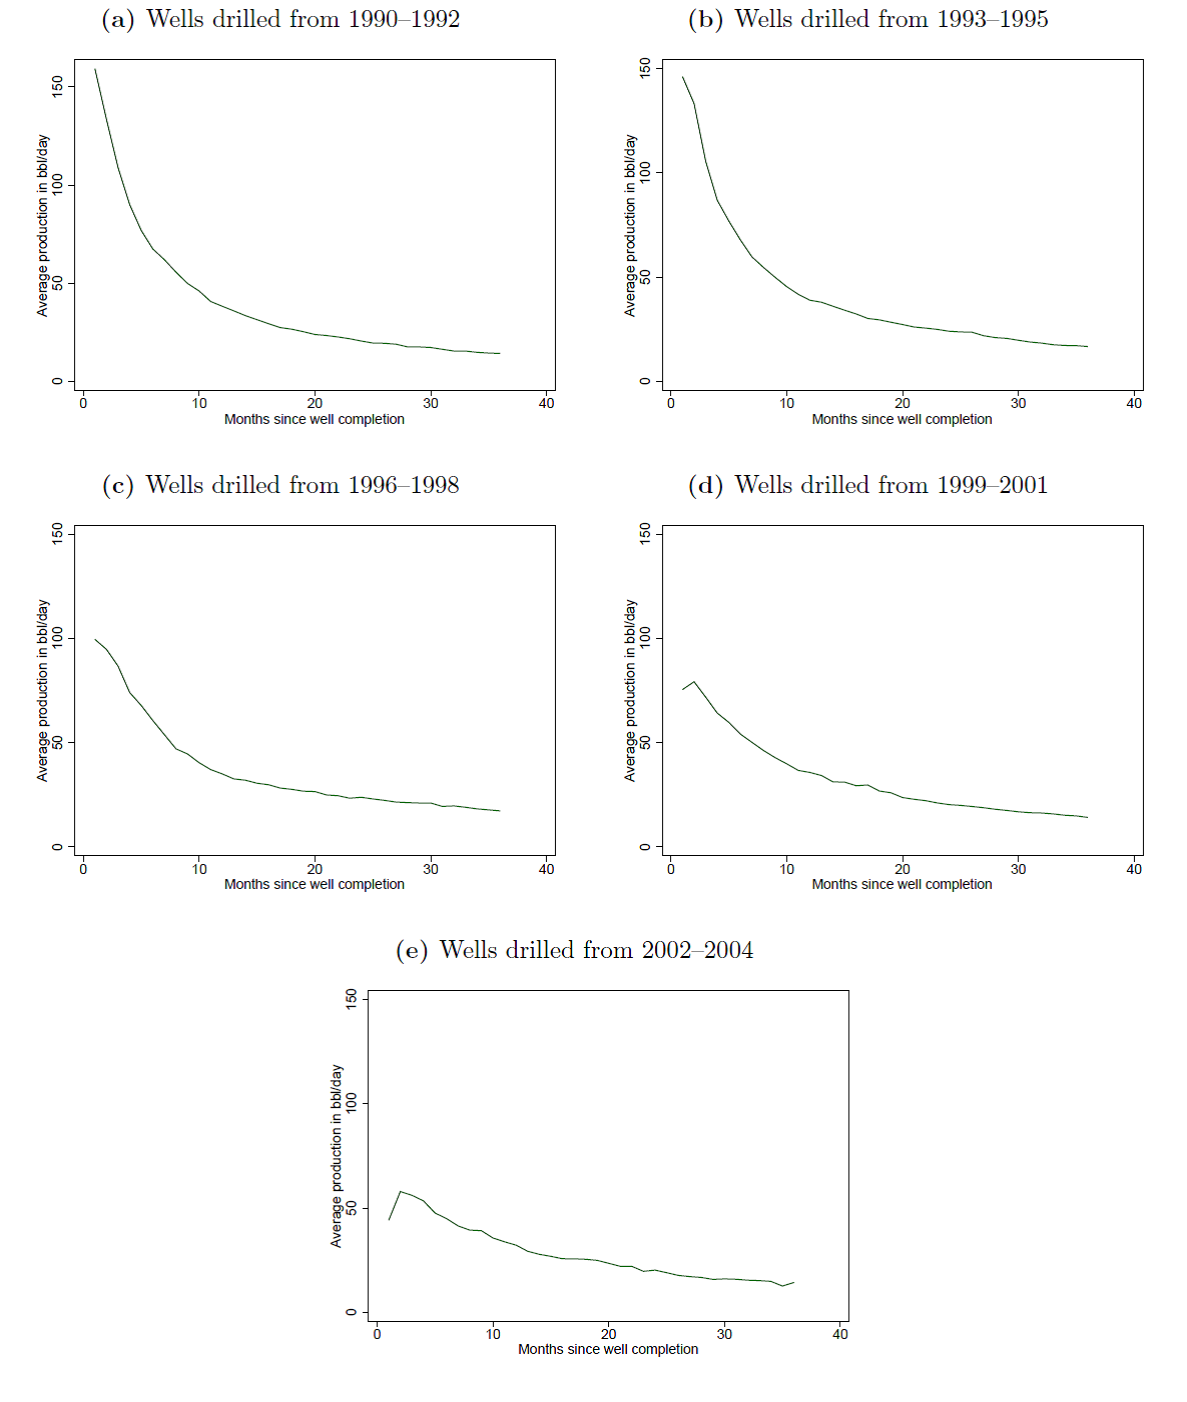
Average monthly production from Texas wells drilled in indicated period as a function of months since well completion. Source: Anderson, Kellogg, and Salant (2014).
If you want to produce more oil, you have to drill a new well, and in contrast to production from existing wells, drilling effort clearly does respond to price incentives.
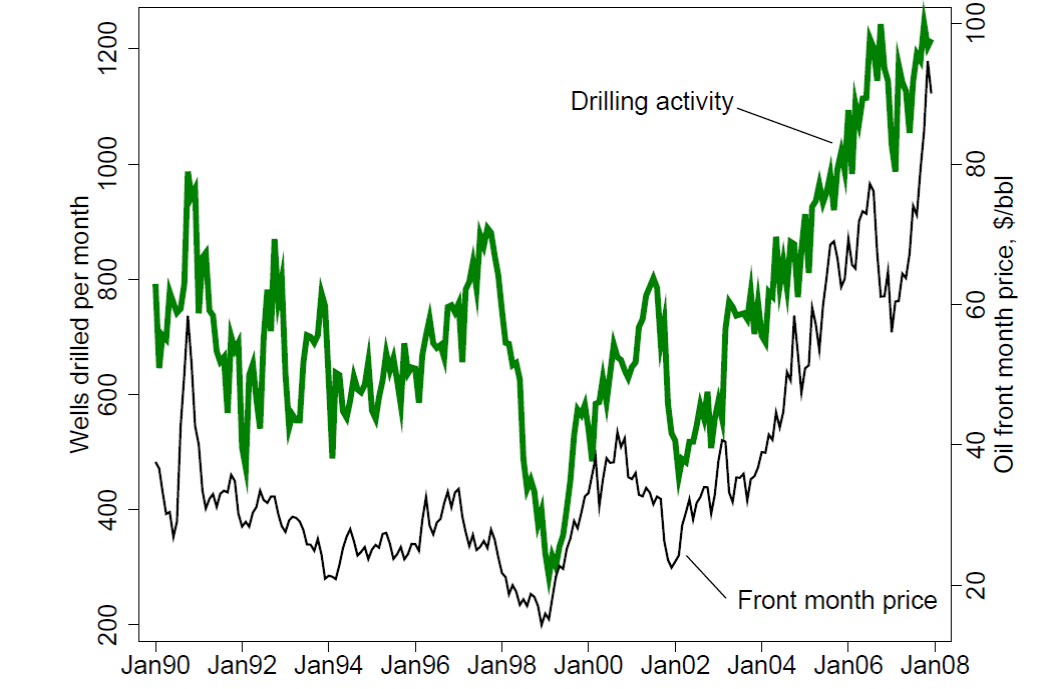
Number of new wells drilled in Texas each month (in green) and price of crude oil (black). Source: Anderson, Kellogg, and Salant (2014).
When a given region is found to be promising, more wells are drilled, and production initially increases. But eventually the force of declining pressure takes over, and we see a broad decline in oil production from a given producing region that additional effort and price incentives can do little to reverse. For example, production from the North Sea and Mexico, which had been quite important in the world total in 2000, have been declining steadily for the last decade despite a huge increase in the price of oil.

Oil production from the North Sea and Mexico, Jan 1973 to March 2014. Top panel: combined field production of Norway and the United Kingdom in thousands of barrels per day, from EIA, Monthly Energy Review, Table 11.1b. Bottom panel: sum of Norway, U.K., and Mexico production as a percent of world total. Reproduced from Hamilton (2014).
It’s also interesting to look at graphs for each of the oil-producing U.S. states. Production from Pennsylvania, where the oil industry began in 1859, peaked in 1891, and in 2013 was at a level only 1/6 of that achieved in 1891. But despite falling production from Pennsylvania after 1891, U.S. production continued to increase, because of the added boost from Ohio (which peaked in 1896) and West Virginia (which peaked in 1900). And so the story continued until 1970, with total U.S. production continuing to increase despite declines from the areas first exploited.

Annual production (in mb/d) from 18 U.S. states that peaked earliest, 1860-2013. Source: Hamilton (2014).

Annual production (in mb/d) from 13 U.S. states with later peak dates, 1860-2013. Source: Hamilton (2014).
The table below lists the date at which production from an indicated state reached its highest point. Use of horizontal drilling methods in the Bakken and Niobrara shales brought production in North Dakota and Colorado to all-time highs in 2013. Production was also higher in 2013 than in 2005 for 22 of the 31 states graphed above, though 2013 levels were still below the historical peak for all but 3 of these states.
[table id=1 /]
Another perspective on the U.S. trends comes from looking at broader categories of production. The red area in the graph below summarizes field production of conventional crude oil from the lower 48 U.S. states. This peaked in 1970, and today is 5.5 mb/d below the value achieved then. Factors temporarily slowing the trend of declining production were development of offshore oil (in dark blue) and Alaska (in light blue). But the combined contribution of all three of these has nevertheless been falling steadily for the last 20 years.
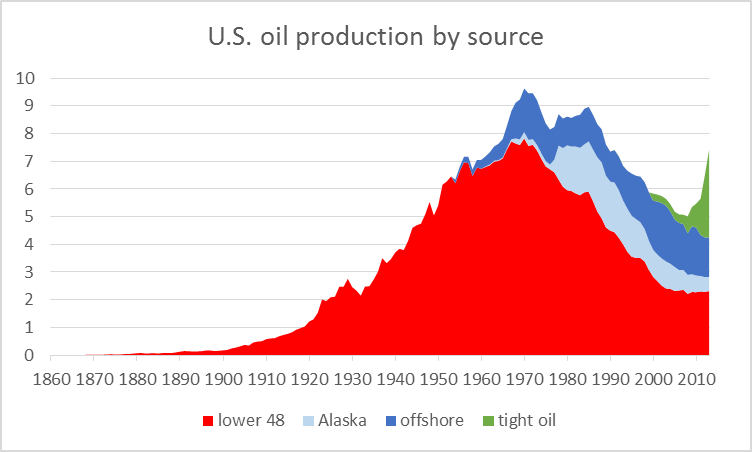
U.S. field production of crude oil, by source, 1860-2013, in millions of barrels per day. Source: Hamilton (2014).
That downward trend was dramatically reversed over the last few years with the advent of horizontal drilling and fracturing to get oil out of tighter geologic formations, as seen in the green region in the graph above. If success with tight oil formations continues, we may yet see the historical peak production of many of the states above eventually exceeded, and indeed perhaps even for the United States as a whole.
But it’s also worth noting that as we moved through the succession of colors in the graph above we have been turning to increasingly more expensive sources of oil. Today’s frackers would all be put out of business if we were to return to the oil prices of a decade ago.
And even if prices remain high or go higher, eventually that green curve is going to turn around and start falling with the others.
Professor, excellent, as always.
Keep in mind that, despite the tight “oil” boom/bubble, “oil” extraction per capita is still down 45-50% since the peak in 1970, and extraction per capita is at the level of the late 1930s to before WW II.
Crude extraction alone from all sources is now 72% per capita since 1970, which exceeds the self-criticality threshold for collapse in complex systems dynamics, and implies the we are falling off the Seneca cliff, evidenced by our desperate attempts to extract tight “oil” as fast as possible. We’re in a per capita net exergetic collapse regime, but we don’t know it yet.
Were “oil” extraction to have kept pace with population since 1970-85, US “oil” extraction would be at ~13-15MMbbl/day.
Regressing “oil” extraction and price since 2008-09, to reach the population-adjusted peak of “oil” extraction by, say, 2020-25, the price of “oil” would need to rise to $220-$280/bbl and the implied price of gasoline at $6-$7/gal.
If so, at the trend rate of US nominal GDP since 2000-07, assuming no decline in oil consumption (which will clearly occur), US oil consumption to GDP would reach 7-9%, implying a 11-15% decline in real GDP per capita by 2020-25. Again, we’re in a net exergetic per capita collapse regime with unprecedented financial bubbles obscuring the underlying collapse condition.
The US cannot afford to profitably extract “oil” at over $80-$100/bbl and simultaneously grow real final sales per capita since 2007-08 with oil above $40-$50/bbl, build out renewables to necessary scale, AND maintain the existing liquid fossil fuel infrastructure indefinitely. Something has to give, and that something is growth of real final sales per capita, the continuing build out of renewables, a Tesla 3 in every garage, mining asteroids, and colonies on the Moon and Mars.
This is clear evidence of the effects of Peak Oil, population overshoot, and Limits to Growth.
Yet, electricity prices are starting to go negative during sunny times many place around the world? Power sources will shift, especially as fossil fuel prices go up and solar improves but “COLLAPSE” not imminent.
Certain people love an apocalypse story
Peak Whale oil anybody?
I worried we may run out of timbers for masts on ships.
Well, “BC” has hit the nail on the head. He is absolutely correct. Our entire economy in the second half of the 20th century was based on less than $20/bbl oil. It can’t survive $100+bbl oil. In the US (lower 48) peak production of conventional oil occurred in 1970 as M. King Hubbert predicted. Shale oil fracking is only possible due to extremely low interest rates the frackers have to pay for capital. The output from fracked shale oil wells falls off dramatically after the 2nd year, which puts the frackers on a treadmill to maintain output. Also, fracking for oil and gas is coming under increasing environmental scrutiny for contaminating groundwater sources and for being linked to increases in seismic activity in the areas being fracked. All of this activity is part of the larger and irreversible decline in global net energy. In a very few years global net oil exports will decline to zero due to increased demand for oil and population growth in the present oil-exporting countries. Note that today China is the largest importer of oil in the world having recently passed the US. Tight oil production is a symptom of how far the oil resource base has declined in quantity and quality. By 2030 world oil production will fall to half of what it is today. Because oil is so integral to industrial economies, there is no substitute for it available at the scale which it is being used today and will be needed in the foreseeable future. Sometime around 2050 human population will begin collapsing due to the lack of oil inputs for agriculture, processing and distribution of food. In ecological terms it will be a classic case of overshoot and collapse. It has happened before and it will happen again. It seems to be part of our DNA to run into limits at full speed.
Our entire economy in the second half of the 20th century was based on less than $20/bbl oil. It can’t survive $100+bbl oil
That’s what people said *before* oil got to $100. But, so far we don’t have The End Of The World As We Know It.
Companies don’t take it lying down when oil/FF prices rise – they reduce their consumption, and if necessary they eventually eliminate it altogether.
They might streamline their trucks, and them switch them to LNG. Their taxi’s might move to hybrids. Their rail might electrify. Their plastic containers will be redesigned to remove mass, then be switched to glass or metal.
Confusion can arise between short and long-term responses. Many businesses wait a while to make big adaptations to higher fuel prices, while they wait to see what shakes out.
For example: taxi fleets. Taxi fleets will try to raise prices to deal with higher gas prices, but generally they don’t have much luck. So, they go to hybrids and NG conversions. Look around: most big city taxi fleets have cut their fuel consumption dramatically.
That’s what big business does. Again, it may take a while – UPS and Fedex are only now really starting to use hybrids, EVs and NG. But, they’ll get there big time. Airlines are buying Boeing 787s primarily to reduce fuel consumption by 20%.
That downward trend was dramatically reversed over the last few years with the advent of horizontal drilling and fracturing to get oil out of tighter geologic formations, as seen in the green region in the graph above. If success with tight oil formations continues, we may yet see the historical peak production of many of the states above eventually exceeded, and indeed perhaps even for the United States as a whole.</b.
The problem is that outside of the core areas of shale formations production is uneconomic and those areas that are actually quite good are tiny and nearly tapped out. After nearly a decade of looking I have yet to find a shale producer that has self funding shale production. The 10-Ks show that the increased production is paid for by more debt, not cash flow out of production. What makes the whole thing interesting for me is the use of EURs instead of the rates indicated by the actual production data. Eventually the accountants or the SEC will blink and all those balance sheets will have to be revalued. The problem is that when that happens the prop that is holding up the USD will collapse and the currency might go with it. No wonder there is talk of a New Bretton Woods with the USD being stripped of its key currency status.
1. Rune, over at Fractional Flow (who is a “peaker blogger”) said that in the Bakken it has shifted to essentially self-funding (cash flow=investment in new wells.)
Note, some remaining equibrium level of remaining debt is normal and optimal. See the discussion of capital structure in Brealey and Myers. Tax benefit of debt, etc. Given these are pretty stable entities with predictable flow (not biotech stocks), they should be pretty leveraged.
2. The 10Ks that I have looked at (KOG, Whiting, CLR, Oasis) seem to emphasize PV-10 (required reporting type) rather than EURs. I suggest that the PV-10 has less uncertainty than the EUR. And that financially, the tail is not as important as you think because of time value of money, rather than bragging rights.
There is also an element of technological innovation that keeps the existing conventional fields producing for much longer time than originally anticipated. For example the Ekofisk field in Norway (http://www.npd.no/en/Publications/Facts/Facts-2010/Chapter-11/Ekofisk/).
Yes, but . . . .
Improved technology and new fields allowed Norway to keep their post-2000 decline rate* down to about 6%/year, as Norway’s Crude + Condensate production fell from 3.2 mbpd in 2000 to 1.5 mbpd in 2013 (EIA).
Globally, in my opinion it is very likely that actual global crude oil production (45 or lower API gravity crude oil) peaked in 2005, while global natural gas production and associated liquids (condensates & natural gas liquids) have so far continued to increase.
*This is the net decline rate, after contributions from new wells, enhanced recovery efforts, etc.
Unless I have it wrong, and I am confident I don’t, aside from average oil well depth (with fracked wells typically being “mulitiples deeper” than conventional oil wells, historically the average annual “decline rate” for a conventional oil well is about 8%. This in contrast with the average annual decline rate for a fracked (or tight oil) well of about 43%. It seems to me this militates against the U.S. becoming oil self-sufficient through fracking, as fracking’s economics are fragile over time. Fracking is not “the lowest hanging fruit”, it is quite the opposite.
Ian,
Note that the tight/shale plays tend to show a hyperbolic decline rate curve on a per well basis, i.e., the decline rate starts out very high and slows with time, or the wells shows something like a two or three stage exponential decline rate. In any case, perhaps the best way to evaluate the plays is by estimating the gross underlying decline rate from existing production. This would be the rate of change in production if no new wells were drilled in a play from one year to the following year. Some additional comments follow.
Tight/Shale Plays to the Rescue?
The conventional wisdom today is that increased production from North American and global tight/shale plays will power the globe to a virtually perpetual rate of increase in global oil and gas production.
However, it’s interesting to look at some regional declines in US oil and gas production, e.g., marketed Louisiana natural gas production (the EIA doesn’t have dry processed data by state).
According to the EIA, the observed simple percentage decline in Louisiana’s annual natural gas production from 2012 to 2013 was 20%. This would be the net change in production, after new wells were added. The gross decline rate (from existing wells in 2012) would be even higher. This puts a recent Citi Research estimate in perspective.
Citi estimates that the gross underlying decline rate for overall US natural gas production is about 24%/year. This would be the simple percentage change in annual production if no new sources of gas were put on line in the US. In round numbers, this requires the US to add about 16 BCF/day of new gas production every year, just to maintain about 66 BCF/day of dry processed natural gas production. To put 16 BCF/day in perspective, dry processed natural gas production from all of Texas was probably at about 18 BCF/day in 2013.
Based on the Citi report, the US would have to replace 100% of current natural gas production in about four years, just to maintain a dry processed gas production rate of 66 BCF/day (24 TCF/year) for four years.
Or, based on the Citi report, the US has to replace the productive equivalent of all of the 2012 dry natural gas production from the Middle East, in a little over three years (3.3 years), in order to maintain a dry production rate of 24 TCF/year. Over a 10 year period, we would need to put on line three times the 2012 production rate from the Middle East.
On the oil side, according to the EIA, the observed 10 year exponential rate of decline in Alaska’s annual Crude + Condensate (C+C) production from 2003 to 2013 was 6.5%/year. This would be the net change in production per year, after new wells were added. The gross decline rate from existing wells would be even higher.
If we assume a (probably conservative) decline rate of 10%/year from existing US C+C production, in order to just maintain current production for 10 years, we would have to replace the productive equivalent of every oil field in the US over the next 10 years–the productive equivalent of every oil well from the Gulf of Mexico to the Eagle Ford to the Permian Basin to the Bakken to Alaska.
Of course, the general consensus is that the tight/shale revolution will spread around the world, and it’s certainly possible, but note that in 2013, while overall Bakken Play production was still increasing, the average Bakken oil well produced a little over 100 bpd, while the median production rate was less than 100 bpd, with a very high per well decline rate. Furthermore, this does not take into account wells that have already been plugged and abandoned. I have a hard time believing that per well production rates like this will work in much higher cost operating areas around the world.
In addition, as the Monterey Shale Play case history shows (the EIA reduced their estimate of possible recoverable reserves by 95%), not all US shale plays will be commercially productive in meaningful quantities, and most commercial plays in the US tend to be gas prone.
Assuming hyperbolic declines, do we have enough data to estimate what long term rate the flow will converge to? If the rate is low enough, it no longer pays to collect the stuff. Although I suppose that at $100/bbl, even a few barrels per day would be worth driving a truck around to get it.
Ian,
Please see my question below, at 11:25 AM.
1. The decline % varies by age with a well. I’m not sure what your averages mean or how to think about them with different populations (ages of wells).
2. It’s a negative factor. But not a killer, not mathematically. Unconventional can still beat conventional if the IPs are higher or if you just drill more wells. (After all the decline of a coal mine is about infinite when you stop scratching at the coal face…it has no flowback.)
3. In fact what we see happening right now…is unconventional growing while conventional declines. So what matters is the opportunities available. (If you don’t have any Spindletops, that’s why you don’t do them.)
JDH writes:
“Today’s frackers would all be put out of business if we were to return to the oil prices of a decade ago.”
Professor, just how many commodity producers or businesses in general would not be put out of business if their prices returned to a decade ago?
Bob Brackett at Bernstein estimates the marginal cost of shale at $111 / barrel in the US, and most of the producers are above $80. This is still not true, for example, of Middle East producers. The Iraqis are at a fraction of this.
Stephen:
In a free competition situation (US), you would expect the marginal cost (everything included) of the last supplier to equal price. In a non-equilibrium situation of course, you could have someone selling based on variable costs (or the converse…capturing rents), but long term, this is just econ 101. P-Q curves and crossed lines and all that. So 111 is not so strange. And it doesn’t even posit a decline (there are aspects of speed involved, pad drilling etc.) such that it is at least theoretically possible for marginal cost to drop for a given producer with time and more supply to come on line at 111.
Arabs have lower marginal cost. See! Cartel, cartel, cartel! Those jerks are trying to band together and earn rents they would not get in a free competition situation.
Professor,
How much of the decline in production is due to environmental limitations?
It is curious that today we use more devices than ever that use electricity. Not a waking moment goes by without using a device needing power. We are much more dependent on power than ever yet usage has declined. The questions of energy production is much greater than supply only. While demand cannot make a well produce more or a mine produce more or most factories produce more, demand can stimulate research, exploration, and techniques that can increase production while innovations satisfy increasing demand.
Ricardo,
Your 2nd paragraph is spot on. We need to replace oil with cheaper, better alternatives, which are here already (PHEVs, EREVs, EVs, heat pumps, etc.), and keep on innovating further.
the 1st paragraph is a bit of a red herring – I’m not really aware of any environmental limitations that would produce this kind of decline. Now, there are some potential in areas that are off limits (which is different), but my impression from people in the oil business is that it isn’t really all that large.
Ricardo –
I am currently completing the demand chapters of my book, and I have worked through demand forecasts country by country. Global inherent demand growth, that is, demand growth assuming an unconstrained oil supply at $65 / barrel, is estimated at 2.9 mbpd / year to 2020, and 4-6 mbpd / year to 2040. Inherent demand is estimated at 150 mbpd in 2030, up from 92 currently. Virtually none of the increase comes from the OECD; 44% comes from China, the remainder from other non-OECD countries (fairly similar to recent patterns).
The fastest growth the oil supply has even seen was 2.7 mbpd / year from 1960 to 1972.
There has been significant innovation in oil production techniques in the last decade, shale oil production being the most important. However, there has been and continues to be innovation in fields like deepwater and Arctic oil. Notwithstanding, capex per barrel has been increasing at 11% per year net of technological innovation. This speaks to Jim’s point: innovation is not much of a match for field depletion, at least is hasn’t been.
Oil supply growth, thanks to shale and oil sands, has not been a complete disaster. However, this has proved unable to move the needle, in terms of price. Inherent demand analysis tells us why. There’s lots of latent demand out there, and if the price falls just a bit (“a bit” to be quantified), then the marginal consumer is more than prepared to step in and take the oil. Hence the tendency for the oil price to stay pegged at the carrying capacity level.
Like it or not, the global economy abandoned dependence on renewable (but not sustainable) energy supplies in 1859, when Drake struck oil in Titusville. Coal came into widespread use after 1850, and by 1910, the global economy had committed fully to fossil fuels. This choice ultimately led to the fastest economic advances for the greatest number of people ever witnessed. It supports 7 billion people today.
We are now in the twilight of oil (though not coal). When we have materially exhausted the potential of our endowments, where do we turn? That’s the question.
Like it or not, the global economy abandoned dependence on renewable (but not sustainable) energy supplies in 1859, when Drake struck oil in Titusville.
it’s important not to exaggerate biomass’ contribution: wind and water power were very important.
We are now in the twilight of oil (though not coal). When we have materially exhausted the potential of our endowments, where do we turn? That’s the question.
Wind, solar and nuclear are entirely viable. On-shore wind is cheaper than new coal, in the US. Solar has hit grid parity in many places, and it’s cost continues to plunge. All three are scalable, affordable, and much cleaner than coal and oil (though nuclear certainly has it’s own risks).
People get distracted by biomass: most replacements for oil don’t have to be liquid, and biomass need only be a niche supply of non-food energy.
“There’s lots of latent demand out there, and if the price falls just a bit (“a bit” to be quantified), then the marginal consumer is more than prepared to step in and take the oil. Hence the tendency for the oil price to stay pegged at the carrying capacity level.”
This is called elasticity of demand. It’s an econ 101 concept and applies for just about every product.
“We are now in the twilight of oil (though not coal). When we have materially exhausted the potential of our endowments, where do we turn? That’s the question.”
Well either some product will come in to meet the demand…or it won’t and the consequences will come, essentially high price. Probably there are policy things we could do (support standardized nuke designs, allow fast breeders). But heck even on oil, we have things we could do and don’t (drill the East Coast shelf, ANWAR, Cali/NYS fracking/injection restrictions, stop enforcing oil embargoes on Iran, etc.)
I think I asked you this before and answer that it would be unaffected, but if arctic ice starts increasing again will it make getting arctic oil more expensive?
Steven, do your calculations assume population and affluence growing over the time to 2050? If the world’s economies grow at say 3.5%/pa then the consumption and extraction of resources will be 4x what it was in 2010. Do you find this credible? Are we not already near resources climax, particularly with BaU still rampant? Can you imagine at least double the food production but the soils are being degraded, more and more CO2?
I am really concerned about it because the inevitable correction will be worse for the future of our species the longer we delay doing anything to combat the waste of resources. Some renewable resources, like fisheries, may be exhausted such that recovery will not be possible. Climate change will bite too later.
Do you know Simon Michaud’s talk about mining?; https://www.youtube.com/watch?v=TFyTSiCXWEE
Also the Ted talk by Harald Sverdrup?; http://www.youtube.com/watch?v=b2OzyNpPe5s
What are your thoughts?
If the world’s economies grow at say 3.5%/pa then the consumption and extraction of resources will be 4x what it was in 2010.
That doesn’t follow. US GDP is 2.5x as large as 1979, but oil consumption is less. Raw/smelted steel consumption is less. Food calorie consumption is only slightly higher per capita (and people would be healthier if it were lower).
Resource consumption follows an S-curve (growth then plateau), and can even fall as GDP grows.
Re: “Net Export Math”
A simple model, several case histories and some basic math confirm the following:
Given an inevitable production decline in a net oil exporting country, unless they cut their oil consumption at the same rate as the rate of decline in production, or at a faster rate, the resulting net export decline rate will exceed the production decline rate, and the net export decline rate will accelerate with time (on a year over year basis). Furthermore, if the rate of increase in consumption exceeds the rate of increase in production, a net oil exporting country can become a net importer, prior to a production peak, e.g., the US and China. I define the combined net exports from the (2005) Top 33 net oil exporters as Global Net Exports of oil (GNE).
Given an inevitable ongoing decline in GNE, unless the Chindia region cuts their consumption of GNE (Chindia’s net imports = CNI) at the same rate as the rate of decline in GNE, or at a faster rate, the resulting rate of decline in ANE (Available Net Exports, or GNE less CNI) will exceed the rate of decline in GNE and the rate of decline in ANE will accelerate with time.
One of the most overlooked characteristics of net export declines is that the bulk of post-net export peak CNE (Cumulative Net Exports) are shipped early in the net export decline period.
The Six Country Case History consists of the major net oil exporters (net exports of 100,000 bpd or more) that hit or approached zero net exports from 1980 to 2010, excluding China. China, like the US, became a net importer prior to a production peak, because of a rapid rate of increase in consumption. Combined production from the Six Countries virtually stopped increasing in 1995, showing only a 2% increase from 1995 to 1999.
The following chart shows the normalized values for production, ECI Ratio (ratio of production to consumption), net exports and remaining post-1995 CNE (Cumulative Net Exports) by year (1995 values = 100%).
http://i1095.photobucket.com/albums/i475/westexas/Slide2_zps6c3a6280.jpg
Note that even as production increased slightly from 1995 to 1999 (by 2%), net exports fell, because of rising consumption, as illustrated by the decline in the ECI Ratio. And note that even as production increased from 1995 to 1999, remaining post-1995 CNE fell by 54%.
Estimated Six Country post-1995 CNE were about 9.0 Gb (billion barrels) based on the 1995 to 2002 rate of decline in their ECI ratio. Actual post-1995 CNE were 7.3 Gb.
The key point is that a declining ECI Ratio corresponded to a rapid rate of depletion in remaining CNE, and even as Six Country production rose from 1995 to 1999, the rate of depletion in remaining post-1995 CNE accelerated, from 15%/year in 1996 to 26%/year in 1999.
Global Net Exports of oil (GNE)
GNE, the combined net exports from the top 33 net exporters in 2005, fell from about 46 mbpd (million barrels per day) in 2005 to about 44 mbpd in 2012 (2013 EIA consumption data not yet available, but I estimate that GNE in 2013 fell to around 43 mbpd). Combined production from the top 33 net exporters in 2005 rose slightly from 2005 to 2012, but because consumption increased faster than production, net exports fell, as evidenced by the decline in the ECI Ratio.
The following chart shows the normalized values for production, ECI Ratio, net exports and estimated remaining post-2005CNE (Cumulative Net Exports) by year (2005 values = 100%).
http://i1095.photobucket.com/albums/i475/westexas/Slide14_zpsbd9a272e.jpg
Based on the 2005 to 2012 rate of decline in the Top 33 ECI Ratio, I estimate that remaining post-2005 Global CNE fell by about 21% by the end of 2012. As noted above, this methodology was too optimistic for the Six Country Case History, in regard to estimating post-1995 CNE.
Available Net Exports of oil (ANE)
ANE are defined as Global Net Exports of oil (GNE) less the Chindia regions (China + India’s) net imports (CNI). ANE fell from 41 mbpd in 2005 to 35 mbpd in 2012. Based on some preliminary 2013 data, I estimate that ANE fell to between 33 and 34 mbpd in 2013.
The GNE/CNI Ratio is analogous to the ECI Ratio. The following chart shows 2002 to 2012 GNE/CNI data, with the extrapolation based on the 2005 to 2012 rate of decline in the ratio. Based on some preliminary 2013 data, I estimate that the 2013 GNE/CNI value will be between 4.6 and 4.7, which would be consistent with the following projection.
http://i1095.photobucket.com/albums/i475/westexas/Slide20_zps26112103.jpg
At a GNE/CNI Ratio of 1.0, China and India alone would theoretically consume 100% of Global Net Exports of oil, leaving no net oil exports available to about 155 net importing countries. Of course, the global economy can’t survive if only two countries are consuming anywhere close to 100% of Global Net Exports of oil, but that has been direction we have been headed in since 2002, up to and including 2013.
I’ve called what happens from 2012 to 2022, and in following years, to the GNE/CNI Ratio the “$64 Trillion Question.” The conundrum is that we continued to slide, at least through 2013, toward a point in time–a GNE/CNI Ratio of 1.0–that we cannot arrive at.
The absolutely mind-boggling numbers are the estimated post-2005 Available CNE and the rate of depletion in remaining post-2005 Available CNE. Based on the seven year 2005 to 2012 rate of decline in the GNE/CNI Ratio, I estimate that post-2005 Available CNE (the estimated cumulative volume of post-2005 net oil exports available to about 155 net oil importing countries) are about 175 Gb (billion barrels). Through 2012, we burned through about 95 Gb of estimated post-2005 Available CNE, leaving remaining estimated post-2005 Available CNE at about 80 Gb.
Based on my estimates, at the 2012 rate of consumption of ANE, the remaining volume of Available CNE (Cumulative Net Exports) would be depleted in about six years. Of course, the expectation is for a continuing decline in ANE, so Available CNE would not be depleted in six years, but this gives one an indication of just how catastrophic that the ongoing estimated depletion in Available CNE has been.
As a general rule, I’ve found that almost no one is aware of any aspect of the foregoing, and those who are aware of it tend to dismiss it, but the lack of knowledge of “Net Export math,” or one’s denial of same, does not alter the fact that the basic math is irrefutable.
I’ve used the “Midnight on the Titanic” metaphor before, to-wit, the ship hit the iceberg at 11:40 P.M. on the night of April 14th, and at around midnight perhaps three people on the ship–about 0.1% of those on board–knew that the ship would sink, but that did not mean that the ship was not sinking. The ship’s pumps helped, but they could not come close to fully offsetting the flood of seawater coming into the ship. According to Walter Lord, the passengers on the first (partially full) lifeboat to leave the ship were ridiculed by some passengers were still on board.
I suppose that the fact that the ship would sink is a classic example of a predicament versus a problem, i.e., there was no way to save the ship; the best that the captain could do was to try to save as many people as possible (problems have solutions, but one has to develop ways to cope with a predicament).
Jeffrey, what you so brilliantly describe is the Seneca effect/cliff. If only 0.1% understand comprehensively Peak Oil, net energy, net exergetic flows per capita requirements, and GNE, ANE, CNE, and CNI, then it’s likely that perhaps 1 of 100 of the 0.1% further understands the Seneca effect/cliff and its implied consequences, suggesting that as few as a couple of thousand US adults actually understand our predicament/problem and the implications.
It generally takes at least 4% of the population to internalize a meme to be able to communicate and influence the critical mass of ~20%. It takes 3-5 years for a metanarrative to be conditioned and internalized by the critical 20% in order for the metanarrative to diffuse to a majority and resulting expectations and behaviors.
That only an infinitesimally small share of the US population understands generally what you so skillfully describe suggests that you have a big challenge to communicate, inform, and reinforce the critical concepts, and also to disabuse the vast majority of their fallacious assumptions, unsupported beliefs, and expectations that are unlikely to be met.
With the exception of our host Professor Hamilton, this is a task in which economists are utterly failing the public, corporate managers, politicians, planners, establishment technocrats, and mass-media influentials. And, yes, there is certainly the possibility that this is a purposeful omission because of the elites’ perception that the masses “can’t handle the truth”, and it’s better that they/we not know to permit easier “management” of perceptions in order to maintain credibility, legitimacy, power, and control over the masses as long as possible.
If so, regrettably, there is little chance for enlightened policies to serve the majority and avoid the worst effects of falling off the Seneca cliff at the onset of the post-Oil Age epoch.
This makes it even more of an imperative that you continue sharing your exemplary work. Thanks.
Jeffrey & Others
I get a bit confused trying to unwind all the ratios that are stated. Said simply, Jeffery, are you saying that world production of petroleum is decreasing and consumption is increasing? If so, how will the world produce enough energy to sustain world GDP growth? It seems that coal may be the default fuel (if crisis results), rather than solar or wind.
Some definitions:
Net Exports = Production of total petroleum liquids + other liquids less total liquids consumption (EIA data base)
Global Net Exports (GNE) = Combined net exports from (2005) Top 33 net oil exporters, total petroleum liquids + other liquids (EIA)
Available Net Exports (ANE) = GNE less Chindia’s Net Imports (CNI)
CNE = Cumulative Net Exports (for a given time period)
ECI Ratio = Ratio of production to consumption
GNE/CNI Ratio is analogous to the ECI Ratio
The ECI Ratio is analogous to an income to expense ratio. If an income to expense ratio is declining, the company is trending toward a ratio of 1.0, when income = expense, and net income = zero.
If the ECI Ratio for a country or group of countries is declining, they are trending toward an ECI Ratio of 1.0, when production = consumption, and net exports = zero.
The following graph for the (2005) Top 33 net exporters shows their combined ECI Ratio from 2002 to 2012, with the extrapolation based on the 2005 to 2012 rate of decline:
http://i1095.photobucket.com/albums/i475/westexas/Slide09_zps9941ab7e.jpg
The following graph shows GNE from 2002 to 2012, with the gap between where we would have been at the 2002 to 2005 rate of increase versus actual post-2005 values:
http://i1095.photobucket.com/albums/i475/westexas/Slide1_zps3161a25b.jpg
The GNE/CNI Ratio is analogous to the ECI Ratio. Following is the GNE/CNI Ratio for 2002 to 2012, with the extrapolation based on the 2005 to 2012 rate of decline:
http://i1095.photobucket.com/albums/i475/westexas/Slide20_zps26112103.jpg
I estimate that the 2013 GNE/CNI ratio fell to between 4.6 and 4.7 in 2013 (we don’t yet have complete EIA consumption data for 2013), versus 9.5 in 2005.
Based on the extrapolated rate of decline in the GNE/CNI Ratio, China and India alone would theoretically consume 100% of GNE in 16 years, theoretically leaving zero net exports of oil available to about 155 net oil importing countries.
As noted above, we would have seem to have continued to fall, in 2013, toward a point in time that we cannot arrive at (GNE/CNI = 1.0).
The following chart shows ANE (GNE less CNI) from 2002 to 2012, with the gap between where we would have been at the 2002 to 2005 rate of increase and actual post-2005 values shaded red:
http://i1095.photobucket.com/albums/i475/westexas/Slide04_zpsd68833b7.jpg
I estimate that ANE fell to between 33 and 34 mbpd in 2013, versus 41 mbpd in 2005.
My premise is that we are only maintaining something resembling Business As Usual, because of huge, almost totally unrecognized, and accelerating rates of depletion in our consumption of the remaining volumes of post-2005 Global and Available Cumulative Net Exports of oil.
Long, and rather detailed, article that introduces the ECI Ratio concept:
http://www.resilience.org/stories/2013-02-18/commentary-the-export-capacity-index
Hi Jeffrey,
It seems to me that your assumption that a fixed amount of oil will automatically be imported to China and India is incorrect. Perhaps Professor Hamilton could explain that the oil is freely traded in World Markets and will be sold to the highest bidder, perhaps China and India will always be willing to pay more for oil than other countries and outbid those countries for oil, but I see no reason that this need to be the case.
For this reason your Available Net Exports (ANE) concept seems problematic. Perhaps there is am economist that can explain it to me.
What has happened is clear. Normalized liquids consumption for China, India, (2005) Top 33 Net Oil Exporters and the US from 2002 to 2012, versus annual Brent crude oil prices:
http://i1095.photobucket.com/albums/i475/westexas/Slide14_zpsb2fe0f1a.jpg
China was up to 204% of 2002 consumption in 2013 (India and the Top 33 also showed increases). The US also showed an increase, up to 96% of the 2002 level, but US consumption remained well below both the 2002 and 2005 levels.
As noted up the thread, what I call the $64 Trillion question is what happens from 2012 to 2022, and in future years, but as noted, it would appear that we continued to slide, in 2013, toward a point in time that we cannot arrive at, i.e., when China & India alone would theoretically consume 100% of GNE.
In any case, as we have discussed, here is the problem: Given an inevitable ongoing decline in GNE, unless the Chindia region cuts their consumption of GNE (their net imports of oil, CNI) at the same rate as the rate of decline in GNE, or at a faster rate, the resulting ANE decline rate will exceed the GNE decline rate and the ANE decline rate will accelerate with time (on a year over year basis).
Some definitions:
Net Exports = Production of total petroleum liquids + other liquids less total liquids consumption (EIA data base)
Global Net Exports (GNE) = Combined net exports from (2005) Top 33 net oil exporters, total petroleum liquids + other liquids (EIA)
Available Net Exports (ANE) = GNE less Chindia’s Net Imports (CNI)
Hello AS,
I don’t think coal will be the default fuel, crisis or not for very long even if some here think it will. Anthropogenic Induced Climate Change, nothwithstanding.
Unfortunately for those who believe that Solar and Wind can and will sustain our current industrial civilization, I’m afraid the laws of thermodynamics and basics of EROEI tell us that won’t work either, but I digress, back to coal.
From the late Dr. Albert Bartlett’s transcript on Arithmetic, Population and Energy.
“Well, in the energy crisis about thirty years ago, we saw ads such as this (shows slide). This is from the American Electric Power Company. It’s a bit reassuring, sort of saying, now, don’t worry too much, because “we’re sitting on half of the world’s known supply of coal, enough for over 500 years.” Well, where did that “500 year” figure come from? It may have had its origin in this report to the committee on Interior and Insular Affairs of the United States Senate, because in that report we find this sentence: “At current levels of output and recovery, these American coal reserves can be expected to last more than 500 years.”
There is one of the most dangerous statements in the literature. It’s dangerous because it’s true. It isn’t the truth that makes it dangerous, the danger lies in the fact that people take the sentence apart: they just say coal will last 500 years. They forget the caveat with which the sentence started. Now, what were those opening words? “At current levels.” What does that mean? That means if—and only if—we maintain zero growth of coal production.”
Granted, ‘Long’ is a relative term >;-)
Cheers,
Fred
You may find this David Rutledge post interesting. It suggests that we may be near peak coal production.
On the other hand, for coal the pattern has been that countries produce only a small fraction of their early reserves, and then late in the production cycle the reserves drop to match the coal at the last working mines. This pattern is seen in the UK (cumulative production of 19% of early reserves), Pennsylvania anthracite (42%), the Ruhr Valley (14%), France and Belgium (23%), and Japan and South Korea (21%). This means that the reserves criteria have been too optimistic, but it also means that world coal reserves are a good upper bound on future production. An IPCC scenario that burns two times or seven times the reserves is utterly at odds with the historical experience.
Solar and Wind …I’m afraid the laws of thermodynamics and basics of EROEI tell us that won’t work either
How do the laws of thermodynamics apply? Wind’s EROEI is about 50:1 (in other words, you get back the energy invested in about 6 months). Solar is well above 20:1, which is better than new oil (at about 10:1).
Some excerpts from my post up the thread follow. In general, I have found that I tend to get qualitative objections to what is a quantitative argument.
Interestingly, if you deflate WTI with the US CPI ( 1982-84 = 100) it was $96.77 in April, 1980 and only $85.63 in April 2014.
This makes if look as if technology rather than pries is what is driving US oil output higher.
Using real prices would sharply reduce the fit in your chart of prices and Texas production.
Spencer, below is spot and Cushing spliced after 1986 adjusted for CPI and the trade-weighted US$ (majors) and shown with real final sales per capita (RFSPC):
https://research.stlouisfed.org/fred2/graph/fredgraph.png?g=G3K
The 3- and 5-year average price of oil has been $91-$95, which is ~35-55% above the average during the peak period of the late 1970s and early 1980s.
Note that US RFSPC does not grow with the adjusted price of oil above $40. RFSPC was flat during 1978-1983 and 1989-92 with the price of oil above $40, however, there has been no growth of RFSPC since 2007-08 during which the average price of oil has been ~$89 vs. $33-$55 in 1978-82.
Yet, in order for tight, deep, and tar oil to be profitable to extract, the price has to be $80-$85 to $100. Oops! We can’t afford to extract costlier, lower-quality crude substitutes AND grow RFSPC. If we can’t grow RFSPC with oil above $40, we can’t afford to build out a renewables infrastructure AND maintain indefinitely the fossil fuel infrastructure.
No one is telling us this. Rather, we are told we can maintain our civilization on solar- and wind-generated electricity while having a Tesla Model 3 in every garage, mining asteroids, colonizing the Moon and Mars, and living in caves under the surface of the Moon to avoid the eventual lethal effects of cosmic radiation.
https://app.box.com/s/bxkb3903behn9wayoh33
https://app.box.com/s/uagkxzk62tvtluc21r3c
https://app.box.com/s/npesogbyl519q9w02wh9
https://app.box.com/s/b1u4tvlri34suheb4kae
https://app.box.com/s/lei6nd3bhwjjdtkbylxl
Also, US oil consumption to final sales and wages is again at the historical recessionary threshold YTD, which is causing an acceleration of CPI from 1.5% at the end of 2013 to 3.8% q-q annualized for Q2, reducing real q-q annualized after-tax incomes/wages to effectively ~0%.
https://app.box.com/s/efge728snlhly572u0pc
https://app.box.com/s/0lav88oqrnqo2u3adn92
https://app.box.com/s/qw3qulo71ddw7fl5nebj
Although one is not likely to hear this, we’re experiencing a mini-oil shock (by duration so far) to real, after-tax profits and incomes that historically has coincided with recessions when RFSPC was not growing for 3 successive quarters, as is the case today.
But one would not know it by observing the stock market, which has become a lagging indicator for the economy since the late 1990s.
Moreover, because the LEI is heavily influenced by stock prices, the yield curve, and money supply that is not adjusted by surging bank reserves/cash assets, the LEI will likely miss a recession because the yield curve does not invert during debt-deflationary regimes that we are currently experiencing, and the stock market will turn down only AFTER a recession begins and is eventually recognized, as in 2001 and 2008.
The US, EZ, and Japanese economies are likely in recession YTD as a result of the ongoing structural effects of Peak Oil making the global economy much more susceptible to weather and oil shocks, this time owing to geopolitical events with the secular trend rate of RFSPC at 0-1%.
Oops! Correction to the chart. Aforementioned average prices are slightly different but the inferences remain intact.
https://research.stlouisfed.org/fred2/graph/fredgraph.png?g=G48
1980 was the Second Oil Shock. The was accompanied by two deep recessions, a fall in global consumption by 6 mpbd, and in increase in capacity of 7 mbpd, all by 1984. Didn’t happen this time around.
Correct, Stephen, because of the trillions of dollars invested in China-Asia by US and Japanese supranational firms since the 1980s-90s, which resulted in an increase in demand for energy and materials that otherwise would not have occurred organically in China.
http://timesofindia.indiatimes.com/business/india-business/Chinas-FDI-inflows-decline-by-6-7-in-May/articleshow/36705605.cms
http://www.globaltimes.cn/content/870624.shtml
Were US and Japanese FDI to begin to reverse and contract, which I anticipate will eventually occur, if not already underway, China’s economy will contract via the FDI to investment, production, and export multiplier on a scale of the West during the Great Depression.
We are rapidly approaching the event horizon of China’s financial and economic black hole that risks sucking the entire global economy into it.
I wonder why we hardly ever see anyone blaming oil prices as one of the reasons US real growth has been so weak in recent years?
Spencer: “I wonder why we hardly ever see anyone blaming oil prices as one of the reasons US real growth has been so weak in recent years?”
It would risk invalidating the meme about the US becoming “energy independent” and require closer scrutiny of the effects of the price of oil, imperial foreign policy, and the viability of deep, tight, and tar crude substitutes and “alternative energy”/”renewables”.
This in turn would prompt a reordering of the production structure, division of labor, transportation infrastructure, and housing type and urban planning; examine the merits and costs of fractional reserve banking, debt-money, and a debt-based mass-consumer economy; change the tax code to discourage rentier speculation and no-velocity financial capital accumulation while encouraging domestic productive investment and production, savings, and higher labor returns to GDP/final sales; emphasize conservation, recycling, and ecological remediation; and to address the debilitating effects of gross wealth and income inequality/distribution.
Because you’re not PC if you do.
If lack of oil means lack of growth, then more oil means more growth. So then the primary response of the government would be to take steps to increase the oil supply, eg, approve Keystone, Alaska and more fracking. This is perceived as not environmentally friendly, and most economists don’t want to be on the ‘polluter’ side of the debate. Add to this a general ignorance about the oil supply and demand, and well, oil is ignored as a factor, at least in officialdom.
But we’re slowly cranking through the explanations for slow growth: financial crisis, lack of deficit spending, too tight monetary policy, and now demographics. Either the economy will resume rapid growth, an already proposed cause for slow growth will be validated, or sooner or later, oil might creep into the conversation.
Because you’re not PC if you do.
Also, because it would be misleading – if oil were a primary barrier to US back, we’d see inflation – we don’t OTOH, I agree that oil is a significant secondary problem for economic growth: the sensible primary policy is to reduce our consumption, rather than encouraging mega projects in the arctic. Just a note: “PC” was invented by conservatives to suggest that “liberals” dominated the world. FBOW, that’s also not realistic.
If lack of oil means lack of growth, then more oil means more growth. So then the primary response of the government would be to take steps to increase the oil supply, eg, approve Keystone, Alaska and more fracking.
It’s not realistic to suggest that the US federal government is standing in the way of oil production. For whatever tactical reason, the Obama administration has bent over backwards to support oil production.
I had the impression that Keystone would primarily carry Canadian production, not US. Is that your understanding?
We don’t see inflation because of constraints on lending and resulting low rates are only availible to fuel stock buybacks and M&A. On top of that, why invest in productive capital if there is no prospect of broad growth in disposable income to buy more product.
That sounds plausible: a lack of lending, and a lack of desire to invest due to pessimism. Which is different from the problems caused by a lack of supply of commodities such as oil.
Stephen, yes, but if one understands net exergetic flows per capita, one also understands that we cannot grow the economy in real final sales per capita no matter how much supply if the price of oil in constant dollars persists above $40.
As scarce resources of savings and intellectual, physical, and human capital are deployed to extract costlier, lower-quality “oil” at an increasing rate and cost, the systemic net energy and net exergetic flows per capita fall, reflecting diminishing returns to increasing costs at falling output per capita. Even more credit and capital is thrown at the problem in a desperate, and eventually futile, attempt to keep the rate of extraction increasing at a profitable level. This is the classic situation of the Red Queen Race or the Seneca cliff.
The situation is akin to increasing the costs of extracting at the fastest rate possible the felling of forests, netting of fish, diversion of rivers to irrigation, tilling of marginally fertile topsoil, etc., ensuring the loss of future supplies at affordable price that can be sustained at the necessary per capita consumption to sustain the population and modern civilization. We have much in common with the Easter Islanders, Mayans, and Anasazi in this regard.
Then imagine the rare politician, economist, enlightened corporate exec, and opinion-shaping mass-media influential who dared to say so in good faith, intention, and earnestness. He or she would be run out of town before getting halfway through his/her presentation.
WInd, solar and nuclear electricity are very high quality. They have very high E-ROI (net energy), they’re scalable, affordable, etc.
They’re cheaper and better than oil.
Heck, electricity for an EV costs 25% as much as the gas for the average US car (4 cents vs 17 cents per mile)
Professor Hamilton,
given your post on the history of oil production (which was excellent by the way), it does appear that unless the tight oil industry can provide a sustained output, domestic oil production peaked decades ago and will not be a reliable, growing source moving forward.
do you feel oil should maintain an important component in the nation’s energy policy moving forward? perhaps some input on why you feel it should/not be part of energy policy going forward? from an economics perspective, should we be dependent upon an energy source which appears to be dwindling domestically-unless the tight formations are able to produce consistently long term.
i think people on the blog appreciate your expertise on the subject, and would be grateful for insight you see on the future of domestic oil-or oil in general.
This is all good but frankly the same old story we already know. What I’d like to see you take on is the combination of oil and gas. Without taking into account possible new discoveries or technology improvements, we’re looking at a major shift in the 2020s with oil becoming scarcer while gas becomes more plentiful. We should be looking at electric cars, mass transit, high speed trains etc mainly in that context.
+1
We often hear the claim that “fracked” wells have much higher decline rates than conventional wells.
But, charts (a) through (e) all show very high decline rates. For instance, chart a (wells drilled 1990-1992) shows production starting about 160 bpd, and declining to about 20 bpd in 36 months. That’s not 8% per year. We see roughly 75% decline in the first year (160->40), 35% in the 2nd (40->25), and 20% in the 3rd (25->20). Succeeding years show somewhat lower decline rates, because the initial rates are lower.
So, are tight oil wells really declining faster? Are those historic decline charts inaccurate?
On the face of it, my read is the same as Nick’s.
The production rates shown in charts a) through e) represent only about 2% of the wells drilled during the period, namely those wells that were the only well per lease. The study authors only had lease data, so to get ‘representative’ well production data, they looked at leases with only one well. , Since only one well was drilled per lease, I doubt that these wells had production curves that were representative of wells found in a conventional play.
Joe,
If we look at the discussion for Figure 2 in the original study, we see that the authors include only leases where there has been no drilling over the study period. If we look at the chart, we see that production starts in 1990 at 8 barrels per day, and declines to two bpd by 2008. That’s a “stripper well” level, which arguably isn’t very meaningful. Figure 9b is intended to address this objection: we see that the top 1% of leases decline at about 16% per year. The authors note that “The production declines are steeper in figure 9 than in figure 2, suggesting that…high-volume leases have relatively high decline rates”. We can guess that if these samples isolated just high producing wells (instead of including a mix of volumes), that the decline rates would be even higher.
The discussion for Figure 10, which Prof. Hamilton used above, supports your argument of the sample not being representative. OTOH, the initial production rates are much higher than the average, at 160 bpd in 1990. That suggests that these well are actually much more representative of “normal” economic wells. We might guess that these are simply leases that have very small acreages.
Could you provide a more detailed argument as to why these would not be representative of all conventional wells?
Not sure that’s right. I thought that initial decline was large, but production was stable long term.
Gregory Zuckerman on the Frackers and the Energy Revolution
Nick G., the economics of fracked vs conventional oil well is very different.
In a conventional oil well virtually all your costs are fixed cost so even when the flow of oil falls to just a fraction of the original flow it still cost you virtually nothing to continue pumping the remaining oil out of the deposit.
But in a fracked well you still have to spend very large sums pumping water and/or hydrolic fluids down the well so that when the oil flow falls below the first levels it quickly becomes unprofitable to continue trying to recover the remaining oil in the deposit.
This is why your observations about the volume of oil in conventional wells is not a good guide for fracked wells.
Spencer,
It’s my understanding that the pressurization and fracturing happen once, at the beginning, and for the rest of the life of the well the flow is reversed. IOW, it’s a one-time expense at the beginning, just like conventional wells.
More importantly, how do the decline rates compare?? The charts above suggest that conventional Texas wells decline just as quickly as “tight” oil wells.
Nick,
A couple of points.
Note that five Texas charts focused on a time period that began about 20 years after the (so far) Texas crude oil peak in 1972. In many cases, a lot of the wells being put on line were from “Tight” zones, like the Spraberry Trend in West Texas. Also, note the steady decline in the initial average production rates, which probably reflected the fact that companies were exploiting smaller and smaller (conventional) fields. Also, the charts all correspond to a period in which we saw an overall decline in Texas production.
What is not shown are the contributions from the high quality giant oil fields like the East Texas Field. The East Texas Field is about 45 miles long, on the west flank of the Sabine Uplift. The field was found in 1930, and 40 years later the wells on the east (structurally highest) side of the field were capable of virtually the same amount of oil in 1970 as they could make in the Thirties. In contrast, I suspect that about 90% of currently producing shale oil wells, 10 years hence, will already be plugged and abandoned or down to the vicinity of 10 to 20 bpd or so.
What we are not finding globally are the conventional giant fields, like East Texas and Prudhoe Bay, but the oil optimists are arguing that increased production from North American and global tight/shale plays will power the globe to a virtually perpetual rate of increase in global oil production.
Following is a (slightly edited) excerpt from one of my posts up the thread:
On the oil side, according to the EIA, the observed 10 year exponential rate of decline in Alaska’s annual Crude + Condensate (C+C) production from 2003 to 2013 was 6.5%/year. This would be the net rate of change in production, after new wells were added. The gross decline rate from existing wells would be even higher.
If we assume a (probably conservative) decline rate of 10%/year from existing US C+C production, in order to just maintain current production for 10 years, we would have to replace the productive equivalent of every oil field in the US over the next 10 years–the productive equivalent of every oil well from the Gulf of Mexico to the Eagle Ford to the Permian Basin to the Bakken to Alaska.
Of course, the general consensus is that the tight/shale revolution will spread around the world, and it’s certainly possible, but note that in 2013, while overall Bakken Play production was still increasing, the average Bakken oil well produced a little over 100 bpd, while the median production rate was less than 100 bpd, with a very high per well decline rate. Furthermore, this does not take into account wells that have already been plugged and abandoned. I have a hard time believing that per well production rates like this will work in much higher cost operating areas around the world.
Jeffrey,
Are you saying that you believe that the 5 charts at the beginning of the post are non-representative and therefore inaccurate?
Professor Hamilton writes that “A recent study of every well drilled in Texas over 1990-2007 by Anderson, Kellogg, and Salant (2014) documents very clearly that production flows from existing wells fall at a very predictable rate that is quite unresponsive to any incentives based on fluctuations in oil prices.”.
Perhaps 80 years ago wells performed better, but this study suggests that conventional oil wells have been declining at a very high rate (similar to “tight” oil wells) for the last 24 years.
Do you disagree?
Yikes. I hate the inabilty to correct a comment. I looked at the HTML code twice, and still didn’t see that I’d typed it wrong. Here’s what that comment should look like (if the moderator has the time, I’d love it if they could copy the correct text into the comment above):
Jeffrey,
Are you saying that you believe that the 5 charts at the beginning of the post are non-representative and therefore inaccurate?
Professor Hamilton writes that “A recent study of every well drilled in Texas over 1990-2007 by Anderson, Kellogg, and Salant (2014) documents very clearly that production flows from existing wells fall at a very predictable rate that is quite unresponsive to any incentives based on fluctuations in oil prices.”.
Perhaps 80 years ago wells performed better, but this study suggests that conventional oil wells have been declining at a very high rate (similar to “tight” oil wells) for the last 24 years.
Do you disagree?
In regard to projecting trends, production from the North Slope of Alaska increased from 1.5 mbpd (C+C, EIA) in 1981 to 2.0 mbpd in 1988. At this rate of increase, following is where we would be in 1993 and then 2003 and 2013:
1993: 2.5 mbpd
2003: 3.8
2013: 5.7
Actual production in 2013 was 0.5 mbpd, a 5.5%/year rate of decline in production (net rate of change after new wells were added), from 1988 to 2013.
While the general consensus in the media these days is that oil wells no longer decline, back in the real world, and away from the Fantasy Island echo chamber, it’s when, not if, that the contributions from new wells can no longer offset the declines from existing wells, i.e., Peaks Happen.
And note that at a given decline rate from existing wells, as total production increases, the annual volume of production lost from existing wells increases. For example, if we assume that the decline rate from existing wells is 5%/year, and if production from a field increased from 1.0 to 2.0 mbpd, the annual volumetric decline would increase from 50,000 bpd per year to 100,000 bpd per year.
So, the higher the production volume, the closer we are to the point in time that the contributions from new wells can no longer offset the declines from existing wells.
And as I have occasionally opined, the mathematics of net export declines are far different from simple exponential production declines like the North Slope of Alaska, which peaked at 2.0 mbpd in 1988.
As I noted several years ago, if we assume a region with a peak production rate of 2.0 mbpd, with a production decline rate of 5%/year (very similar to the North Slope) and if we assume consumption of 1.0 mbpd at peak production, with a consumption rate of increase of 2.5%/year, net exports go to zero in 9 years. At peak + 8 years, the production decline rate would still be 5%/year, but the net export decline rate would be 27%/year. In order to avoid an accelerating rate of decline in net exports, the exporting country would have to cut their consumption at the same rate as the rate of decline in production, or at a faster rate.
North Slope Chart:
http://gov.alaska.gov/parnell_media/natural_resources/NorthSlopeProductionGraph012313.jpg
Why this thread, Professor Hamilton??
An examination of a 150 years of world wide goo production
should have precluded the necessity of your narrative.
The Malthusians continue the old trick and pony show..Then you
must know, that 70%+ of all crude reserve is under control of the
highly efficient governmental units.
This post fracas and fracks all standard drilling wisdom.
For the first figure, it would be useful to keep the y-axis scale the same. Newer wells aren’t having the same production drop-off, but they are starting at considerably lower levels. I would have the same comment for the state production levels. Absolute levels is important, as well as relative levels.
we keep trying harder and technology keeps improving. Which force is winning the race?
Is this the best use of engineering talent?
The Chinese seem to be willing to take another, older approach: http://fortune.com/2014/07/11/coal-china/
Many countries could follow suit except for the CO2 bogeyman and rabid environmentalists that pretend coal must invariably lead to more Pittsburghs of the mid-20th century. Our president has drunk the Kool Aid and stands as a major roadblock to a viable energy strategy.
rabid environmentalists
Including such kooky environmentalists as Russia, Saudi Arabia, the United Nations, insurer Swiss Re, , Standard Chartered Bank, the European Commission, the Rockefeller Foundation, management consultancy McKinsey…
http://www.heraldscotland.com/news/transport-environment/report-predicts-the-severe-economic-cost-of-climate-change-1.919675
What’s your take on the Marcellus and on natural gas? Was predicted to peak (gas cliff) in mid-2000s, but right now is growing strongly in volume and at an attractive price.
“Is this the best use of engineering talent?”
The partially free market place says so; why is it
so ambiguous for some.
I just can’t help it. You guys just don’t know what you are talking about. In 1920, basically, you drilled 2000 feet and hoped for a large flowing oil well. Anything else ( a 10 mmcfd gas well, for instance) was uneconomic. Today we are drilling main branch laterals-tomorrow-maybe we drill HUNDREDS of branches off of those. We are only just now playing with gas-lift from the end of the lateral instead of from the bottom of the vertical section, which may make a huge difference in oil recovery. We haven’t seen much activity regarding secondary and tertiary recovery from horizontal holes yet. The point is, we are still leaving a huge amount (maybe even the majority) of the oil in the ground with current tech. Tomorrow we’ll go get the rest. Get out in the FIELD and talk to some old guys (like Harold Hamm) and find out about the changes that have happened and the changes that can happen….. Enjoy your little charts and stuff.
Just to clarify, are you arguing that the finite sum of discrete sources of oil that peak and decline will show a perpetual increase in production?
Mr Boaeman, how right you are as 70 to 90% of a field is left
behind…
The intellectuals and their sage’s pontificate a bleak and black
future, while oilmen propel American into a better and brighter
era.
1. This sort of feels like a long argument that water is wet. Even the optimistic estimates for US shale predict a peak. Why is your post news or new analysis?
1.5. The interesting thing is how “peakers” including a certain econ prof failed to predict the US shale boom. (And quite a few talked down the rise….showing some bias.)
2. One could as easily extract the story of moving from pasture to pasture when oil fields exhaust. There is a famous map of all the world’s shale basins. Lot of oil elsewhere from shale. It really does move the needle, at least at a certain price point.
3. Despite some (strange) comments that no technology developed or geology was confirmed (“Rockman”), the shale oil was not predicted by peakers who anticipated very strong decline in conventional production and high resultant prices. Surely the concept of a “cost curve” (econ 101!) would have anticipated new supplies coming in. Here is a substantial one!
4. Could you please (Hamilton) speak out against the bizarre ELM and “triangle of doom” that gets copied here all the time? It’s strange to see someone drawing a few lines on stochastic price changes and then calling it a P-Q diagram! You’re an economics educator. People here don’t get econ 101 and are spreading bad analysis on your blog comments.
5. The idea of individual states (or even countries) having new peaks as price drives large new tranches of resource is very intuitive if you look at things with a supply (cost) curve. The shape will not be Hubbert bell curve in this instance. Probably the way to think about it is the individual “segments” of supply. But your (and even Hubbert’s) tendancy to mix them all based on geography occludes this. A classic micro-econ industry analysis (as say looking at a commodity chemical) will show this. Another example of course is Canada with tar sands oil coming in, having a repeak.
6. Also, the discussion implies that US shale will undergo some organic growth and death, based essentially on depletion. But a couple of other possibilities exist: (1) demand could lower AT CURRENT PRICES (people could decide they don’t need oil, prefer something else, or it’s use could be restricted by Global Warming regulations) or (2) significant new, other, supplies could come on the market. In this case, price would drop for external reasons and shale boom would die, but not from exhaustion. These possibilities may sound far out, but arguably we have seen them already in the early 80s…heck even in 2008, you saw the plays turn off with the oil price crash.
7. Although one can’t discuss everything all the time, the discussion seems to ignore the cartel aspect of OPEC. You have poo-poo-ed OPEC in the past. But in 2008, when SA and Kuwait withheld several million barrels and raised price from 40 to 100, that was proof of cartel support for the price. [The whole thing even made your white paper look silly.] There is a heck of a lot of “easy” oil in Arabia…if we had a bunch of Texan independents drilling it, do you think price would still be so high or really crashed? If we are really in such peak oil extremis, then Hotelling theory would keep the price pretty high regardless.
8. Futures prices are backwarded. Implies that current prices are higher than natural, based just on depletion anticipation. Hotelling.
9. Natural gas and the Marcellus seem to be an example of new technology (extraction or geology) actually bringing in so much supply as to lower the price. Not just price enabled new production on a cost curve. So it’s at least theoretically possible something like that could happen with oil.
The comments about oil from existing wells versus new well addition are just the basics of how capital intensive industries work. A built ethylene cracker will ton and gun 24-7, 365, Christmas and Easter. But to build a new one? That’s not happening if the price is too low or projected to be too low. I know the professor understands this, it’s basic managerial economics, but he really ought to explain it in this context. Many of his readers lack good micro intuitions. And they would appreciate what is going on, much better if they didn’t see it as something special about oil, but something that informs/confirms how micro econ works in general.
Interestingly for Mr. Kopits and some of the debt-complainers re shale oil, the same applies when making investment decisions in drilling shale wells. If the projected return justifies the well, steel goes in the ground. And it doesn’t matter what the decline curve is, what the rest of my wells are doing or that I have to float some B bonds. All that matters is the NPV. It sure doesn’t matter what the return is on majors investing in Kashagan. Project specific NPV.
Cash is king. Copeland Valuation book. Brealey and Myers Corporate Finance. Mansfield Managerial Economics. Read and understand those books (including the side bars in the Brealey and Myers) and you’ll be able to do better industry analysis. [Maybe a little game theory for the cartel stuff…actually don’t read books on that…they’re too theoretical, but there are some good Phil Parker journal articles on how people really collude.] More insightful and more connected to a context of basic micro. If you want to say oil and gas are different, I disagree. Depletion has been in the accounting books for 100 years. Hotelling made his point 80 years ago (and his point is intuitive anyhow…it’s arbitrage over time). And oil is not the only investment that depletes. A factory can have a limited lifetime. A movie has a decline curve. Etc. Etc. You really will get way more out of looking at the oil/gas industry if you ground it in the basics and then build on that.
James,
This post described the study by Anderson et al as “A recent study of every well drilled in Texas over 1990-2007”
If we look at the discussion for Figure 2 in the original study, we see that the authors include only leases where there has been no drilling over the study period. Practically speaking, these leases represent lease-holders who are very passively involved. We can reasonably describe this as including only leases where lease-holders are no longer actively investing in their lease.
Wouldn’t this, almost by definition, invalidate a study of price-responsiveness of oil investment?
Did Global Crude Oil Production* Peak in 2005?
*45 and lower API gravity crude oil, not crude + condensate
In my opinion, it is very likely that actual global crude oil production (45 or lower API gravity crude oil) peaked in 2005, while global natural gas production and associated liquids (condensates & natural gas liquids) have so far continued to increase.
I’ve always thought it odd that when we ask for the price of oil, we get the price of 45 or lower API gravity crude oil, but when we ask for the volume of oil, we get some combination of crude oil + condensate + NGL (Natural Gas Liquids) + biofuels + refinery gains.
This is analogous to asking a butcher for the price of beef, and he gives you the price of steak, but if you ask him how much beef he has on hand, he gives you total pounds of steak + roast + ground beef. Shouldn’t the price of an item directly relate to the quantity of the item being priced, and not to the quantity of the item plus the quantity of (partial) substitutes?
In any case, the closest measure of global crude oil production that we have is the EIA data base that tracts global Crude + Condensate (C+C). In regard to this data base, a key question is the ratio of global condensate to C+C production. Unfortunately, we don’t appear to have any global data on the Condensate/(C+C) Ratio. Note that when the EIA discusses “crude oil” they are talking about C+C.
Insofar as I know, the only complete Condensate/(C+C) data base, from one agency, is the Texas RRC data base for Texas, which showed that the Texas Condensate/(C+C) ratio increased from 11.1% in 2005 to 15.4% in 2012. The 2013 ratio (more subject to revision than the 2012 data) shows that the 2013 ratio fell slightly, down to 14.7%, which probably reflects more focus on the crude oil prone areas in the Eagle Ford. The EIA shows that Texas marketed gas production increased at 5%/year from 2005 to 2012, versus a 13%/year rate of increase in Condensate production. So, Texas condensate production increased 2.6 times faster than Texas marketed gas production increased, from 2005 to 2012.
The EIA shows that global dry gas production increased at 2.8%/year from 2005 to 2012, a 22% increase in seven years. If the increase in global condensate production only matched the increase in global gas production, global condensate production would be up by 22% in seven years. If global condensate production matched the 2005 to 2012 Texas rates of change (relative to the global increase in gas production), global condensate production would be up by about 67% in seven years.
In any case, we don’t know by what percentage that global condensate production increased from 2005 to 2012. What we do know is that global C+C production increased at only 0.4%/year from 2005 to 2012. In my opinion, the only reasonable conclusion is that rising condensate production–a byproduct of natural gas production–accounted for virtually all of the increase in global C+C production from 2005 to 2012, which implies that actual global crude oil production –from crude oil reservoirs–was flat to down from 2005 to 2012, as annual Brent crude oil prices doubled from $55 in 2005 to $112 in 2012.
The following chart shows normalized global gas, NGL and C+C production from 2002 to 2012 (2005 values = 100%).
http://i1095.photobucket.com/albums/i475/westexas/Slide1_zps45f11d98.jpg
The following chart shows estimated normalized global condensate and crude oil production from 2002 to 2012 (2005 values = 100%). I’m assuming that the global Condensate/(C+C) Ratio was about 10% for 2002 to 2005 (versus 11% for Texas in 2005), and then I (conservatively) assume that condensate increased at the same rate as global gas production from 2005 to 2012, which is a much lower rate of increase in condensate (relative to the increase in gas production) than what we saw in Texas from 2005 to 2012.
http://i1095.photobucket.com/albums/i475/westexas/Slide2_zpse294f080.jpg
Based on foregoing assumptions, I estimate that actual annual global crude oil production (45 or lower API gravity crude oil) increased
from about 60 mbpd (million barrels per day) in 2002 to about 67 mbpd in 2005, as annual Brent crude oil prices doubled from $25 in
2002 to $55 in 2005.
At the (estimated) 2002 to 2005 rate of increase in global crude oil production, global crude oil production would have been up to
about 90 mbpd in 2013.
As annual Brent crude oil prices doubled again, from $55 in 2005 to an average of about $110 for 2011 to 2013 inclusive, I estimate
that annual global crude oil production did not materially exceed about 67 mbpd, and probably averaged about 66 mbpd for 2006 to
2013 inclusive.