State level employment data will be released by the BLS on Friday, but state agencies have already released data (h/t J. Miller) confirming that Wisconsin private employment performance deteriorates, while Kansas continues to trend sideways. So much for the benefits of a high ALEC-Laffer ranking.
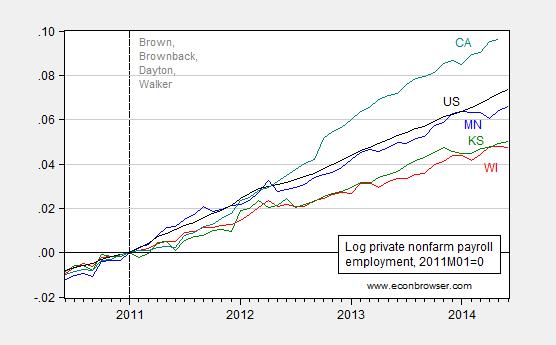
Figure 1: Log private nonfarm payroll employment for Wisconsin (red), Minnesota (blue), California (teal), Kansas (green) and the US (black), all seasonally adjusted, 2011M01=0. Vertical dashed line at beginning of terms for indicated governors. California data from May release. Source: BLS, WI DWD, MN DEED, KS DoL, and author’s calculations.
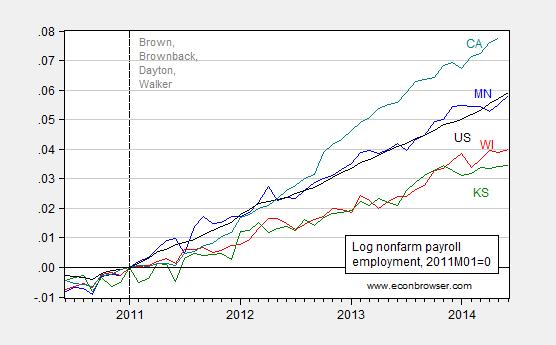
Figure 2: Log nonfarm payroll employment for Wisconsin (red), Minnesota (blue), California (teal), Kansas (green) and the US (black), all seasonally adjusted, 2011M01=0. Vertical dashed line at beginning of terms for indicated governors. California data from May release. Source: BLS, WI DWD, MN DEED, KS DoL, and author’s calculations.
Given Kansas economic performance, it is unsurprising that there is some angst within the governing party regarding the conduct of policy [1]. As for Wisconsin, total nonfarm employment rose 2400, and private nonfarm employment fell 1200. Both series May entries were revised downward, 400 and 500, respectively.
As noted in this post, based on the Quarterly Census of Employment and Wages (QCEW) which Governor Walker was in favor of citing before he was against citing it (see a chronology here), there is likely to eventually be a substantial downward revision of even these lackluster numbers.
More on the reports, from WTAQ, Milwaukee Journal Sentinel, and J. Miller. The WI DWD release is here.
Update, 7/18, 11:40AM Pacific: BLS data are now out; updated versions of Figures 1 and 2 are below.

Figure 1a: Log private nonfarm payroll employment for Wisconsin (red), Minnesota (blue), California (teal), Kansas (green) and the US (black), all seasonally adjusted, 2011M01=0. Vertical dashed line at beginning of terms for indicated governors. Source: BLS, and author’s calculations.
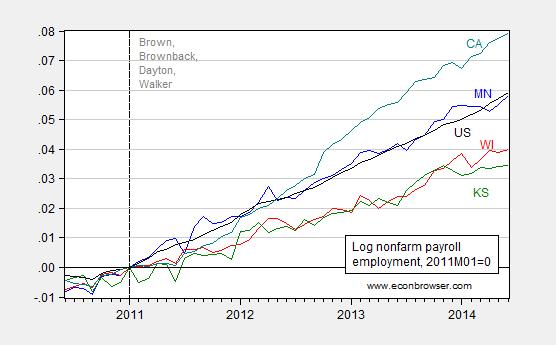
Figure 2a: Log nonfarm payroll employment for Wisconsin (red), Minnesota (blue), California (teal), Kansas (green) and the US (black), all seasonally adjusted, 2011M01=0. Vertical dashed line at beginning of terms for indicated governors. Source: BLS, and author’s calculations.
Further note that the deceleration in growth for Wisconsin and Kansas is statistically significant, as judged using a panel regression of first differences, and a dummy taking on a value of unity from 2011M01 onward. The coefficient estimates on the dummy (with growth relative to the Nation annualized) plus/minus 90% confidence bounds are shown in Figure 3.
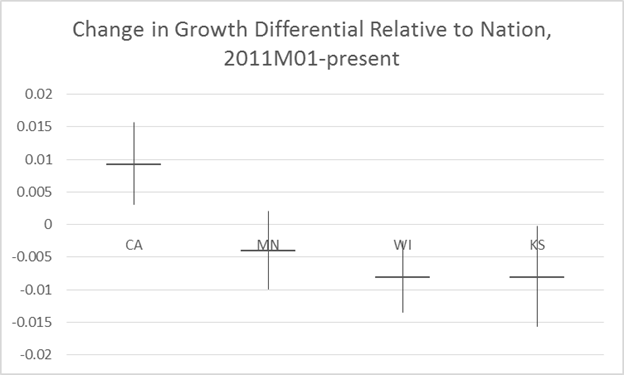
Figure 3: Change in annualized m/m growth rates in private employment growth relative to Nation’s, 2011M01-present vs 1990M01-2010M12. Point estimate at bar, line spans 90% confidence interval. Obtained from fixed effects panel regression on four state series. Robust standard errors allowing for panel serial correlation (PCSE). Source: BLS and author’s calculations.
It is useful to recall that Wisconsin and Kansas were 17th and 16th respectively in the 2014 ALEC-Laffer rankings. Minnesota was 46th, and California 47th.
And so the experiment continues.
Oh, and by the way, in order to hit the 250,000 new jobs target that Governor Walker reiterated nearly a year ago, the Wisconsin economy would need to generate about 20 thousand new jobs for each of the next seven months after June. The mean rate of job creation during the first three and a half years of Governor Walker’s term is about 2800 (standard deviation of 4000). Slightly over two years ago, I had an email exchange with a DoR official, who indicated the Walker Administration believed the job gains were “backloaded”, i.e., to appear close to the end of the Governor’s term. I believe I am on safe ground when I conclude that achievement of this promise is unlikely.
Update, 7/19, 10AM Pacific: Reader Bruce Hall, apparently without consulting actual data, writes:
Rates of change are a good comparison… when the starting points are the same. By that I mean the starting point for which the rate is based, not the temporal point.
I’ve made the point before that an F student improving to a C is great news, but doesn’t mean that is a better achievement than another student going from a C to a B or simply maintaining an A. The same thing applies to states that wallowed in unemployment and have improved to less than average.
Bruce Hall has made this statement twice, so I think it useful to show exactly how these states rate in terms of per capita real gross state product. The shaded area pertains to the period in which Governors Brown, Brownback, Dayton, and Walker were in power.
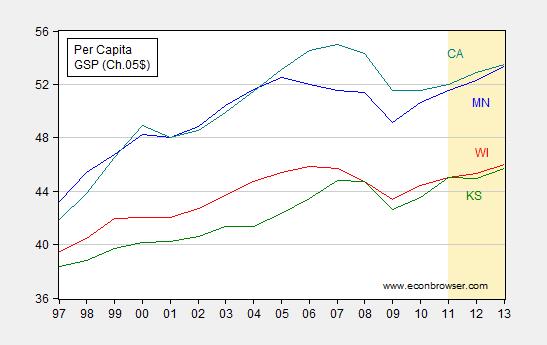
Figure 4: Per capita Gross State Product in Ch.2005$, for Minnesota (blue), Wisconsin (red), Kansas (green) and California (teal). Shaded area pertains to 2011-13. Source: BEA, FRED, author’s calculations.
Note that the recent accelerated downturn in Kansas as measured by the Philadelphia Fed’s coincident indices do not show up in this graph, as these occur primarily in 2014. See this post for a depiction.
In other words, even taking into account starting points, and levels, California and Minnesota appear to be outpacing Wisconsin and Kansas.
The argument that low tax/low regulation policies are the way to growth is, as I think about it, contradicted by the history of development within the US. The state’s with the highest income have been more unionized – with the exception of poor coal states like WVa, where unions seem to have done very little to improve earnings (or safety, given that safety regulations were often fought by unions). I could go on with more examples but if the policies for growth are low tax/low regulation then Mississippi should be #1, not #50. It’s amazing that even today, if you take out oil & gas, the only areas that do better in these supposed “growth” states are places like the Research Triangle in NC where there’s been massive public investment in infrastructure and of course schools.
Yes that is true, but Menzie’s approach here is even more persuasive because it looks at states before and after they adopted different polices. The Ayn Rand cultists will argue endlessly about comparing apples and oranges by comparing Kansas and California. But, this cross-sectional time series design gets around those issues by looking at the change after the adoption of differing policies and comparing that to performance from the BEFORE the policy change. Thus the change is only plausibly due to austerity in KA and WI. What else could it be? If you are fair and data-analytic, this should settle the question over the impact of austerity in a recession.
What Ayn Rand cultists need to do instead is admit they are making a moral argument over theories of fairness, and not an economic argument. They do not like re-distribution because A is A and all that. So say it is unfair, without coming up with endless theories about why up is down, sunshine is rain and the multiplier effect is less than 1.5 in a recession.
It would be much more interesting to see these type of graphs go back to, say, 2008. I think what one would see is that unemployment was much higher in California during the recession than it was in Wisconsin and Kansas and that the latter two states recovered earlier than California did. Showing a cut off date of mid-2010 doesn’t give us a very complete or accurate view. Given the dates selected here, I’m not surprised that California appears to outpace since it is recovering from a deeper recession and the employment recovery only started in California in October 2010. Ceteris paribus, deeper recessions should result in steeper recoveries.
California’s peak unemployment rate was 12.4 percent in October 2010. Wisconsin’s peak rate was 9.2 percent in Jan 2010. Kansas peaked at 7.5 percent in August 2009. Today, they are at 7.6 percent, 5.7 percent and 4.8 percent, respectively.
Check back with claims of superior high-tax California performance when its unemployment rate drops below the other two states.
Isn’t the point of the post to compare states after a change implemented to increase employment? Did it work?
Ok Vivian- We can break that down for you. Let’s start with each state’s employment level at the start of the Recession in December 2007, and take it to January 2010, when private sector job growth reappeared nationwide. As you’ll see California had the largest drop, which is some of Vivian’s hypothesis.
Dec 2007- January 2010
Cal. -8.38%
Wis. -5.79%
Minn -5.21%
Kan. -4.54%
Now, let’s see what happened in the year before these governors took over
Jan 2010- Jan 2011
Cal. +1.17%
Kan. +1.13%
Minn +1.36%
Wis. +1.21%
All around the same, but let’s put the 2 years together.
Dec 2007- Jan 2011
Cal. -7.30%
Wis. -4.65%
Minn -3.92%
Kan. -3.46%
So California is still much lower than the rest, Wisconsin is next worst (about in line with the national figures, IIRC), and Minnesota and Kansas fell less than 4.0%. Now let’s see what’s happened since then.
Jan 2011- June 2014
Cal. +8.22%
Minn +6.00%
Wis. +3.92%
Kan. +3.50%
And the kicker- let’s put all the jobs number together over these 6 1/2 years.
Dec 2007- June 2014
Minn +1.84%
Cal. +0.32%
Kan. -0.01%
Wis. -0.92%
So California and Minnesota are at all-time highs for total jobs, while Wisconsin and Kansas are not. I understand you Randian types think math is a liberal plot, but for those of us in the reality-based community, it’s pretty obvious- the ALEC states are losing, and the progressive, Dem-run states are winning. And the Dem states are in better budget shape for 2014, 2015 and beyond (yes, really).
The jury’s back on this one.
Jake,
You are actually helping prove the point. Your numbers reveal exactly what I was stating: The CA recession was deeper than in the other states mentioned and the recovery was later. Shouldn’t CA have experienced a steeper recovery coming out of a steeper recession? There is a lot more going on here than the date someone took office.
Why is it that you and Menzie think that we should select only one variable (the date a governor takes office), exclude all others relevant variables, and claim the one variable you want to make a point out of is the differentiating factor? I understand that this is a difficulty of economic analysis, but when one doesn’t even try to account for other factors, do you really think that is scientific? This blog post was not about science, or showing the effect of differing policies; it was about partisan polemics (to address the question raised by Robert Hurley).
Vivian Darkbloom
You may have missed it, but a few weeks ago Menzie did a quick analysis that regressed Wisconsin’s log coincident index against California’s with a dummy variable for Walker’s time in office and a trend factor to account for any supposed mismanagement by California relative to Wisconsin and as a check against omitted variable bias. Wisconsin did not fair particularly well. So basically Menzie did pretty much what you asked for and he still got the same result. No doubt some ambitious grad student could test and torture the data in such a way that there would be no statistically significant difference between Wisconsin and California, but in many ways the more complicated the model the less convincing it tends to be. You also need to look at out-of-sample performance, and here Menzie is on pretty firm ground. This is hardly the first of these posts comparing Wisconsin and Kansas to the US and other states. If you believed the differences were just due to a streak of bad random luck, then you would have to explain why that streak of bad luck persists and the gap between Wisconsin & Kansas and the rest of the US keeps getting wider.
As to comparing the absolute values of each state’s unemployment rate, the right way to do things is to account for fixed effects. In other words, each state starts out with its own normal level of unemployment. That level might be due to state specific laws (e.g., unemployment insurance, minimum wage, etc.), overall education levels, job quit rates because of people literally “in-between jobs” as they advance to higher paying jobs, macroeconomic demand, etc. You would then want to look at the normal volatility of state specific unemployment rates.
Finally, when you see the same ALEC sponsored policies resulting in the same underperformance, sooner or later it’s time to rethink the economic theory behind those policies. When the overarching problem is weak macroeconomic aggregate demand, cutting services, cutting state worker employment, cutting tax rates for the top 1% and cutting business tax rates simply make the problem worse. There is a time and a place for belt tightening; that time and place is not when the macro economy is at the ZLB and there is a large output gap. The kinds of policies advocated by the likes of Walker and Brownback are best characterized by what Daron Acemoglu and James Robinson (“Why Nations Fail”) call “extractive” economic and political policies. There is a reason why Gov. Walker dropped what he was doing to take that call from someone he thought was one of the Koch brothers.
‘The kinds of policies advocated by the likes of Walker and Brownback are best characterized by what Daron Acemoglu and James Robinson (“Why Nations Fail”) call “extractive” economic and political policies. ‘
Is that supposed to be a joke?
I showed you the full picture- California is better on the job front than Wisconsin when you look at the entire 6 1/2 year period, with more jobs now than they had at the start of the Recession. Minnesota has gone from slightly being ahead of Wisconsin to leaving their eastern neighbor in the dust, with 50% more jobs over the last 3 1/2 years. I understand you’ll bitterly cling to your failed ideology, but your hypothesis of “steep loss, steep recovery” as a reason to dismiss these facts is very weak.
After a while, correlation can go a long way towards being causation, and the ALEC states are losing this fight. Period.
‘Minnesota has gone from slightly being ahead of Wisconsin to leaving their eastern neighbor in the dust, with 50% more jobs over the last 3 1/2 years.’
Oh, really? According to the BLS, in June (http://www.bls.gov/eag/eag.wi.htm):
Civilian Labor Force in Wisconsin;… 3,075,000
Employment;… 2,900,200
Unemployment ;…174,900
While in Minnesota the numbers are;
Civilian Labor Force; …2,995,200
Employment; …2,859,600
Unemployment; …135,500
Hard to see how that qualifies as leaving Wisconsin in the dust.
Wisconsin has seen its unemployment rate drop from 6.2% in January down to 5.7% (over a 9% drop) today.
While Minnesota’s has hardly moved during the same period; 4.7% to 4.5% (probably not outside the margin of error)
Patrick R. Sullivan: Unemployment rate is the ratio of unemployed to (statistically defined) labor force; it can move for a number of reasons, affecting either numerator or denominator.
You cited figures the civilian employment series which exhibits more volatility than the nonfarm series based on the establishment survey; I’ll take them anyway. If you had gone through the trouble, you would find Wisconsin employment as of June is 2.5% higher than it was in 2011M01. Minnesota’s was 3.5%. That is a 40% difference.
The gap is even more pronounced using the more precisely measured establishment series. Then the Wisconsin figure is 4.0% versus the Minnesota 5.7% — a 43% difference. I’d say those are economically significant differences.
patrick,
“While Minnesota’s has hardly moved during the same period; 4.7% to 4.5% (probably not outside the margin of error)”
are you seriously arguing that minnesota’s policy must be lacking because it could not push unemployment below 4.5%? seriously? how low do you realistically expect unemployment can drop to? baffling!
And PS- Why are we using the variable of when a Governor takes office? BECAUSE THAT’S WHEN THESE POLICY CHANGES BEGAN. It’s the independent variable that takes effect, and should especially be examined when guvs like Walker and Brownback promised their ALEC, trickle-down policies would lead to extra job growth. This tests that theory, and not only proves it not to be true, but seems to prove the converse (that they do worse than states who put in more progressive policies).
It’s HS-level statistics analysis. Stop making excuses and learn from it. I understand I can’t fix stupid and won’t belabor the point, but if we don’t measure with apples-to-apples numbers, what do you suggest we do when we try to figure out what works best for creating jobs in states? Outside of your little bubble-world, you need to understand that proof > theory.
‘I understand you Randian types think math is a liberal plot….’
The way you do it, that seems to be the case.
Jake, do have a linky for your numbers? Thank you.
California is atypical…and is STILL one of the largest economies in the world. You have to treat it as a country with poor agricultural provinces, rish techy counties, Defense pork San Diego and Whatever Los Angeles county is. Using California in the same breath as Kansas is like comparing New York to Lawrence. Scale, educations and diversity of cultures and economics matter. Low tax/ high-tax arguments are largely ideological and not based on localized realities.
States with more progressive economic policies that reach everyone, not just tax breaks for a few rich people have better growth. Seems simple, but some would like to obscure the facts. Thanks Dr. Chinn.
Samuel, so I have been wong all these years!
Socialism, does work after all!
hans, your first honest statement in years!
“Samuel, so I have been wong all these years!”
Which ones, Hans? If you mean the state jobs numbers, they’re available at the BLS.gov site. Just search under “Wisconsin economy at a glance”, for Wisconsin, as an example
Meanwhile, here in MN, our firm is increasing the market reference ranges for some classes of employees for the first time (mid year) since, oh, the late 1990s. That means many employees will be getting mid-year pay increases. That’s a huge change from the 2001-2013 period where we had 4 years with no increases at all, and less-than-inflation increases in the MRRs for most positions for the rest of the years during that period. Things are looking up! Many people in MN will have more money to spend.
Have a good weekend!
randomworker
Jake,
Is employment growth the only metric we should examine?
Personal Income CAGR Q4’2007-Q1’2014 (Closest I could get to your overall time period from BEA):
CA 2.53%
KS 2.77%
MN 2.75%
WI 2.67 %
Per Capita Debt:
CA $20,449
KS $13,523
MN $15,965
WI $7,863
2013 S&P Rating
CA – A (only Illinois is lower)
KS – AA+
MN- AA+
WI- AA
2010 Tax Burden Avg all State and Local
CA 11.2%
KS 9.7%
MN 10.8%
WI: 11.1% (Look, you should be happy, WI was almost as high as CA!)
LA Times
Over the past year, the biggest drivers in California’s job growth have been the education and health services and professional and business services sectors.
California is still tied for the fifth-highest unemployment rate in the nation, coming in lower than only Rhode Island, Mississippi, Nevada and Michigan.
I guess we can thank California’s increase in employment on the Obamacare subsidies.
Rates of change are a good comparison… when the starting points are the same. By that I mean the starting point for which the rate is based, not the temporal point.
I’ve made the point before that an F student improving to a C is great news, but doesn’t mean that is a better achievement than another student going from a C to a B or simply maintaining an A. The same thing applies to states that wallowed in unemployment and have improved to less than average.
Bruce Hall: See Figure 4, added for your benefit.
Good information. California certainly has significant advantages in terms of climate, agriculture, and highly educated employees in high-tech industries. My son and daughter-in-law live in San Francisco and have pretty damn-well paying jobs. They also pay $6,500 monthly rent for a 3-bedroom, 1800 sf townhouse in the Mission District, have food costs that are at least 25% higher than here in Michigan, transportation costs that are likewise significantly higher, and can’t find reasonably price day care for the young kids. A lot of the GDP difference is, I suspect, based on the completely different cost structure between California, Kansas, and Wisconsin. Now, one could argue that it is California’s big-spending government that has been the attraction, but I suspect that California was an attractive place to live that attracted a lot of smart people and leading-edge companies… and then the temptation was just too great for the taxers and spenders and free-loaders which has lead to so many of California’s recent problems.
bruce,
the smart people and leading edge companies are in california because of the education system which exists in the state-not the palm trees. otherwise you would see miami leading the way in high tech ventures-and boston would be a backwoods town.
Bruce Hall: Well, ok, not that I’m convinced. Seems that argues for analysis of rates of change, which you just decried.
But in any case, what about Minnesota?
I’m suggesting that data analysis may lead to correlation, but not necessarily causation. Previously, I wrote of Minnesota’s more homogeneous and educated population as potentially causal factors for somewhat higher economic performance than Wisconsin and Kansas. California’s performance should be much better than it has been, but it has experienced significant social changes and education attainment degradation [with the exception of retaining a high level of post graduate degrees related to the high-tech industries].
Rates of change are important, but so are absolute levels. I’ll just chalk this up to a difference in perspective. http://www.bls.gov/lau/ also http://www.bls.gov/lau/stalt.htm
Why did people wait so long, until the early 1990s, to escape the high cost of living, high tax rates, fees, fines, fares, tolls, etc., excessive regulations, and poor government services in California before moving to Colorado, where in the early 1990s, near Denver, a new four-bedroom and three bath house, on a big lot, in a new neighborhood, cost less than $100,000, renting a nice large one-bedroom apartment, in a nice neighborhood, was less than $300 a month, and everything else was either cheaper or much cheaper?
Because as more people bailed-out of California and moved to Colorado, that caused more people in California to move to Colorado.
A “snowball effect” never got rolling in Kansas, like in the “Sunbelt,” Colorado, and Washington state.
You’ve gotta have a reason to move to those places, and sorry righties, but most people don’t move somewhere just because of lower taxes. And when you try to create an “Idiocracy” like Kansas, which tried to outlaw the teaching of evolution- surprise! People with talent choose not to live there as opposed to scenic, progressive places like Colorado.
Quality of life matters, even in low-tax places like Tex-ass, where the rural counties are losing population all over the place in favor of the metro hubs of Dallas, Houston, Austin and San Antonio. It’s a lesson the AKEC folks still don’t get.
There may be a “brain drain” in places like Kansas and rural areas.
If you’re a good student, you may want to attend a better university, and may end up working in another state, or a larger metro area, that’s more diversified.
So, Kansas may not retain or attract much talent from the rest of the country.
Of course, wealthy and high-income people in California may not be struggling too much, along with people who bought a house long ago that’s now paid-off, or has lots of equity.
I waited to make this comment until the usual run of stuff had passed. I’ve made it before: think about the actual differences being argued about. The claim is that WI’s and other states have “growth” policies. This doesn’t show up in the numbers so the argument is being made that, in essence, is: the numbers aren’t as bad as they look or that the numbers can somehow be excused. This doesn’t address the actual criticism of the policies, which can be put bluntly: where is the evidence they work? Not that the numbers maybe don’t look that bad or maybe that the numbers, in some cases, show a slight difference to the good (if held at the right angle to the eye), but a meaningful, material difference. That simply doesn’t exist.
Now couple that with my first comment – which is first above – that successful states demonstrate higher tax rates, higher levels of public investment, etc. so there is no historical reason to believe these “growth” policies generate materially better results. And I could go further, as I’ve noted in past comments, since the Civil Rights Era entire nations have risen from poverty and created hundreds of millions of middle class and better lives … but the same states as before are still at the bottom of the US table by almost every measure despite decades of these policies. And as I note above, the success stories in these states are where there has been large-scale public investment and that applies not only to the Research Triangle but to the UofT at Austin (and its oil & gas endowment) and of course the public investment and subsidy for the semiconductor industry in Austin.
I expect endless rounds of nitpicking to find small differences in favor of these “growth” policies because people are unable to question their own beliefs. Consider Reagan’s tax record: endlessly miscited – taxes went up literally every year starting in 1982, including the largest tax increase in US history (because tax receipts dropped so much) while the US debt doubled. And of course the US debt went down under Clinton and then more than doubled under GWBush. But … blah, blah, blah.
To use a Bush 43 term, some people “misunderestimate:”
“In The End of Prosperity, supply side guru Art Laffer and Wall Street Journal chief financial writer Steve Moore point out that the Reagan recovery grew into a 25-year boom, with just slight interruptions by shallow, short recessions in 1990 and 2001. They wrote:
“We call this period, 1982-2007, the twenty-five year boom–the greatest period of wealth creation in the history of the planet. In 1980, the net worth–assets minus liabilities–of all U.S. households and business was $25 trillion in today’s dollars. By 2007, net worth was just shy of $57 trillion. Adjusting for inflation, more wealth was created in America in the twenty-five year boom than in the previous two hundred years.””
Arthur Laffer:
“B.A. in Economics from Yale University (1962) and an M.B.A. (1965) and a Ph.D. in Economics (1971) from Stanford University…member of Reagan’s Economic Policy Advisory Board (1981–89)…best known for the Laffer curve…played a key role in writing California Proposition 13, the property-tax-cap initiative that inspired a tax revolt across the nation…a staunch fiscal conservative and libertarian…stated publicly that he voted for President Bill Clinton in 1992 and 1996…references President Clinton’s conservative fiscal policies as cornerstones of his support.”
Peak Trader: Re: Arthur Laffer, see also this post, and for the ALEC-Laffer index, this post.
Menzie Chinn, I agree, expansionary fiscal policy is needed in a recession.
However, politicians/lawyers spend too much when the economy isn’t in recession.
From Commanding Heights:
“Keynes intended government to play a much larger role in the economy. His vision was one of reformed capitalism, managed capitalism — capitalism saved both from socialism and from itself.
Fiscal policy would enable wise managers to stabilize the economy without resorting to actual controls. The bulk of decision making would remain with the decentralized market rather than with the central planner.
…fiscal policy — spending, deficits, and tax. These tools could be used to manage aggregate demand and thus ensure full employment.
As a corollary, the government would cut back its spending during times of recovery and expansion. This last precept, however, was all too often forgotten or overlooked.”
Wisconsin’s economy is more intertwined with the economy of Illinois. Over the past five years, employment has grown faster in Wisconsin than it has in Illinois. Wisconsin has a republican governor, Illinois has a democrat. Illinois has raised income taxes.
DJ, sorry but Madison does not recognized the nexus.
1. During the “Reagan Recovery”, Bill Clinton was in office for 8 years. Taxes were raised by Reagan and GHWBush for I believe 7 straight years. While the number of tax brackets along with top marginal rates, the AMT was turned from a nothing into a real tax and, as I’ve noted before, the government inserted itself into private transactions in a way never, ever before done by requiring that all family and intra-corporate loans and similar transfers bear “imputed interest” at rates specified by the IRS. And as I noted, the national debt doubled and the annual federal deficit tripled by the end of GHWBush’s tenure … and then under Clinton went to a budget surplus (and there was talk of retiring the national debt). For the record, I voted for Reagan, met him, liked him, etc. and I respect GHWBush but their fiscal stewardship was terrible.
2. Note that CA raised both its tax rate on high earners and its sales tax and its job growth percentage exceeds almost every other state – I think N. Dakota is higher but the total population of ND is 700k while CA has 38M people. And CA just raised its minimum wage. Too early to see the effects? Not if you believe in business confidence because there has been no sign of reduced investment, reduced hiring plans, etc. And the 13 states where the minimum wage has gone up are doing better than the rest. Too early? Again, if business anticipates higher costs, shouldn’t they be reducing spending and reducing hiring? People cite business confidence only when it suits them.
3. I believe that when polled economists generally estimated the tipping point tax rate as somewhere around 60%. (I’d have to check the old idiotic arguments about the 3% increase Obama enacted.) That would be the point where marginal revenue raised would be reduced by the tax burden. In other words, no one believes costs can rise forever but these increases are a long way from forever.
4. Why would reducing burdens (and wage rates, etc.) and reducing taxes be a negative? It says investment by the government will be decreasing and it’s a weird myth that business doesn’t need or want government investment. That investment can be in infrastructure but also in schools and social services and other “soft” infrastructure. Companies that pay well want that soft infrastructure if only because it makes the lives of their employees better and so on. We see this in a number of internal immigration studies. These show, for example, that low cost jobs move to TX from CA (and from IL to IN) but high cost jobs move the other way. (Note I didn’t say “wages” because wages are a cost.)
5. I can’t find any examples where lack of public investment has generated a substantial economy. The bottom end is a place like Somalia: no government, free-for-all economics, no investment worth mentioning. There are places like S. Italy where lack of government means organized crime – a less chaotic version of Somali militias? – runs things for its limited benefit, keeping people relatively poor because the poor can be controlled. I’d be interested if anyone has a counter-example. I’m familiar with S. American countries and there is a substantial literature about the necessity of an underground economy because government is incapable of setting up rational rules (and wavers between doing nothing and what might better be called extortion).
http://www.campusreform.org/?ID=5781&app=cro
U of Wisconsin sets the pace.
Ricardo: You really should stop taking talking points from National Review (the original source of that article). Maybe you should read the actual document, here. Maybe you could do a word search for “grade” or “grading”, if your technical capabilities extend to searching a PDF (by the way, the document has a title including the word “recommendations”). There is no command-and-control order to assign grades by racial quote. It might also be useful for you to read this document, as opposed to parroting the National Review line.
Go back to asserting there were Al Qaeda was training in Saddam Hussein’s Iraq as a basis for our invasion in 2003 (in your DickF incarnation). I think that was much more entertaining reading. You might as well put back on your tinfoil cap, too.
A most Progressive state Illinois.
You should start nourishing your mind with better sources of information. This website is terrible. There’s a clue to that in the background of the author of this piece, who has a bachelor’s in theology