Here are some economic indicators for Kansas; they indicate rising GDP but stalling real personal income (through 2014Q1), stagnant employment growth, with manufacturing employment deviating from national trends.
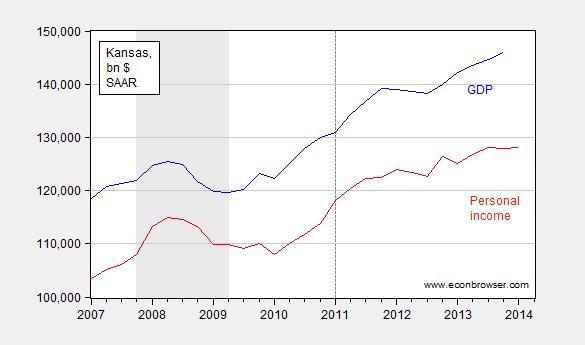
Figure 1: Nominal Gross State Product (blue) and personal income (red). NBER recession dates shaded gray; dashed lines at Brownback administration and beginning of tax cuts. Source: BEA, and BEA via FRED.
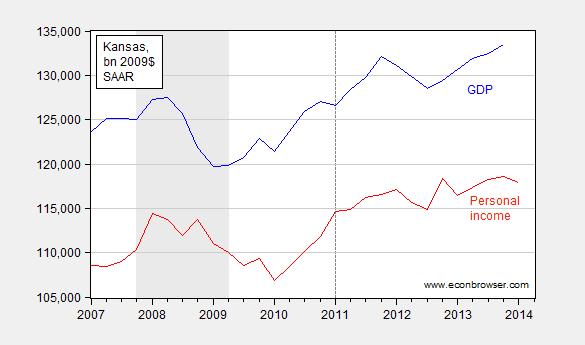
Figure 2: Real Gross State Product (blue) and real personal income (red). Real personal income deflated using Chained CPI. NBER recession dates shaded gray; dashed lines at Brownback administration and beginning of tax cuts. Source: BEA, and BEA and BLS via FRED.
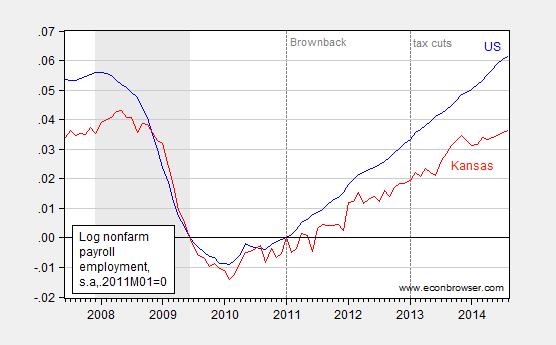
Figure 3: Log nonfarm payroll employment in United States (blue) and in Kansas (red), both seasonally adjusted, normalized to 2011M01=0. NBER recession dates shaded gray; dashed lines at Brownback administration and beginning of tax cuts. Source: BLS and author’s calculations.
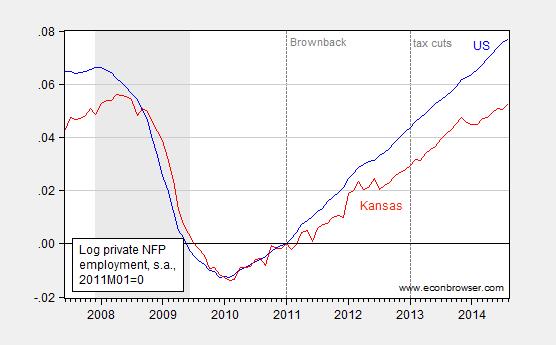
Figure 4: Log private nonfarm payroll employment in United States (blue) and in Kansas (red), both seasonally adjusted, normalized to 2011M01=0. NBER recession dates shaded gray; dashed lines at Brownback administration and beginning of tax cuts. Source: BLS and author’s calculations.
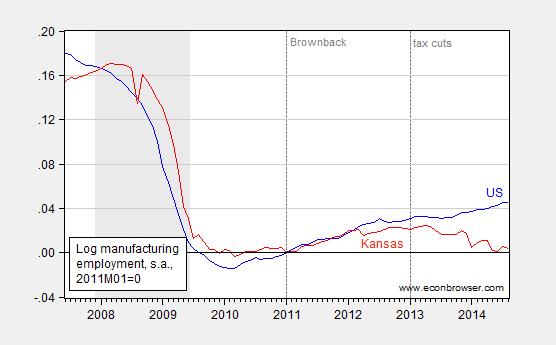
Figure 5: Log manufacturing payroll employment in United States (blue) and in Kansas (red), both seasonally adjusted, normalized to 2011M01=0. NBER recession dates shaded gray; dashed lines at Brownback administration and beginning of tax cuts. Source: BLS and author’s calculations.
Note that the cumulative growth gaps in NFP, private NFP and manufacturing employment since 2011M01 are respectively 2.5%, 2.4% and 4.2% (in log terms). Of the 4.2 percentage point manufacturing employment growth gap between the United States and Kansas, 3.1 percentage points are accounted for by the growth trends since 2013M01, when new tax and spending cuts went into effect.
Note that inspection of civilian employment does not provide a “nicer” picture. The cumulative growth gap since 2011M01 is 5.5%. To place this in perspective, the cumulative growth of US civilian employment relative to Kansas since the last cyclical peak (2007M12) is –1.2%.
One excuse sometimes offered for the state’s poor economic performance is the decline in exports. However, July 2014 year-to-date exports are 1.1% higher than the corresponding period in 2013, according to the Census Bureau. This suggests that much of the deterioration in 2014 economic activity is home grown in source.
For a New Classical interpretation of these trends (along with a critique), see this post.
Update, 9/23 8:50AM Pacific: Reader XO wonders about government employment. Figure 6 presents government employment nationwide (blue) against Kansas (red), both normalized to 2011M01.
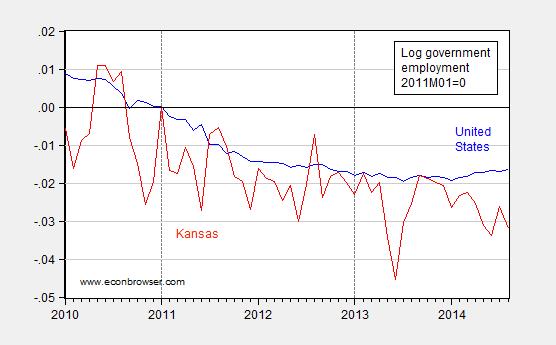
Figure 6: Log US government employment – all levels (blue), and Kansas government employment – all levels (red), both s.a., normalized 2011M01=0. Source: BLS and author’s calculations.
Recall that the nationwide statistics include the government cutbacks in Kansas as well as other states embarking upon the expansionary fiscal contraction experiment, so the Kansas government employment reductions are all the more remarkable.
Brutal graphs, Menzie! Hard to deny Figure 3 and 4. Lock-step with the USA before Brownback, separation thereafter. Can we get a state governmental employees graph? That is where a lot of the impact may have come from, I guess, and directly related to Brownback’s ideology and control.
When Gov. Brownback proposed his tax cuts to the Kansas congress it contained both the tax cuts and spending cuts. The Republican Kansas legislature allowed the tax cuts but because of politics rejected the spending cuts. The result is that tax revenues are declining while spending is increasing or remaining the same. Kansas is a great example of what happens when Republicans think they know supply side economics but actually are Keynesians who want to spend they way to prosperity.
The Progressives love Kansas because they do not understand that the legislature is actually operating on a Keynesian understanding of economics with a “supply side” facade.
Kansas is a good example of where Progressive Republicanism proves it is a failure. Kansas may be the state that bucks the trend of our country turning back to liberty and freedom, not because the people do not want liberty and freedom but because they essentially have no choice.
why would further spending cuts improve the economic performance we see here? you aren’t seriously claiming that the kansas government is crowding out private economic activity, are you?
so if you aren’t, please explain for us the economic dynamic why less spending by the state of kansas improves any of the numbers we see here.
Howard, some tax cuts do work, despite Professor’s Chinn regionalism…We all know the complexity of the marketplace,
whereas somethings work and others do not.
If I reduce your compensation will you produce more or less?
http://www.forbes.com/sites/rexsinquefield/2014/09/19/oklahomas-small-business-tax-collection-hits-all-time-high/
Hans: The textbook answer (if you should ever decide to consult one): It depends on the magnitudes of the (offsetting) income and substitution effects.
Ricardo: There you go again. As I noted in this post:
Since you did not disagree with this point — even though you commented on the post that contained this quote — I assume you are now conveniently forgetting the fact that in fact spending was reduced.
Again Ricardo?
Look, your misinformation campaign has to stop and stop now. The readers of this blog are tired of your apparent compulsion to make unsubstantiated claims that are refuted by even the briefest research. If I ran this blog, you’d be blocked.
Here is just a small part of the spending cuts —
Public Schools. In Kansas, the funding cuts were particularly deep to public education: 14 percent per student. Even prior to the recession, Kansas ranked slightly below the national average for school spending.[ National Education Association, “Rankings and Estimates: Rankings of the States 2009 and Estimates of School Statistics 2010,” December 2009, Table H9, p. 54, http://www.nea.org/assets/docs/010rankings.pdf%5D Impacts of the cuts on Kansas were significant, including school closings and larger class sizes.[For example, the state’s third largest school district ? Shawnee Mission School District ? closed three schools, expanded class sizes, cut music programs, and eliminated hundreds of staff positions. (For citations, see http://www.offthechartsblog.org/the-price-of-kansas-costly-tax-cuts/). The state’s largest district ? Wichita School District ? similarly closed schools, cut jobs, and eliminated high-school librarian positions (see Brent D. Wistrom and Suzanne Perez Tobias, “Court: Kansas Funding for Schools Unconstitutionally Low”, The Wichita Eagle. January 11, 2013. http://www.kansas.com/2013/01/12/2632578/court-kansas-funding-for-schools.html), the Baxter Springs School District cut non-teaching jobs and spending on school supplies (see Katie Lamb, “Kansas Educators, Legislators Await Court’s School Funding Ruling”, The Joplin Globe. February 2, 2014. http://www.joplinglobe.com/topstories/x748030440/Kansas-educators-legislators-await-court-s-school-funding-ruling), the Galena School District shrunk its teaching force from 70 to 58 (see previous article), and the Newton Public School District lost 30 positions, including teachers, instructional coaches, janitors, and counselors (see Chad Frey, “Disappearing Staff”, The Newton Kansan, February 21, 2014. http://www.thekansan.com/article/20140221/NEWS/140229955/1001/NEWS).]
Higher education. Kansas has cut funding per student for higher education by another three percent since fiscal year 2012, after adjusting for inflation, leaving funding 23 percent below pre-recession levels. Tuition at Kansas public colleges and universities has increased by 8 percent since 2012 and is 20 percent higher than tuition in 2008. [data from Illinois State University’s Grapevine report and the Kansas Board of Regents ]
Local libraries. Governor Brownback’s budget for next year would leave state funding for local libraries 35 percent below the 2012 level and 65 percent below the 2008 level, after adjusting for inflation.[Kansas Governor’s Budget Reports for FY2010, FY2014 and FY2015]
Local health departments. Kansas cut aid to local health departments, which provide immunizations and physical examinations for children and are the first responders to disease outbreaks and other health emergencies, by another 3 percent between fiscal years 2012 and 2013, leaving that funding 14 percent below 2008 levels.[Kansas Department of Health and Environment data (Comparable data for fiscal year 2014 are not available.)
Supports for families living in poverty. The number of poor children and parents receiving income support from the Temporary Assistance for Needy Families (TANF) program has declined by 41 percent since 2012, much greater than the 12 percent decline in TANF recipients nationally over this period, in part because Kansas enacted a number of policy and process changes that make it harder for families to access and continue receiving the support. [United Community Services of Johnson County, “Kansas Could Do More for Poor Families with Children: An Analysis of TANF Budget and Policies,” December 17, 2013, http://ucsjoco.org/Uploads/Kansas-Could-Do-More-For-Poor-Children-and-Families.pdf. For caseload declines see Public Assistance Report SFY2014, Kansas Department for Children and Families, December 2013. http://www.dcf.ks.gov/services/ees/Pages/EESreports.aspx%5D
The number of children whose families receive child care subsidies, often necessary for low-income mothers to find and hold a job, has also declined — by 16 percent — since 2012, also in part because of the adoption of more stringent policies.[Ibid]
Courts. The Governor’s proposed budget for the Judiciary is 3.4 percent below 2012 levels, and down 16 percent since before the recession. The Chief Justice of the Kansas Supreme Court said recently that the judicial system, which has been understaffed for years, is at risk for statewide shutdowns after July 1 of this year. [Andy Marso, “Nuss: Courts Will Shut Down Without More Funds,” Topeka Capital-Journal, January 22, 2014, http://cjonline.com/news/2014-01-22/nuss-courts-will-shut-down-without-more-funds.%5D
So please no more “facts” from your Bizarro World of Misinformation.
ricardo,
can’t you just admit that the republican led kansas economic policy has been a failure-rather than offer up excuses? kansas has been offered up as the conservative economic solution, until the results failed. once the policy failed, you want to say this was not a conservative run state after all, but a bunch of socialists! and if only we could have conservatives run the state, all would be fine. amazing denial of reality!
Yeah, but if Ricardo admits that, he loses. This is a clear test, and the results speak for themselves. Contractionary fiscal policy is contractionary. Game over, unless you are a total cultist or a paid hack. So, he has to create an alternative reality so that the lie can continue.
And just to be clear, the lie is that people like him really care about any of this. What they really want to say is something like, “Government spending using redistributive taxation is unfair”. But that won’t work with voters, so they say instead “Government spending (using redistributive taxation) is counter-productive”. This whole elaborate ideology is scaled-up to surreptitiously advance ulterior policy goals.
I visited this site (http://wallethub.com/edu/most-least-happy-states-in-america/6959/) and thought Menzie would enjoy making fun of his favorite governor. Minn rank 2 and WI rank 22. Have fun!
howard,
Thank you for an economic question – and a good question. When government increases spending it distorts consumer wishes. The free market allows consumers to make their own decisions about what to consume. When the government makes consumption decisions it is the whim of one or a small group of consumers. Also, it is not unknown that government whether Democrat or Republican engages in rewarding cronies. Politicians spend to gain votes.
Reductions in taxes and spending cuts put the decisions back in the hands of the consumber. Reducing taxes while not reducing spending simply kicks the can down the road. At some point taxes will have to be raised to pay for the spending so nothing is solved. In a state that is required by statute to balance the budget is engaging in an act of futility by not dealing with both excessive taxation and excessive government spending.
Does that help?
Kansas had a more shallow recession and a slower recovery.
The mix of GDP in the recovery may be an improvement, in raising living standards.
We neither know how much of an effect Kansas government policies had on the recovery nor how much factors beyond the control of state government had.
For some commentators to use “failure” is jumping to a conclusion. Suboptimal is a better conclusion.
We know it by comparing the past performance of KS to the post-Brownback performance in relation to the rest of the USA. KS matched the USA clearly before him, then it went south after him. There would have to be a simultaneous shock that happened exactly when Brownback took power only in KS to explain away the results. That is not plausible. Contractionary fiscal policy is contractionary.
XO, why would you expect stronger recoveries from more shallow recessions?
And, ignore other factors beyond government, e.g. drought in agriculture or demand in aircraft?
Moreover, GDP is not an accurate measure of living standards.
Kansas is closer to full employment than the U.S.:
http://research.stlouisfed.org/fred2/series/KSUR
http://research.stlouisfed.org/fred2/series/UNRATE
A question from someone with little economics background: why is GDP still growing well if the other indicators are negative?
Peak,
I don’t believe it is so difficult to know that factors beyond Kansas government control had major influence on the performance of Kansas GDP in 2012 and 2013.
The worldwide slowdown and the sequester had obvious downward effects on the important aviation sector. The same time Kansas suffered from sever and prolong drought starting in 2012 and just recently ended with the spring growing season of 2014.
The general tax relief, both personal and business, is the right path for Kansas to begin to diversify into other areas of business. And by the only useful means, from the bottom up by individual initiative.
Ed
Ed, I worked for a few days on my vacation in California and needed a business license.
I paid about $100 for the license and earned less than $1,000.
I got a letter from the city saying I owe $1,871.85 in business taxes!
From 2010:4 to 2013:4, Kansas real gross state product rose 5.1% as US real GDP rose 6.2%. Kansas depends on small aircraft production and to a lesser extent on agriculture. Wichita is known as the “Air Capital of the World.” Both are export industries for Kansas, and jointly have a huge multiplier effect on the rest of the state’s economy. Aircraft was extraordinarily hard hit by the crisis, and US beef consumption is in secular decline. Per capita beef consumption from 2010 to 2014 is down 10% according to the USDA. The secular stagnation afflicting the US was not apparent until the cyclical rebound trailed off in 2010. Demand for aviation related business typically lags behind the recovery of other sectors. This lag has been extended in this quite atypical recovery. In today’s environment, it’s fair to say budgets are still in flux as businesses and households continue to substitute away from relative luxuries.
Surprisingly, if Kansas ag output alone had grown at the same rate as US ag output, Kansas state product would have grown 6.1%. Virtually identical to US growth!
Durables manufacturing in Kansas is dominated by small aircraft. The recent pattern of growth cannot be understood without going into industry detail like this. Especially recognizing the differentially lagged effects across states due to industry composition in today’s vastly changed economy. What’s happening to the fisc explains little of this. Without detailed analysis (a model), we cannot even tell if other sectors in Kansas might be benefiting from the tax cuts because the dilatory effects from ag and aircraft spilling over onto the rest of Kansas’s economy may have (until now) swamped them.
Well, there is no secular stagnation. Look at all the above graphs for the USA, we are returning to a full economy. Most leading indicators are trending for even higher rates of growth.
And, these things that you mention are not simultaneous shocks that are concurrent with Brownback’s governorship. To explain away the results, there needs to be another factor that happens only in KS at exactly the time Brownback takes over. And you have not described that, and I doubt there is such a simultaneous shock.
KS matched the USA before Brownback’s austerity and tax cuts, and trailed after. No other way to interpret what we see here.
JBH, as usual, the top commentator on this chatblog.