Newcomers to macro often encounter problems in interpreting and using data. The first is how to report growth rates, particularly when trying to assess the current state of the economy. The second is how to read data reported at annual vs. quarterly vs. monthly rates. The third is accounting for the presence of breaks in data collection. (This post primarily for students in Econ 435 and Public Affairs 854.)
Growth Rates
Suppose one wants to report annual growth rates, but one has a choice between using annual data or quarterly data. One convention applied to quarterly data is to use 4q/4q, that is the growth rate from the previous year’s 4th quarter to the current year’s. This calculation sometimes leads to similar growth rates, but sometimes does not. Consider a comparison of the years around the last recession.
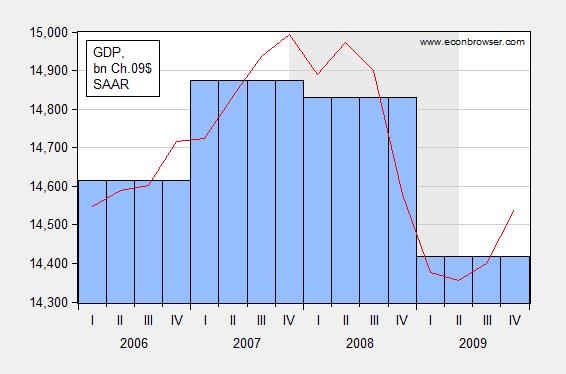
Figure 1: Annual GDP (blue bar), and quarterly GDP SAAR (red line), in bn. Ch.2009$, 2006-2009. Source: BEA.
The growth rate in 2008 using annual data is -0.29%, which seems like a modest decline. The 4q/4q change in 2008 was –2.77% (and the 2009Q4 2008Q4 q/q annualized growth rate was -8.35 -8.19%). Which calculation is correct? Neither — it depends on what the question is. However, if one were looking at the data in early 2009, one would probably want the most recent reading on GDP growth; hence a q4/q4 reading is probably more useful in this case.
Another way to look at this is that the year-on-year calculation is approximating a growth rate calculated from the middle of the previous year to the middle of the current year. Figure 2 shows the growth rates calculated using year-on-year annual data (blue), 4q/4q using quarterly data (red), and the 4 quarter change in the average of Q2 and Q3 GDP (green).
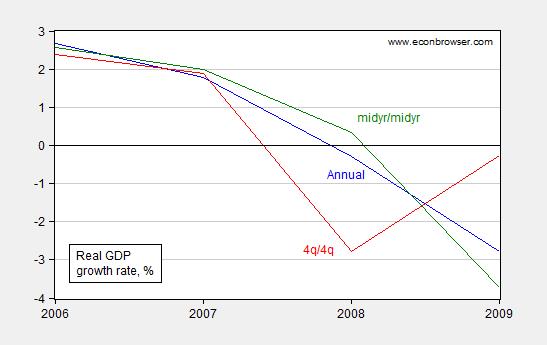
Figure 2: Real GDP growth rates calculated using year-on-year annual data (blue line), 4q/4q using quarterly data (red line), and the 4 quarter change in the average of Q2 and Q3 GDP (green line), in %. Source: BEA and author’s calculations.
Bottom line: Year-on-year annual growth rates are essentially measuring the growth rates assessed from the middle of the year.
Annualized and Non-annualized Rates
Oftentimes, one sees the term SAAR ascribed to a data series; this abbreviation stands for Seasonally Adjusted at Annual Rates. Typical US government macro aggregates are typically reported at annual rates — for instance the GDP levels (red line) reported in Figure 1 are at an annual rate — that is the level of GDP that would obtain if that rate of spending in that quarter continued for an entire year.
This is something that even University of Chicago macroeconomists can make mistakes with. As I pointed out at the time, if one is calculating a multiplier as the change in GDP for a given dollar amount of stimulus (ΔY/ΔG), for instance, one has to remember the GDP figure is reported at annual rates, while the stimulus figure was (in this case) reported at a quarterly rate. Paul Krugman also noted that if one forgets that growth rates (in the US) are typically reported at annualized rates, one can make a compoundingly embarrassing error.
Just to confuse matters, not all US government series are reported at annual rates; some are not. For instance quarterly Balance of Payments data in the international transactions release are reported at quarterly rates; monthly data in the trade release are reported at monthly rates.
And once one starts looking at foreign data, one has to be particularly attentive; quarterly GDP level and growth rates are typically reported at quarterly rates.
Data Breaks
As government and international statistical agencies collect data, the mode of the data collection or the means of calculation sometimes change. Those changes are usually noted, but if one does not read the documentation, one can make serious mistakes. For instance, examining civilian employment (FRED series CE16OV), one would think there was a tremendous boom in employment in January 2000.
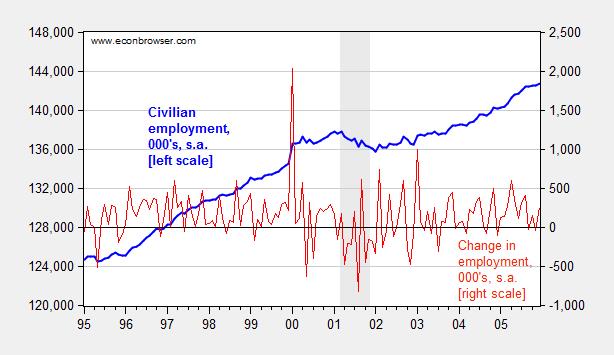
Figure 3: Civilian employment (blue, left scale) and change in civilian employment (red, right scale), both in 000’s, seasonally adjusted. Source: FRED series CE16OV.
If one inspects other series, say nonfarm payroll employment, one sees no corresponding jump. This suggests the boom interpretation is wrong. Further evidence of a “break” is found by inspecting the first difference of the series (in red). The spike in January 2000 is a 1.5% change (m/m), while the the standard deviation of changes is 0.3% (calculations in log terms).
In fact, the jump is due to the introduction of new population controls associated with the Census. New controls are applied every decade, so this is a recurring (and known — to those who are careful) problem. Nonetheless, here’s an example of the mistake regarding the participation figure. Other breaks are less obvious. This is a cautionary note to all who download data without consulting the documentation.
Update, 9/10:
Rounding Errors
In principle, real quantity = total value/price deflator. For instance GDP09 = GDP/PGDP09, where GDP is measured in $, PGDP09 is the GDP deflator taking on a value of 1 in 2009, and GDP09 is GDP measured on 2009$. In practice, there is a slight rounding error, which typically does not make a difference, but can if (1) growth rates are very high (or very negative), and (2) one is annualizing quarterly growth rates.
I used the manually deflated series for the 2008Q4 q/q calculation, when in this case it would have been better to use the real series reported by BEA to do the calculation.
Figures 4 and 5 show the rounding errors.
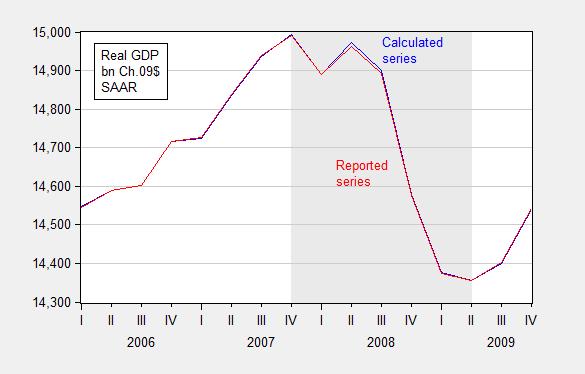
Figure 4: GDP in bn. Ch.2009$ SAAR, calculated by deflating nominal GDP with the GDP deflator (blue) and as reported by BEA (red), FRED series GDPC1. Source: BEA 2014Q2 2nd release and author’s calculations.
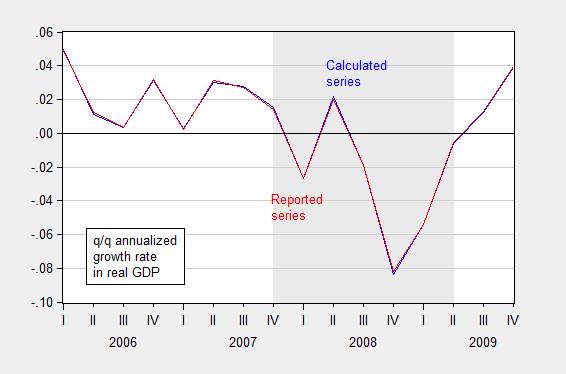
Figure 5: Quarter-on-quarter annualized growth rate in GDP in bn. Ch.2009$ SAAR, calculated by deflating nominal GDP with the GDP deflator (blue) and as reported by BEA (red), FRED series GDPC1. Source: BEA 2014Q2 2nd release and author’s calculations.
What this demonstrates is that most economists use reverse engineering in their econometric analysis. They first deterrmine the answer they want and then choose the methodology that supports their answer. For those interested in honest and serious economic analysis consider Hayek. No one knows enough to attempt to run an economy. Hayek spoke of “spontaneous order” where human action takes what is known and what is available and uses it to ease man’s discomfort. Data is good to analyze the results of decisions but sadly most econometrics is taught as a system of making decisions. Knowledge cannot be organized by econometrics because the knowledge is not available. Econometrics properly used to test results can be beneficial. Econometrics used to dictate policy even in the most capable hands leads to error and economic waste.
Menzie, thank you for a great post to illustrate Hayek’s insights!
Ricardo: The above discussion pertains not to econometrics. It’s just a primer about how to read the data, and understanding growth rates.
Population growth (and immigration) compared to job creation should only be used as a factor when making predictions for future participation rates. Instead, use those who are already inside the population numbers — such as high school graduates (3 million a year).
The St. Louis Fed currently reports 6.3 million unemployed working-aged Americans who are not counted as “unemployed” — but “also want a job” — and are “not in the labor force”. Now add 9.6 million currently counted as “unemployed”, and there are still 15.9 million people in the U.S. who are out of work with only 4.3 million job openings. That is one job for every 3.7 unemployed.
Only a little over 1 million year are retiring or going on disability, so Boomers aren’t driving the declining LFPR, prime-age workers who can’t find work are.
Numbers and source links here:
http://www.bud-meyers.blogspot.com/2014/09/63-million-unemployed-not-counted-in.html
Thanks for the post. One question, one request.
The question: When the press writes, “GDP was up 4.2% in Q2”, what exactly does this mean? I thought in meant (Q2 14 / Q2 13) -1. But it occurs to me that might not actually be right. What is the standard interpretation?
Also, I great source of historical GDP data is the Penn World Tables. GDP is calculated there perhaps three different ways. Would it be possible to prepare a post on the PWT data, what it is, how it works, relates to IMF, how it was collected, limitations, etc.? Perhaps you might prevail upon the PWT directors, Alan Heston or Robert Summers, to provide one or more posts about this unique data source, and some things to keep in mind when we use it.
Thanks.
In the US, the 4.2% means at an annual rate relative to the previous quarter (q1). Thus iGQP was 1 percent higher in Q2 than in q1, which is 4 percent at an annual rate. European countries generally do not report the growth rate at an annualized rate
Steve Kopits: That’s the problem — it’s never clear, so one has to figure it out from context. In the US, it would likely be Q2 14/Q1 14 taken to 4th power minus 1. If it’s in Europe, my guess would be what Q2 14/Q1 14 – 1. If it’s China, it’s likely to be (but not guaranteed as of a year or two ago) to be what you surmised.
Regarding PWT, Rob Feenstra has written up in clear language the underpinnings and motivations of the most recent version.
Yes, thanks.
I tend to use 3 mma yoy for oil data, mostly because it’s not seasonally adjusted or noisy. A year gives more stable perspective, I think.
As for GDP, if it’s sequential quarters, then I would think there would be a pretty decent amount of pressure on the SAAR coefficients…
Yes, Feenstra does have a nice write up. On the other hand, not all you readers may know it. Might be worth a little tour.
Menzie,
I am sure you did not write that for economists and you may not realize it, but it does pertain to economists (Hayek).
Menzie,
“The 4q/4q change in 2008 was 2.77%” , was it?
rtd: Sorry, the minus sign was omitted originally; it’s –2.77%.
Also, “(and the 2009Q4 q/q annualized growth rate was -8.35%)”, was it?
rtd: Yes, that is correct.
Interesting. I know this is extremely elementary, but how did you get an annualized growth of -8.35% for 2009q4? Maybe I pulled the wrong data from FRED?
rtd: Let y[t] = real GDP for quarter t. Calculate (y[t]/y[t-1])^4-1.
I know the formula for annualized growth rates, which is why I mentioned data. FRED has the following:
2009Q3: 14402.5
2009Q4: 14541.9
-8.35%, this does not compute.
RTD,
I think there is just a typo in Menzie’s post. He was comparing different ways of calculating growth in 2008 and he meant q/q annualized growth in the fourth quarter of 2008 rather than 2009. However, there seems to be another small typo–I get -8.188% for the q/q annualized growth rate in the fourth quarter of 2008.
Menzie,
Looks like 2 very good courses. Econ 435 looks particularly interesting.
Trust me, I saw the -8.188% before my initial comment on the -/+2.77%. My approach was to slowly walk the horse to water, I wasn’t planning on drinking for him….. just waiting to see if the good professor would recheck his calcs after seeing the typos first. Especially as they are so elementary even a Chicago economist wouldn’t make them 🙂 . Anyways, here’s to learning opportunities for everyone (no matter their level of expertise) and especially those students enrolled in Econ 435 and Public Affairs 854.
rtd and Rick Stryker: mea culpa, you are right about the exact number. I made the mistake of deflating the nominal GDP series by the GDP deflator as the measure of real GDP. This should equal real GDP, but in practice there is a small rounding error. Usually this doesn’t make a big impact, but when one has an extreme change (as in 2008Q4 — that is a typo), and one annualizes, then one can get a detectable difference in calculated growth rates.
Hence, I’ll add a 4th point to the post — rounding errors.
Thanks to all for catching the errors.
You need another set of parentheses, don’t you?
((y(t)/y(t-1)^4)-1
spencer: Yes, I was lazy and using the operator precedence of exponentiation and multiplication before addition/subtraction.