Last week I commented on a puzzling phenomenon in bond markets this year– long-term rates have been falling at the same time that nearer-term rates have been rising. Bruegel has a review of some of the discussion of this around the web.
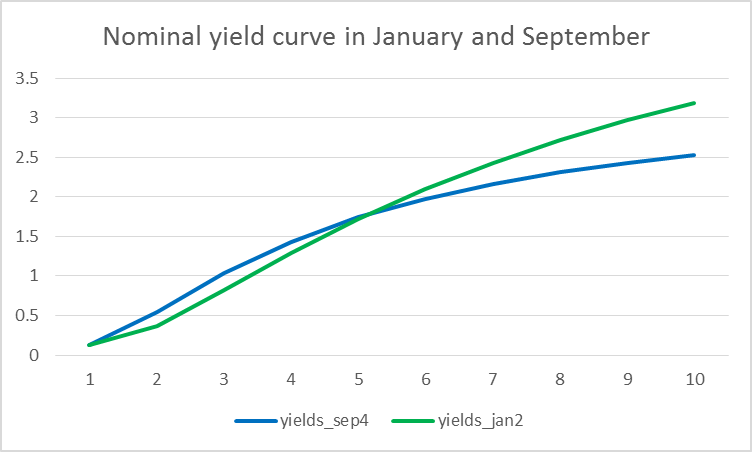
Nominal yields on different U.S. Treasury securities as a function of years to maturity as of January (green) and September (blue) of 2014. Data source: Adrian, Crump, and Moench.
The same shifts are seen in both the nominal yield curves (above) and the real yield curves (below). The interpretation I offered is that the higher near-term rates reflect the perception that the time when the Fed begins raising short-term rates (likely some time next year) is now less far away that it was in January, while growing pessimism about longer term growth prospects may account for falling longer term yields. However, this interpretation is difficult to reconcile with this year’s strong stock market.
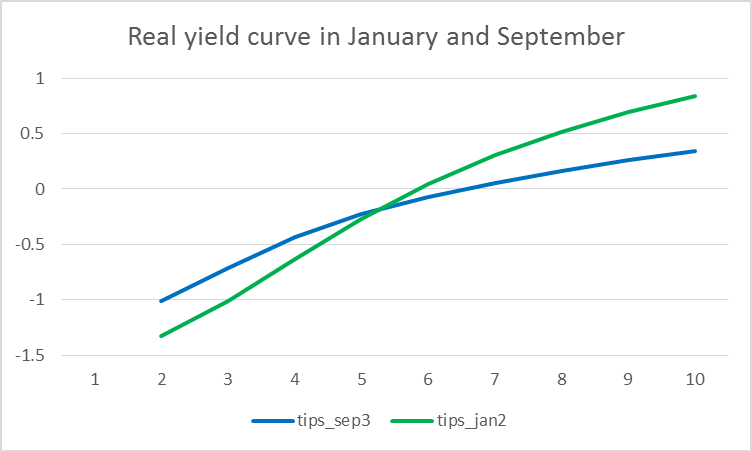
Real yields on different U.S. Treasury Inflation Protected Securities as a function of years to maturity as of January (green) and September (blue) of 2014. Data source: Gürkaynak, Sack, and Wright.
My interpretation assumed that the changing yield curve largely reflects changing expectations about future rates. But we know that another important component of the yield curve is the term premium, an added compensation you can expect to receive if you are willing to tie up your money long term. I provided a simple correction for term premia in my discussion last week. David Beckworth looked at some more sophisticated estimates of term premia developed by Adrian, Crump, and Moench. These suggest that term premia on all bonds have fallen significantly this year, with the changing 5-year 10-year differential largely explained by the fact that term premium on the 10-year bond has fallen more than that on the 5. However, this basically just passes the puzzle over to the unanswered question of why the term premium on longer-term bonds should have fallen so much more than that on short-term securities at the same time that the Fed is winding down its purchases of longer-term securities. Below I plot the contribution of term premia to the yield on each security as inferred by the Adrian, Crump, and Moench methodology.
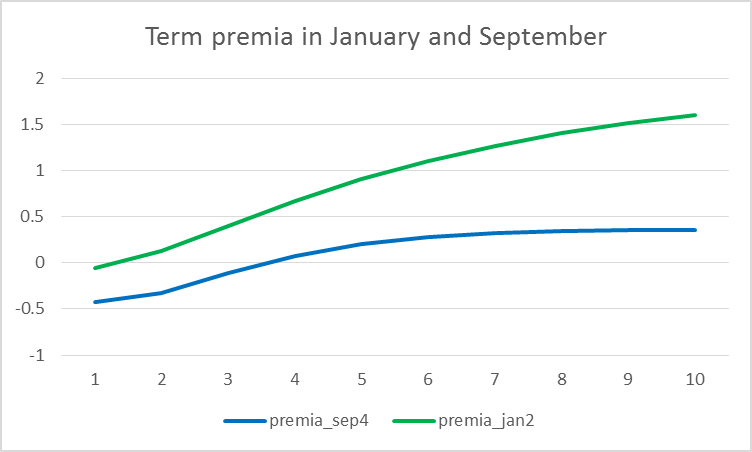
Term premia on different U.S. Treasury securities as a function of yield to maturity as of January (green) and September (blue) of 2014. Data source: Adrian, Crump, and Moench.
Unfortunately, separating the contribution of term premia is not that easy to do. The basic idea is to form a model to form a good forecast of future short-term rates, and interpret the difference between the observed bond yield and the discounted value of the model’s expected future short rates as the term premium. But different reasonable approaches to forming those forecasts can result in very different assessments of movements in term premia. The figure below shows that various approaches can differ wildly in terms of the answer they give.
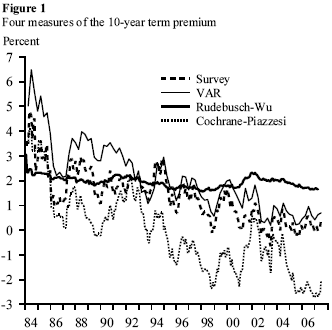
Term premium component of the yield on 10-year Treasury security as inferred from 4 different methods. Source: Swanson (2007).
Econbrowser reader JBH also called attention to the fact that the yield on long-term German bonds has fallen even more dramatically this year than U.S. Treasuries, suggesting that some of the source for the flattening U.S. yield curve could be global.
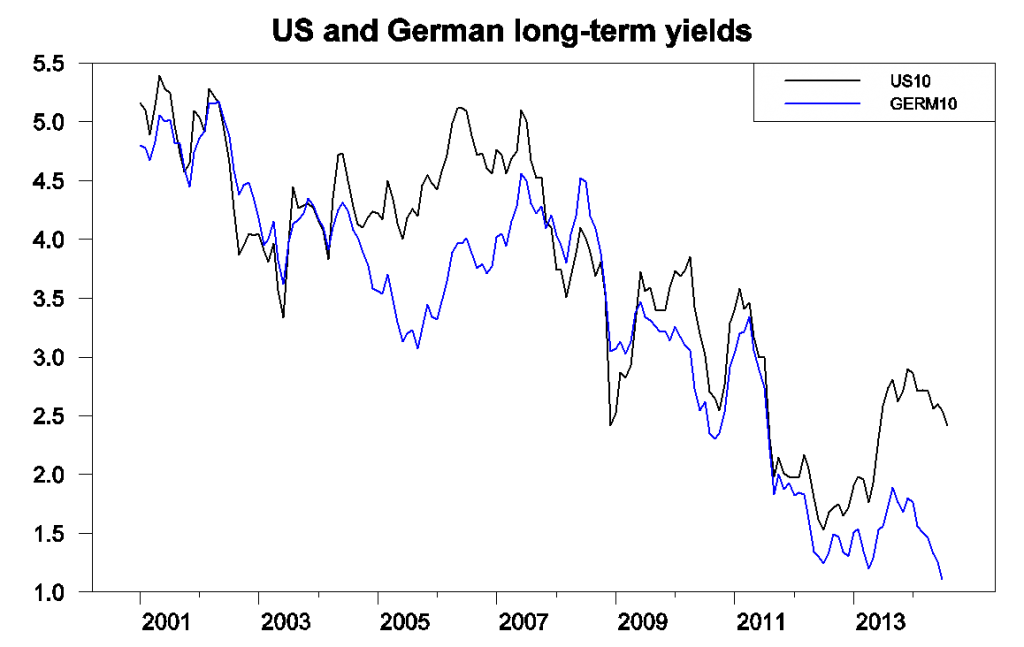
Yields on 10-year U.S. Treasuries (black) and long-term German bonds (blue), monthly, Jan 2001 to July 2014. Data source: ECB.
Robin Harding and Michael McKenzie note in the Financial Times how unusual this year’s divergence between the U.S. 5-year and 10-year rates is. I did a calculation related to theirs, looking at the correlation between monthly changes in the 5- and 10-year rates over 12-month periods. This correlation today is the lowest it’s been in the last 30 years.

Zero-mean correlation over 12-month period ending at each date between monthly change in 5-year and 10-year rates.
On the other hand, the co-movement between U.S. and German yields this year has not been that unusual. For example, in 2011, the two moved together much more closely than they have this year.

Zero-mean correlation over 12-month period ending at each date between monthly change in yield on 10-year U.S. Treasury bond and that on long-term German bond.
To the extent that Europe’s long-term prospects have dimmed, perhaps investors are willing to accept a lower real return on long-term investments in the United States, and this may account for part of the puzzle. And if the market expects the Fed to start raising rates sooner than the weak world economy warrants, that may account for some of the unusual behavior of the 5-year rate relative to the 10-year rate.
It seems like the extremely anomaly on the 5- vs 10-year is actually here, peaking July/August 2012:
https://research.stlouisfed.org/fred2/graph/?g=J2i
The divergence of *changes* between those rates since then just looks like it’s caused by reversion to the mean.
I dunno. It seems that we routinely see this pattern. The bond yield curve flattens and sometimes inverts when bond traders are pessimistic about the future. Bond traders by nature have to look long term and the yield curve is a leading indicator. Stock traders look short term and are a lagging indicator. Stock traders hate to leave the party just when it’s going good they always think they are smart enough to get out just before it crashes.
Look at the yield curve inverting in 2006-2007 just as the stock market was peaking. It’s frequently a pretty good leading indicator for bad times ahead. The current flattening of the yield curve could be a bad sign if it continues to inversion.
JDH wrote in 2004: “The statistical evidence suggests that any time the yield spread gets below 100 basis points, it raises the probability of an economic slowdown even if not a full recession.”
Menzie Chinn wrote something similar in 2007.
How is this time different?
We should not disregard the changes in market structure and regulatory environment. How do those changes affect duration adjustments? We need to consider that there may have been a regime change that puts greater weight on adjustment on fives. Look at volume numbers in the Treasury futures market. Trade in fives is a large share of the total volume. There are some types of retail account for which fives are the longest maturity they generally hold. If those accounts account for a larger share of trade, then the behavior of 5s may have changed relative to other maturities.
Looking for an economic explaination could mislead us if there has been a behavioral change or a shift in the kind of account dominating trade.
We’ve had a weak economic recovery – a rolling depression, where the economy improves for a few months and deteriorates for a few months, etc.. Yet, corporate profit growth has been strong.
“Earnings for S&P 500 companies will climb 8.1 percent in 2014, according to the average analyst estimate compiled by Bloomberg as of Aug. 29. Profits will grow 11 percent in both 2015 and 2016, the projections show.”
Chart of corporate profits after tax:
http://research.stlouisfed.org/fred2/series/CP/
Professor,
Thanks for doing the heavy lifting on this. We were in a discussion of this at lunch last Friday so your article will give us good food for thought.
for what did I post on 8/31 this
https://econbrowser.com/archives/2014/08/bond-market-conundrum-redux#comment-184642
August 31, 2014 1:20 pm
US bonds are tracking ECB policy
genauer:
I suspect you believe you will change minds of regular commenters on this site. You carefully think through a subject and give it your best shot. Yet here come comments and new posts that to all appearances the authors did not read and carefully reflect on what you said, extract from it whatever truth they were able to perceive, do some research on their own, and then modify their views accordingly. (In support of this, observe the cacophony of views about what causes interest rates to move as they do. In fact, this cacophony speaks to a profession in disarray, mostly ignorant of not all, but surely of many ins and outs of the most important price in the economy!)
Yet there is another audience. The many who come to this site to learn something, but who never post. Other than in direct responses like this, I no longer believe my often detailed comments will change minds or add to the knowledge of most regulars here. For one thing, all but a dozen or so are died-in-the-wool Keynesians, which is a theory that contains a nugget of truth. Albeit a small nugget indeed. Most minds, not just those of economists but of Everyman, are mostly impervious to anything that conflicts with their beliefs. There are psychological reasons for that. Nonetheless, open-mindedness is a commodity in short supply. Your remark “for what did I post on 8/31 this” did have value, though. Other readers learned something from it even though you got no feedback from them.
The shorter end of the curve is pricing in rate increases over short-term, while the long(er) end of the curve is pricing in the damage that those hikes will do to the economy (and the subsequent reduction in rates).
Bond market’s way of telling us that the FED is behind the curve in this cycle?
Completely OT:
Please find a link to a Roger Ebert’s review of “Boychoir” a fictionalized story revolving around the American Boychoir School, which my son attends. If you scroll down, you can see my son behind Dustin Hoffman, top left, in glasses.
http://www.rogerebert.com/festivals-and-awards/tiff-2014-day-four-men-women-and-children-ruth-and-alex-boychoir
Roger Ebert is, of course, dead. It’s on the Roger Ebert.com website.
I wonder if the fall in longer-term yields is merely due to this being the peak part of the business cycle, where tax revenue is the highest, so deficit spending is the lowest, meaning less issuance of 10-year Treasuries, so the supply is less, keeping yields low.
This reverses quickly once the peak passes and the business cycle starts to get tired.
Also, a second factor might be that China recently bought $400B of Treasuries via Belgium. This may have been a one-time thing.
JDH: Nice catch on the contradictory signals coming from equity and bond markets.
All I can say is inflation expectations are as low as ever, expectations for global growth have softened and that, barring a major geo-political cock-up, we could be in the early phase of a decade long secular financial bull market.
It is also interesting to watch oil prices soften despite Islamic State being so close to southern Iraqi oil fields and the Gulf of Persia.
Six truths on interest rates: (1) No academic model has ever successfully forecast interest rates to any close degree of accuracy consistently for any amount of time into the future from that date forward. (2) The base of the yield curve dominates the movement of the entire curve over the longer run. (3) Expectations of fed funds 24-months ahead dominate and drive the movement of the curve up to the 2-year point. (4) This leaves the 2-year to 10-year spread as the key thing to be explained independent of the movement of fed funds. In one historic episode, 1990 to 2003, a single variable explained over 90 percent of the variation in this spread! The forecasting accuracy of this variable went awry in 2004 at the time of the Greenspan conundrum. (And not surprisingly, lost all explanatory power in the artificial regime imposed on the market by the Fed since 2008.) (5) From time to time, some new variable enters the market and for a time explains a substantial amount of the movement in the spread. When the source cause goes away, so does the impact on rates. In general, these episodes can be construed as themes of the market, and are identified in real time by closely observing the market’s day-to-day movement. Especially, what new thing enters the market causing the big daily moves in the direction of a newly developing trend. The asymmetry of analysis implicit here is purposeful. (6) Without exercising extreme judgment in a day to day manner – essentially an art – real time forecasting accuracy on a horizon of, say a year ahead, is hard to come by in a sustainable, consistent way. It goes without saying that themes that will arise in the future are, in a specific dated sense, impossible to forecast. Though a careful study of all past themes will reveal a discrete number of broad categories. Classification like this is one of the first steps in any science.
You can conclude from this that events analysis is far more powerful than regression analysis for the purpose of explaining interest rates. You can conclude that the lasting value of any academic paper will be directly proportional to the amount of events analysis therein. And with somewhat less certainty, you can conclude that the historically unique theme of the Ukrainian crisis that narrowed the spread this year will likely unwind now if the ceasefire reached last week holds. It will not be lost on the thoughtful reader that this is a testable hypothesis. That US long rates have now made their low is the way to bet. Yet it should not be overlooked that some new theme can enter the market and override flight-to-safety. In either direction! Case in point is a potential new theme developing – one driven by independence of Scotland. The deeper causality of this possible theme is that Catalonia could then be next, with the potential to then unravel the euro via Spain or even another Southern periphery country contemplating peeling off.
JBH: Your post begs the question. What economic models do generate economically useful forecasts?
westslope: The simplest answer is models that look at all the little parts, and only then get a view of the whole. Models that do not make all the parts conform or fit to an imposed or preconceived view of the whole. Models that, at present state of the art, neither can nor should be made to fit a Procrustean bed of equations. Models that recognize that context is important, and that in general context is always in the process of change. Models that recognize that the universe operates at the margin, so that homogenization of independent information in past historic data points averaged, boiled down, and congealed into a handful of estimated coefficients does not really suffice. Models that are open to new forces that enter the market, and indeed include a variable, if you wish to call it that, that is always on the lookout for such. Such models must be capable of taking a celestial dome view so that nothing of major importance is ever missed. Yet at the same time probably require the granularity of daily frequency data, which is where much of the real information lies.
Let me illustrate with a recent example. You had to be open-minded enough in 2007 to recognize the existence of systemic risk. Not something that forecasters ever faced in their lifetime. A brand new variable. Then keep track of unfolding developments on all fronts as we moved into early-2008, and then through the Bear Stearns incident and into the summer. By then it was reasonably clear fed funds was going to zero. No equation told you that. It had to be worked out by hard thinking. Jointly, all of this and more is the model you ask about.
@ JBH
thanks for your kind words.
I blurbed it here with the Financial Times (FT) link, because, as I assume, most in this blog have no subscription, and in general very limited knowledge and interest in Europe.
Most the times I come here, I also just read.
But when I feel the lack of understanding, mere technical knowledge, not opinions, becomes too severe, like with
a) alleged “unsustainability of Greek debt”
b) Russian bond dynamics
c) the relevance of english RUSI’s war maps with ghost divisions of folks, who, if involved at all, are moonlighting on the other, the rebels side, including the tanks and and other tools
I tend to leave a few comments, apparently repeatedly a little too terse
As a background:
I m a west German, proudly served my fatherland, physics PhD, worked for many years in New York, MBA, now living for many years in (formerly) East Germany,
I understand investment, especially the financial mechanics of more complex things you typically see in the US
So in other words you’re going to consider anything and everything anybody can pull out of a hat so long as it isn’t Yellen making clear her dovishness.