Bruce Bartlett brought my attention to this article, which Mark Thoma mused was “The Stupidest Article Ever Published”. From The Inflation Debt Scam, by Paul Craig Roberts, Dave Kranzler and John Williams:
To understand how risky the rise of debt is, nominal debt must be compared to real GDP. Spin masters might dismiss this computation as comparing apples to oranges, but such a charge constitutes denial that the ratio of nominal debt to nominal GDP understates the wealth dilution caused by the government’s ability to issue and repay debt in nominal dollars. …
I’m not a spin master, and yet I cannot help but dismiss this calculation as exactly comparing apples to oranges.
Nominal debt divided by nominal GDP is expressed in years — essentially years worth of GDP necessary to pay off the debt. I can understand what this calculation yields. In contrast, nominal debt is in $, real GDP is in Ch.2009$/year, so nominal debt divided by real GDP is a number expressed in years times dollars per Ch.2009$.
The authors present this figure to buttress their case:
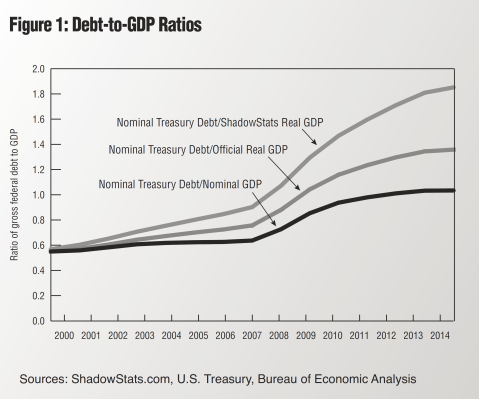
Source: Roberts, Kranzler and Williams, “The Inflation Debt Scam,” The International Economy (Summer 2014).
As far as I can tell, the article is merely an excuse for Williams to haul out the fully discredited “Shadowstats” one more time.
By the way, according to Shadowstats, the US economy has been shrinking nonstop since 2004-05, on a year-on-year basis…
So, if this is not the stupidest article ever, it is in the running (along with Don Luskin’s 2008 gem).
I’m not sure which fact bugs me more, the fact that one of the units makes sense while the other doesn’t, or that he’s plotted the two lines which are measured in different units on the same graph. To think that his ShadowStats methodology of “I think the government lies about the inflation rate, so I just add an entirely arbitrary constant that I pulled out of my rear to all the official inflation numbers,” is actually the least egregious aspect of the whole thing.
To think that his ShadowStats methodology of “I think the government lies about the inflation rate, so I just add an entirely arbitrary constant that I pulled out of my rear to all the official inflation numbers,” is actually the least egregious aspect of the whole thing.
That is not what Williams is saying. He is saying that if you apply the same methodology across time you will either get a no inflation period in the 1970s or a high inflationary period today depending on which of the two you choose. He is also saying that it is not legitimate to splice two series together and pretend that the trend is valid. This debate reminds me of the Peter Schiff on CNBC episodes. Everyone laughed and said that he did not understand anything right up until what he predicted came true.
I agree with you that I would not know how to interpret the ratio of nominal debt/real GDP in any meaningful way. It seems that Paul just wanted to produce a ratio which looks higher i.e. more scary.
On the other hand how to interpret the common ratio of nominal debt/nominal GDP especially when it approaches one or more?
Some people might argue that the government levy taxes on the nominal GDP and therefore in principle it could be used to pay off debt. What people do not seem to appreciate is the fact that in the extreme of 100% taxes GDP would probably approach zero (would you do business if you could not keep at least a part of the profits? Maybe for the fun of it but what do you eat?).
Bottom line I have not seen any interpretation of the nominal debt/real GDP ratio which makes any sense but on the other hand we should probably ask ourselves if our interpretation of the more common nominal debt/nominal GDP ratio (based on dimensional analysis) makes much more sense (especially when it becomes close to one or bigger).
Is this paragraph as “stupid” as saying there should be no limit on food stamp spending?
Your comment reveals more about you than you realize
First of all some aspects of the post and the comment above by “Nylund” are somewhat crazy themselves; for example in the details that nominal and “real” GDP are both expressed in dollars, so it is a like-for-like comparison in both cases with debt, which is also expressed in dollars, and dollars in one year are the same dollars in the next year. What applying an “inflation” correction does to GDP is to restate one’s year GDP with the prices of another year, that is changing prices, not dollars, because the dollars are the same.
The stupid in the idea of comparing “real” GDP with “nominal” government debt lies in several other points, only one of which is related to the “real” GDP thing…
While “real” GDP is expressed in dollars like nominal GDP, the base year is arbitrary, so the comparison depends quite a lot on the base year used to normalize prices. It is this that makes the comparison largely meaningless, even if the same units are used.
In “years worth of GDP necessary to pay off the debt” there are some big hidden issues:
* GDP is used to repay *both* public and private debts, and in the USA and other asset-stripping economies private debt is much, much more important than public debt. But right-wing “sell-side” Economists only talk about government debt.
* Assets can also be used to repay debt, either public or private. But right-wing “sell-side” Economists only talk about GDP; except when they suggest a firesale of valuable government assets at heavily discounted prices to the wealthy to raise money instead of raising taxes.
* What can repay public debt, and private debt that has become public because of Treasury or Fed handouts to the wealthy, is *taxes*. The percent of GDP paid in taxes is somewhat constant, but that still matters. But right-wing “sell-side” Economists never talk about *that*.
* Regardless of ShadowStats’ crude methods and excessive adjustements, that both the price indices and the GDP itself are LIBOR’ed in a significant amount is quite obvious; if only because year after year there is a constant stream of “sell-side” papers with methodology changes enacted or proposed that in the overhwelming majority of cases result in a smaller price index and higher GDP and GDP growth than before the change.
As to *nominal* GDP the favourite techniques used by “sell-side” Statisticians and Economists are:
* estimating the difficult notion of gross value added of services and government in such a way that double-counting of inputs happens as much as possible, which makes the whole GDP rather suspect as services and government are 80% of GDP;
* including as value-adding activities that are not value-adding such as crime (arguably a variant of the previous technique);
* changing classifications of stuff so that what was considered an input gets considered as final consumption (R&D, software, weapons, …).
Both right-wing “sell-side” and left-wing “sell-side” Economists either pass these things without comments or celebrate them as “innovations”. But no surprise: they are on the same side.
Blissex: You are wrong. Real GDP is measured in inflation adjusted dollars, so it is not measured “in dollars”.
In reference to the LIBOR’ed aspect of GDP statistics, I suggest you read this post.
== that is changing prices, not dollars, because the dollars are the same.
= Real GDP is measured in inflation adjusted dollars, so it is not measured “in dollars”.
The problem with that is that “inflation adjusted dollars” don’t exist. There are no 2009 dollars that are different from 2014 dollars. For example and quite relevantly a dollar in 2014 buys or redeems exactly one dollar of 2009 debt as it redeems exactly one dollar of 2014 debt, and viceversa. The unit of measure is the same.
“Real” GDP is an abstraction, and while it is measured in dollars, it is the *prices* that get adjusted, not the dollars. The article makes a mistake not because it compares different units of measure, a “syntactic” error, but because it suggests a comparison between the paying power of an abstraction dependent on which prices are used to compute it with a fact that does not depend on prices, a “semantic” error.
The overall difficulty is more profound, and it is that real (as opposed to “real”) GDP is a physical quantity, and once upon a time it was indeed reported as physical quantities (tons of steel, hours of entertainment, …). The “real” GDP that is reported in dollars is in effect an index, as it is quantities weighted by a somewhat arbitrary price vector. The dollars don’t change, but the price vector does, and that is the big deal, in more ways than one.
«In reference to the LIBOR’ed aspect of GDP statistics, I suggest you read this post.»
I had read that post, as usual very informative and well written, and it is really not relevant to my arguments:
«Regardless of ShadowStats’ crude methods and excessive adjustements, that both the price indices and the GDP itself are LIBOR’ed in a significant amount is quite obvious;»
My arguments are two:
* The ShadowStats estimate of the *amount* of LIBOR’ization of the price index is probably excessive, but the price index is quite obviously LIBOR’ed. Your post to me does shows that the price indices are not as LIBOR’ed as much as ShadowStats says, but nothing more than that. The argument is not that the very clever career oriented Economists and Statisticians that year after year are finding new ways to change methodology to shrink the inflation index bit by bit are falsifying the data, but that the methodology is unsound.
* That GDP, that is *nominal* GDP is LIBOR’ed by several methodological “techniques”, as in «As to *nominal* GDP the favourite techniques used by “sell-side” Statisticians and Economists are». Your post does not seem to me to address *nominal* GDP LIBOR’ization.
Perhaps it is unfair to call the constant methodological changes to both price index and nominal GDP “LIBOR’ization”, as the LIBOR raw data was fraudulently misreported, while all the methodological changes are duly disclosed in a stream of publications, but the net effect is similar, because the methodological disclosures are in effect immaterial, because they are instantly forgotten.
Aside: just ad most people are unaware that a significant part of the SP500 and DJIA “growth” is due to falling stocks are removed from them to be replaced with rising stocks, something that is euphemistically called “survivorship bias”, and is fully disclosed in methodological notes.
I personally think that most of the raw disaggregated data on which the price index and the nominal GDP are computed are not LIBOR’ed, and that the resulting “headline” numbers are not as LIBOR’ed as the Argentinian price index or the Chinese regional GDP, that is in double-digit LIBOR’ization. My impression is that msot first-world countries “methodologically” “manage” their “headline” numbers fairly subtly but still significantly, like 1-3 percent points.
If that is the case, “real” GDP growth for a few decades has been a lot lower than trumpeted, probably fairly small, and “real” GDP growth per-capita probably none or somewhat negative, as reflected in wage data; and that would explain the explosion of debt in first-world economies and the concomitant explosion of financial sector profits, as they depend mostly from asset stripping, in one form or another, and the measure of that asset stripping is in part given by the ballooning of the balance sheet of the Fed Board and their SIVs.
Some links on LIBOR’ization of indices and GDPs;
http://www.bbc.co.uk/news/blogs-magazine-monitor-28679674
http://www.mindfulmoney.co.uk/wp/shaun-richards/where-do-the-upwards-revisions-to-uk-gdp-leave-the-output-gap-and-labour-market-slack/
http://www.economist.com/news/finance-and-economics/21613321-how-revisions-will-soon-bulk-up-gdp-changing-scales
http://www.google.com/search?tbo=p&tbm=bks&q=isbn:9264007520 (section 4.2, page 32 “The Gerschenkron effect”)
http://blogs.wsj.com/chinarealtime/2014/04/30/cutting-the-fudge-chinas-bloated-local-gdp-numbers-go-on-a-diet/
http://growthecon.wordpress.com/2014/08/29/what-does-real-gdp-measure/
http://www.nakedcapitalism.com/2014/05/the-dow-jones-industrial-average-is-a-hoax.html
http://baselinescenario.com/2009/03/21/ceo-semiotics-and-the-economics-of-vilification/
Fro example my impression is that there has been a surge of “methodological innovation” for nominal GDP estimation in recent years, and that is may be due more to recent incentives than to the sudden discovery of much “better” methodology.
As to methodological “innovation” for nominal GDP I forgot one of the best links:
http://globaleconomicanalysis.blogspot.co.uk/2005/05/grossly-distorted-procedures.html
«I contacted the BEA today asking for the latest hedonic and imputation measurements. They pointed me to some online articles and tables and emailed me an Excel spreadsheet. Unfortunately the figures are severely behind and the latest numbers for imputations was from 2003. The most current figure I have for hedonic adjustment to the GDP is 2.257 TRILLION dollars which is roughly 22% of the GDP. To the best of my knowledge the US is the only major country that hedonically adjusts its GDP. »
Note that is the *nominal* GDP that is “hedonically” adjusted, so when people apply the CPI (instead of the GDP deflator) to nominal GDP to get “real” GDP they apply hedonic adjustments twice…
Some other links:
http://azizonomics.com/2013/06/01/the-trouble-with-shadowstats/ (amusing final…)
http://www.ritholtz.com/blog/2010/01/why-michael-boskin-deserves-our-contempt/
http://www.businessweek.com/stories/2007-06-17/the-real-cost-of-offshoring
http://www.interfluidity.com/posts/1160447599.shtml
«
Note that is the *nominal* GDP that is “hedonically” adjusted,»
Stiglitz has address both the government/services “value added” question and the “hedonic adjustement” of GDP, substantially even if not wholly, in this article:
http://host.madison.com/ct/article_71fad514-9caa-11de-9a00-001cc4c03286.html
«For example, while GDP is supposed to measure the value of output of goods and services, in one key sector – government – we typically have no way of doing it, so we often measure the output simply by the inputs. If government spends more – even if inefficiently – output goes up. In the last 60 years, the share of government output in GDP has increased from 21.4 percent to 38.6 percent in the U.S., from 27.6 percent to 52.7 percent in France, from 34.2 percent to 47.6 percent in the United Kingdom, and from 30.4 percent to 44 percent in Germany. So what was a relatively minor problem has now become a major one.
Likewise, quality improvements – better cars rather than just more cars – account for much of the increase in GDP nowadays. But assessing quality improvements is difficult. Health care exemplifies this problem: Much of medicine is publicly provided, and much of the advances are in quality.»
That «quality improvements [ … ] much of the increase in GDP nowadays» is fascinating.
How “flexible” can “quality” adjustments be? Consider for example:
http://www.slate.com/blogs/moneybox/2014/02/15/cable_price_trends_rising_or_falling_depending_on_who_you_ask.html
«ask yourself a basic question about cable television service during the era of consolidation. Has it gotten cheaper or more expensive? Well, the Federal Communications Commission collects data on this, but the data give two answers to the question.
One answer is that the average basic cable package cost $22.35 back in 1995 and $61.63 back in 2012, so the cost has clearly risen faster than the overall rate of inflation.
The other answer is that a basic cable package in 1995 had 44 channels on average, for a per channel price of $0.60 whereas 2012’s 150 channel package had a per channel price of $0.51, so the nominal price has actually fallen substantially.»
It is not a simple problem ;-).
«most of the raw disaggregated data on which the price index and the nominal GDP are computed are not LIBOR’ed»
Important note here: I have no proof of and scant evidence for that, it is just a guess.
«As to *nominal* GDP the favourite techniques used by “sell-side” Statisticians and Economists are:»
Here I did not mention one aspect that is not quite a methodological “innovation” but however matters a great deal: a large and increasingly larger over the past decade component of nominal GDP is profits of businesses, and in particular reported profits of large financial corporates.
As several episodes have shown reported profits of busineses and in particular financial ones are largely determined by massive accounting “management”, which is not accounting fraud only because Congress have made it legal whenever possible, and it has not been prosecuted and convicted, so it is presumptively legal, because too-big-to-jail.
In effect Congress and the Executive have a pretty large incentive to encourage accounting fraud to boost reported profits, because that also boosts reported nominal GDP (and taxes, at least in theory); and to encourage corporations to hide losses, because losses would hit reported nominal GDP (and taxes, again in theory). Thus the enacting of mark-to-fantasy accounting, and the storage of a lot of “impaired” securities in the Fed Board’s capacious balance sheets and SIVs.
My impression is that this has been worth some percentage point every year for some decades…
«In effect Congress and the Executive have a pretty large incentive to encourage accounting fraud to boost reported profits, because that also boosts reported nominal GDP (and taxes, at least in theory);»
One of the more nefarious “management”/”LIBOR’ing” techniques has been used several times in the recent past and has been to change the accounting rules for corporate (and I think not just corporate) pensions, to allow underfunding them, thus boosting rerported profits, nominal GDP and taxes (and bonuses!):
http://www.nytimes.com/2014/07/31/upshot/pension-smoothing-the-gimmick-both-parties-in-congress-love.html
«The Federal Highway Trust Fund is set to run out of money. [ … ] boiled down to “pension smoothing,” a budgetary gimmick worthy of Rube Goldberg. Here’s how it works: You let companies set aside less money in their pension plans. When they put less in their pension funds, they report higher profits and pay more in corporate tax. That generates a little extra revenue, which you can put in the highway fund.»
menzie, thanks for the link to the don luskin article. its a great example of somebody who denies reality in favor of their own ideology. did luskin get anything correct in that article? It was published Sept 14 2008. Lehman Brothers FAILED on Sept 15. The stock market closed Sept 12 at 11,422, and one month later it closed Oct 15 at 8578. But according to Luskin, the economy was doing great and all the fuss was scare mongering by Obama in order to improve his election chances. And these are the types of folks leading the conservative economic movement! should they be taken seriously at all?
Why is it that Luskin does not seem to me to be the sharpest analyst around? He was the guy who was very happy to be a bull just as the housing bubble was ready to burst and the contraction was about to wipe out a huge amount of American wealth.
https://www.youtube.com/watch?v=TU5QuUdPmwE
From what I can see we have another Schiff moment coming. The Fed is inflating the money supply. Japan, China, the EU, are inflating the money supply. We are looking at another war and another bout of QE under a different name. The economy is not growing and much of the supposed gains are due to financial engineering rather than anything tangible that has been exchanged in a free market. We have a huge bubble in the shale space that is actually also propping up the USD at a time when the economy is quite weak and the true unemployment rate is very high. With record numbers on Food Assistance programs, record numbers working part time or out of the workforce, and with SS and Medicare generating shortfalls at a time when no marketable assets are held by the supposed ‘trust funds’ we are not that far away from a huge crisis that is waiting for a catalyst.
Why use 2009 as a baseline for real GDP? That’s as arbitrary as using 2014! I suggest using 1789, when our perfect, except for the various government statistics agencies, country was founded! (More or less; at least that’s when Washington became president.)
This is a really good way of illustrating how arbitrary all of this is!
Ah for those thrilling days of yesteryear, 1954, in one of the first courses in engineering where we got rammed into our heads the importance of units in calculations. In those sliderule days we also had to keep track of the decimal point. The authors are saying in effect: Units! I don’t have to show you no units!!! Sure as hell would get you and F in engineering. Economics not so much.
«The authors are saying in effect: Units! I don’t have to show you no units!!!»
Really? They are using dollars in every case. It is the same unit. A dollar in 2009 or 2014 is the same dollar.
It is prices that change, and there is no good reason why GDP should be adjusted for purchasing power but not debts, and for any choice of origin, or for which purchasing power index to use, and for not using nominal both ways as debt is repaid anyhow in nominal terms, so nominal taxes matter. But that’s a completely different argument.
Stock/Flow MMMMM? I’m learning the lingo of economics. Whoraw for me!!
Blissex said: “…and there is no good reason why GDP should be adjusted for purchasing power but not debts, …”
I beg to differ. The reason it debts don’t have to be adjusted, is because they already are adjusted – that’s what interest is supposed to do.
Or, put differently: Debts shouldn’t be adjusted, because when the government borrows $1000 dollars they only have to pay back $1000 (plus interest). If we have raging inflation such that the GDP (and thus tax receipt) doubled, then the government would be twice as capable of paying back it’s debts.
You service debt with dollars, not with percent. Inflation and low interest rates is the friend of every debtor.
The argument that Bartlett is making is that Debts should be inflated to correspond with the inflation (that Shadow stat claims to detect) – and if you do that our situation is much worse than it appears. But that’s nonsense, since no bond holder can expect to get paid above the agreed upon interest rate (exception: TIPS which are inflation adjusted)
At any rate: if shadow stat’s inflation measure is correct, then the ability of the US Government to pay back its debts is increased
«that both the price indices and the GDP itself are LIBOR’ed»
The wider point is that there is an overwhelming incentive to LIBOR’ize any reported number that moves markets or votes, because there is an often gigantic payoff in doing do: a footnote in a methodology disclosure can move that number at a minuscule fraction of the cost of actually moving the previously reported quantity.
Aggregates like GDP or indices computed from aggregates CPI or SP500 or DJIA are particularly easy to LIBOR’ize because it is possible to significantly change the reported number by changing the aggregate or by changing the weights given to the components of the aggregate, always in the name of greater “accuracy”.
LIBOR itself was riskier to LIBOR’ize because it was done by changing the raw numbers themselves, which can ber construed as fraud; while a footnote in an obscure methodology paper counts as disclosure.
Just one of the many methodlogy changes over the past decades was wort by itself 2.7% of extra GDP, making the debt-to-GDP ratio that much easier to manager, at essentially zero cost (but I hope that whoever came up with it got the big promotion or salary raise or bonus they deserve!):
http://www.businessweek.com/articles/2013-07-18/the-rise-of-the-intangible-economy-u-dot-s-dot-gdp-counts-r-and-d-artistic-creation
BTW there are also “private” incentives in LIBOR’izing indices of all sorts: the Futures act of 1992 celebrated by Summers, Rubin, etc. explicitly removed any restrictions on gambling on *anything* by banks and other financial companies, as long as such gambling is cleverly packaged as a derivative, which is really easy to do (because in effect “derivative” is merely an euphemism for “bet”). Since this gambling can involve bets of individual worth of billions or dozens of billions, with proportional bonuses, bank and other financial company traders have large personal incentives to “massage” the outcome of the bet in the best way for themselves, and if the bet is about, as it often is, some index, that means that huge amounts of money can be invested in ensuring that those bets have the right outcome.
Ricardo: “Is this paragraph as “stupid” as saying there should be no limit on food stamp spending?”
Here’s a GDP ratio you might actually find useful.
Food stamps amount to less than 0.5% of GDP.
The easiest debunking of Shadowstat is accomplished by using the “inflation estimates” to find past prices. If inflation “has been going at 10% for some time” and the current price of gasoline is , assume $3.61, then the 1997 price (which is when Williams says the great change occurred) was $0.72 a gallon. Anybody pay $0.72 a gallon for gasoline during that year? Or bread, let’s say a current $1.20 a loaf, that would have cost $0.24 a loaf in 1997 since food is going up at 10% a year. Or milk, in Wisconsin milk goes for (let’s assume a price) of $3.00 a gallon, well that gallon should have gone for $0.60 a gallon in 1997 if Mr.Williams is right. I would have enjoyed milk at 60 cents a gallon. According to my historical reading at least of gasoline prices on the DoE site gas was $1.80 in 1997.
«If inflation “has been going at 10% for some time” and the current price of gasoline is , assume $3.61, then the 1997 price (which is when Williams says the great change occurred) was $0.72 a gallon.»
This sounds to me like a comment of consummate stupidity if not malice. A statement about the inflation rate is not that *every* price has been going up at 10%, but some *weighted* average of prices has been going up at 10%.
I am pretty sure that ShadowStats can find a somewhat but not wholly implausible weighted average of prices that has been going up at 10% for the past 17 years, The question is really whether that would somewhat representative of what common people call “inflation” (the two definitions of “inflation” used by “aligned” Economists are completely different from that used by common people).
I don’t believe the ShadowStats estimate that the cost of living of middle income (let’s say around $50k/y) families has been rising by 10% a year since 1997, buy I don’t believe the official CPI either according to which “inflation” as cleverly defined by the BLS has incrased at 2.3% since 1997:
http://research.stlouisfed.org/fred2/data/CPIAUCNS.txt
«According to my historical reading at least of gasoline prices on the DoE site gas was $1.80 in 1997.»
If you base your “inflation” definition on price of petrol between 1997 and 2014, in those 17 years average yearly inflation has been 4.2%. Probably a lot closer to what living costs of middle income families have been increasing at.
As to the value of disaggregation, Larry Summers, him most “aligned” of Economists, reports that some important prices have been booming (to use a “positive” word), and that some other prices have been “energetically” managed by the Statisticians:
http://conversableeconomist.blogspot.co.uk/2014/01/larry-summers-who-always-has-something.html
If you look at the table of breakdown of prices it is quite interesting. Looking at “managed” (if one does not want to hear “LIBOR’ized”) averages/indices/aggregates is not that informative anymore 🙂
bliss
“I am pretty sure that ShadowStats can find a somewhat but not wholly implausible weighted average of prices that has been going up at 10% for the past 17 years, ”
if they could actually do that, they would and subsequently remove the criticism targeted their way. but they have been unable to do this-hence the ridicule.
«“I am pretty sure that ShadowStats can find a somewhat but not wholly implausible weighted average of prices that has been going up at 10% for the past 17 years, ”
if they could actually do that, they would and subsequently remove the criticism targeted their way. but they have been unable to do this-hence the ridicule.»
Well, the table that Larry Summers pointed at:
http://2.bp.blogspot.com/-RsaSuH9KIuw/UtSv9The7jI/AAAAAAAAEgA/HrGHPrDEHEY/s1600/summers+1.jpg
could be a starting point. But my impression is that ShadowStats are just lazy, or underfunded; as in they don’t seem to recompute the index from the BLS raw data either (without hedonics, substitution, geometrical mean, chanining, and whatever else in various countries has been used), so my impression is that they wouldn’t rather than couldn’t.
But ShadowStats are *mostly* right: their final numbers are «probably excessive»; but their premises are quite agreeable as to the points they make on methodology changes for the price indices being suspicious, and suspiciously nearly always in the “oops we were overestimating inflation previously”. And it did not start in 1997, but around 1967 IIRC.
And even they have not reported the massive “massaging” of the nominal GDP, which instead seems to be common knowledge, as Stiglitz was mentioning some obvious issues as if they there well known among experts.
Note: there is always the possibility that ShadowStats is a “false flag” operation, where they take a real issue and exaggerate it to taint it with ridicule, but overall I think that’s unlikely.
The key to the “massaging”/”LIBOR’ing” of both price indices and GDP stats is that it cannot be called fraud because it is fully disclosed in the methodology notes, but it is has the same effect as fraud on public discourse because very few people notice it. Whoever from the “sell-side” wants to draw attention to the small print?
Note: when I say “sell-side” that may mean in general the boosterim/shysterism/dissembling associated with promoters, but also more specifically. Because the motivation for governments, and in particular the USA government and “aligned” Economists and Central Bankers, to do “sell-side” “massaging” of price index and nominal GDP numbers has a lot to do specifically with stock market valuation: the higher the better in part because it is used as collateral, in part because of pensions.
There are gigantic holes in the balance sheets of USA finance corporations and pensions funds that can only be plugged (even if only formally) by ever increasing stock market valuations (and ever lower wages…).
Therefore for example pumping up share prices is one of the dual mandates of the Fed Reserve Board along with boosting the profits of banks, and price index and nominal GDP “massaging”/”LIBOR’ing” helps with both.
«“I am pretty sure that ShadowStats can find a somewhat but not wholly implausible weighted average of prices that has been going up at 10% for the past 17 years, ”
if they could actually do that, they would and subsequently remove the criticism targeted their way. but they have been unable to do this-hence the ridicule.»
Another random data point, about England/UK in 2008, just before the bubble ended:
«Sir Stuart Rose, who as chairman of M&S could be described as the voice of Middle England, says that the real inflation rate is around eight per cent, while pay rises are closer to three.»
At that point the official CPI was 3%, and the RPI, a more reliable index, was around 5%. It is hard to see how inflation rates in the UK and the USA could be vastly different, given how in synch their economies are. But UK national statistics are somewhat less “massaged”/”LIBOR’ed” (ironically) than USA ones.
The result is that it is widely acknowledged in the UK that *median* wages there have fallen in real terms by around 20% (probably an understatement) in the past few years, as inflations rates of around 4-5% have overcome pay rise rates of 0-1%.
Sorry, $1.30 a gallon in 1997.
«the current price of gasoline is , assume $3.61,»
«$1.30 a gallon in 1997.»
Then you have debunked the BLS CPI even more obviously! 🙂 Because that portends an average yearly “inflation” rate of 6.3% per year which almost exactly midway between the 2.3% from the BLS and the 10% from ShadowStats.
But however funny your debunking is :-), “managing”/”LIBOR’ing” the inflation indice(s) is only one issue.
The much bigger one is the amazing series of metholodogical changes (“management”/”LIBOR’ization”) of the nominal GDP, and the overall seriously deep question of how to define and measure the value added of the service (and government) sector, a question that could perhaps be answered with “LA LA LA!” when services and government accounted for 20% of GDP and employment, but now now that they account for 80%.
I’m not an economist, but my take away is that Roberts et al have a simple proposition: the “market” or “investors” don’t properly price inflation into bonds
that is all
btw, the truth of this doesn’t depend on the validity of shadowstats
PS: you want to convince ordinary people that shadow stati is totally bougs ?
all you need is prices for milk and bread for the last 15 years, and a simple table showing the shadow stats prediction
I’ve never seen this
PPS: you know how you don’t need to pay attention to Roberts ? he posts regularly on http://www.counterpunch.org; anyone who would lower themselves to allow their work to be published there is someone you can safely ignore (take that cockburn – when you died, I asked the counterpunch people if they wanted a special issue of cockburn putdowns, which would be appropriate, since you pee on everyone else’s grave)
«don’t properly price inflation into bonds that is all»
But the key is how “inflation” is defined, because it is always a weighted average of a finite basket. The “inflation” on the basket that defines the standard of living of bond investors is not necessarily the same “inflation” on the basket that defined the standard of living of low income and middle income wage earners, which is what ShadowStats is interested in.
For example: the standard of living of bond investors depends a lot more on the price of labor (gardeners, cooks, maids, nurses, drivers, accountants, guards, secretaries) than that of low to middle income wage earners (babysitters mostly…).
As to bond investors, they seem to be pricing in on the positive side unlimited bailouts by central banks in case of “systemic” bankruptcies; that is they know that bond issues of small-enough-to-fail corporates may be left to wither, but central banks will (as long as they can) bail out investors in bonds of too-big-to-fail corporates, or when there is a general drop in bond (or stock or property) prices, because central banks cannot afford to let materialize counterparty or collateral risk.
«btw, the truth of this doesn’t depend on the validity of shadowstats»
Because “inflation” is different for different lifestyles… Also, “sell-side” economists love to dissemble on that they mean by “inflation”, see for example Friedman’s prescriptive definition of “inflation” and MIT’s “Billion prices project”.
«PS: you want to convince ordinary people that shadow stati is totally bougs ?
all you need is prices for milk and bread for the last 15 years, and a simple table showing the shadow stats prediction»
That’s a very strange and unrealistic “inflation” basket to choose for a first-world country. Also ShadowStats don’t make predictions, but statistics about the past. Anyhow on bread and milk retail prices probably “inflation” has been a lot closer to ShadowStats 8-10% than government’s 2-3%, for many years.