Chapters 1 and 2 of the IMF World Economic Outlook were released today.
Lots of useful data regarding the global economy (Chapter 1), as well as regional prospects (Chapter 2).
One interesting graph pertains to estimates of currency misalignments.
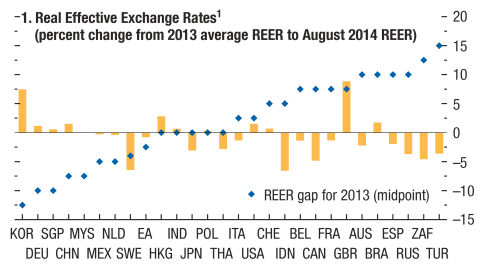
Figure 1.10 IMF WEO October 2014.
See more on the methodology here. The US estimates are of relevance given recent discussion of the dollar’s recent strengthening.
See also material on recent housing price trends (in Chapter 1, by Prakash Loungani), and spillover effects of changes in US yields (at the end of Chapter 2).
Every country in the world have similar headlines: IMF downgrades global growth forecasts
There has been more massive “demand” pumping than ever before in the history of the world. If this is not clear evidence of failure, what is?
Ricardo: It would be nice if you supported your assertions with data that supported your case. Like before and after the austerity programs. Or do you expect anyone to believe you based on your assertions alone?
poppycock. global growth has been out of whack for 5 years and they basically have been cutting investment thus demand. the “global growth slowdown” story is a bore.
Readers:
The online WSJ reports that German factory output fell 4% for August the sharpest decline since 2009 and Germany “…may struggle to grow at all in the third quarter”. “The figures came a day after a surprise decline of 5.7% in manufacturing orders for August”. How do these economic updates perhaps change the IMF’s World Economic Outlook (pps. 2 & 67) that reports a real GDP projection for Germany of 1.4% for 2014 and 1.5% for 2015? In addition the possible Euro slowdown may slow the UK projections for 2014 real GDP increase of 3.2% and 2.7% for 2015. Today, at least, the markets seem to fear that the world economy may not grow as much as the IMF projects. Seems like it may not be the time for austerity as often warned by Prof. Chinn.
If slowing global growth means national higher US growth. Would it be worth it?
China Just Overtook The US As The World’s Largest Economy
Re: Net Oil Exports
When we calculate Global Net Exports of oil (GNE), we have to deal with total petroleum liquids + other liquids (EIA data base). I define GNE as the combined net exports from the top 33 net oil exporters in 2005. The EIA shows that GNE have been below the 2005 rate of 46 mbpd (million barrels per day) for 8 straight years, with GNE in 2013 falling to 43 mbpd.
While falling US liquids consumption (relative to 2005) and rising US oil production have lessened the demand for GNE (and had an effect on global crude oil prices), by definition, this had no (direct) impact on the supply of GNE, and the most recent EIA data show that the US is reliant on net crude oil imports for 44% of the crude oil processed daily in US refineries.
And while we have recently seen some signs of softening demand in China, the volume of GNE available to importers other than China & India fell from 41 mbpd in 2005 to 34 mbpd in 2013.
For more info, you can search for: Export Capacity Index.
Jeffrey,
Do you have a handy chart showing forecasted oil supply vs. oil demand for the next five to ten years, or should I look at the EIA website. It may be interesting to see what happens near term to oil company stock prices if oil prices decline.
Thanks