Lest people forget what happened in times past.
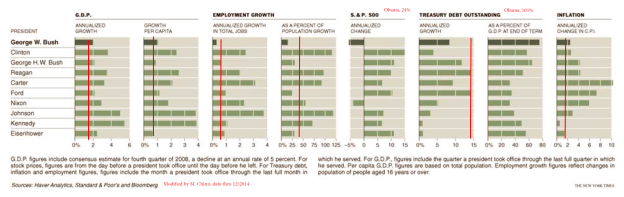
Chart from Floyd Norris, “Economic Setbacks That Define the Bush Years,” NYT, 24 January 2009, updated through 12/2014. Data for debt through 2014Q3. Red lines denote performance under Obama, through 2014Q4.
The original version of this graph was originally included in this post.
Since the graph assumed -5% growth in 2008Q4 (SAAR), rather than the actual -8% realized, the G.W. Bush era average growth rates should be slightly smaller than graphed.
Notice that a couple of series were off the charts, at least in the scales provided: the SP500 has risen by 24% annually on average over the last six years. Gross debt to GDP is 101% as of 2014Q3. Note that Federal debt held by the public as a share of GDP is 72.6%, down from a peak of 74% in 2014Q1.
Average growth and average per capita growth tend to be higher in Democratic administrations. Alan Blinder and Mark W. Watson investigate why, in this paper (discussed by Jim in this post). The authors conclude:
It seems we must look instead to several variables that are mostly “good luck.” Specifically, Democratic presidents have experienced, on average, better oil shocks than Republicans, a better legacy of (utilization-adjusted) productivity shocks, and more optimistic consumer expectations (as measured by the Michigan ICE).
One question that occurs to me: Why are economic actors more confident during Democratic administrations?
I wish people would grasp the fact that federal debt is not the only debt/gdp figure we have to worry about. Private debt/gdp is more meaningful in terms of “debt overhang” – a common worldwide issue of concern today. It’s a concern in the US mainly because the higher debt/income loads tend to be concentrated among lower-to- upper middle income families and small-medium size businesses.
It would have made a good addition to the NYT article because you’d see that the only administrations in the last 60+ years ( ! ) when the total public+private debt/gdp ratio rose ( meaningfully ) were Reagan/Bush I and Bush II. This chart shows the overall ratio in red in % of gdp ( right scale ) and in blue , the y-o-y growth of the ratio ( left scale ) :
http://research.stlouisfed.org/fred2/graph/?g=ZkV
Those periods of rising debt/gdp represent the very definition of an unsustainable growth process.
Wow. Great Chart Marko! This is something that should be discussed in more detail by the media and the econosphere.
If you like this type of data-driven comparison, take a look at “Presimetrics” by Kimel and Kanell.
It was published in 2010, so doesn’t include the Obama years, but covers presidental terms from
Eisenhower through G.W.Bush.
The book covers mostly economic issues, but also has chapters on Health Care, Crime, The Public Mood,
and Family Values.
Interesting reading.
Why Presidents? The president does not pass legislation, congress does especially the House. Also, why not all of the 20th Century.
But from this analysis it seems pretty clear that you would like to return to a Johnson-Carter presidency, DUH! This is what happens when Keynesian analysis weights government spending higher than productive businesses. Where does Stalin fit into this analysis? He worked an economic miracle in the Soviet Union, didn’t he?
“Why Presidents? The president does not pass legislation, congress does especially the House. Also, why not all of the 20th Century.”
The Blinder & Watson paper addresses this exact question quite clearly.
“Why Presidents? The president does not pass legislation, congress does especially the House. ”
ricardo, i expect from your statement from this point forward you will stop blaming obama for the economy, for good or bad?
“One question that occurs to me: Why are economic actors more confident during Democratic administrations?
As with most good questions, answering, brings forth other questions. Here are some of mine.
Is “economic actors more confident” an important statistic? I believe so, especially for elections. Then if so, why does the electorate pick a Republican after a Democratic President? Perhaps the confidence statistic changes toward the end of administrations, because of economic changes occurring as a result of that administration’s policy.
How can the change in the confidence statistic be checked? Perhaps directly by the poll of the number, but this may be difficult because of distortions due to the great increase in political misinformation from the political actors large spending because of the political election season.
I suggest an alternative look, not at the direct polling, but a second look at the statistics in the above chart of Floyd Norris. Compare the numbers generated by his selection of start end dates with a second chart using a start end date of the October 1 after an inauguration. This date is the first day of the first fiscal year which the President is responsible and the first opportunity to make a substantial change in policy. I expect in most cases, a substantial change in the numbers would be evident. And this change would explain better the decision of the electorate to change or not to change the political party of the President.
Ed
Ed, I believe Cactus/Kimel answered that question many times over during writing and discussion of his book, Presimetrics. IIRC, it did not change the results significantly.
Corev
I have not seen that book. But I am somewhat surprised at that finding. A quick look at some NEBR recession dates in relation to President inaugurations. I will see if my library can get it.
In relationship to start end dates at October 1
April 1960(II) – February 1961 (I) // Would put this entire recession and part of the recovery within Eisenhower’s responsibility. It would possibly show better economic results for Eisenhower and cetainly begin the Kennedy years at a higher economic start point.
November 1973(IV) – March 1975 (I) // Because of the unusual date of the end of the Nixon Presidency, August 9, 1974, so very close to the beginning of a new fiscal year, a good case can be made to assign the whole recession to him. Nixon would the get credit for some recovery and Ford would begin his responsibility at a higher economic point.
January 1980(I) – July 1980 (III) // This entire recession becomes Carter’s responsibility, possobly lowering his economic score. Regan would begin at a lower economic point and his score would increase.
March 2001(I) – November 2001 (IV) // Almost all this recession becomes Clinton’s responsibility. It would lower his overall economic score. Bush’s score would begin at a lower economic point.
December 2007 (IV) – June 2009 (II) // This places the entire recession under Bush’s responsibility as well as part of the recovery. I suspect it would have the effect of lowering Bush’s economic score and thus begin Obama’s presidency at a lower economic point.
By changing the dates of responsibility, the scores will change and answer some of the vagueness of ‘luck’.
Besides recessions, effects of the start end date change, depend on the slope of each economic statistic, but should have some effect.
Ed
Corev
What a difference a date makes. I make no assertion of a deep statistical analysis, in fact I made only one check for fun.
The statistics were readily available for S & P close, which is one of the categories of the Norris chart. So I checked against the Bush Presidency.
If you look at the chart, it shows an annualized change of the S & P of about -6.0% (actual S & P change of -492.43 points). Norris uses the date of 1/19/01 to 1/19/09, the days before inauguration.
Using the fiscal year dates of 10/01/01 and 10/01/09, the results are strikingly different. The actual S & P change is -8.7 points, about an annualized change of -0.1%.
Ed
There aren’t enough observations to make it statistically significant.
It may be coincidence, inheritance, and/or luck.
Yet, Keynesian economics has a positive effect on growth.
Democrat Presidents may spend and borrow more from the future causing faster growth in the current period.
Republican Presidents may spend and borrow less from the future causing slower growth in the current period.
And, I suspect, if Democrats had their way, taxes and regulations would be too high, and if Republicans had their way, taxes and regulations would be too low, influencing living standards, not necessarily captured or reflected in GDP and other economic data.
Your claims about borrowing and spending sound truthy, but are they?
The chart above shows that of the top five borrowing administrations, four are Republican administrations, and only one is Democratic.
As for spending growth, the inflation adjusted spending growth rates of each administration show that it’s a little less cut and dried: of the top five spending growth administrations, three were Democratic but two were Republican.
So I’m not sure how your premise holds up as a blanket statement.
CB, it’s likely, more spending takes place in recessions, whether there’s a Democrat or Republican President.
Here’s a table on annual (fiscal year) federal receipts and outlays:
http://www.taxpolicycenter.org/taxfacts/displayafact.cfm?Docid=200
Also, I may add, perhaps, Republican Congresses are more likely to constrain Democrat Administrations spending?
And, it should be noted, in economic expansions, tax revenues rise and spending on the unemployed falls.
CB is generous with “truthy”.
It is simply untrue that Republicans in general borrow and spend less. Not only that, but the chart offered above is pretty clear in making that point. Anyone, really, anyone who has paid any attention to economic policy knows that Reagan and Bush Jr. drove up the deficit greatly, even in times of expansion. Those who don’t bother to know the simplest facts, or pretend not to know facts i convenient to their own views, can’t be trusted to be part of an honest discussion.
macroduck, someone who doesn’t even know the difference between deficits and spending cannot be trusted.
Lower tax rates can reduce government revenues to increase budget deficits.
There should be another indicator on this list– the Federal budget as a share of GDP.
Since WW II every democratic administration left office with a smaller deficit than they inherited.
In contrast, every republican administration left office with a larger deficit than they inherited.
Spencer, your statement is misleading, e.g. for reasons I stated above.
For example, Wilson and Roosevelt – both Democrats – from the beginning to the end of their terms had much larger budget deficits / GDP, because of WWI and WWII (the largest by far in the 20th century).
Peak
Trader, you need to work on your reading skills. I specifically said since WWII so Wilson and Roosevelt are not included in the comparisons.
Spencer, you need to work on your reading skills. I specifically said:
“…e.g. for reasons I stated above,” which included “There aren’t enough observations (i.e. Presidential Administrations) to make it statistically significant.”
Moreover, I may add, magnitude can have similar importance as frequency, over time.
Peaky,
You have suggested that spencer has made a misleading statement. In doing so, you are dispicable and arrogant, both in one rhetorical gesture.
Spencer’s point is true. Pure and simple. Your objections may be worth considering, but only in a foot-note sort of way. You are pretending to have invalidated spencer’s point, but have done no such thing. The simple fact that you have made a point does not make that point important. There’s the arrogance. The dispicable part is that you’ve tried do discredit spencer – “misleading” – rather than debate him.
Analysis doesn’t stop just because of a limited sample. We can still exercise judgement even when we can’t make claims about statistical significance. The record spencer reports is a pure dichotomy, with all post-WWII Republican administrations on one side,all Democrats on the other. Falling back on sample size as an excuse for ignoring that stark fact is pathetic.
macroducky, you’re either incapable of understanding why his statement is misleading or want to remain ignorant.
For example, if tax rates were cut to zero, budget deficits would increase.
Making nonsense doesn’t help your case.
Spencer,
here is more fun with facts. Starting post WWII. All figures in million dollars. Thought you would enjoy but also learn.
Truman
previous fiscal year total outlays (1948)… $29,764 total surplus/(deficit)… $11,796 percent surplus/(deficit) of outlays… 39.6%
final fiscal year total outlays (1952)………. $76,101 total surplus/(deficit)… ($6,493) percent surplus/(deficit) of outlays… (8.5%)
Eisenhower
previous fiscal year total outlays (1952)… $76,101 total surplus/(deficit)… ($6,493) percent surplus/(deficit) of outlays… (8.5%)
final fiscal year total outlays (1960)………. $92,191 total surplus/(deficit)……… $301 percent surplus/(deficit) of outlays…. 0.3%
Kennedy
previous fiscal year total outlays (1960)… $92,191 total surplus/(deficit)……… $301 percent surplus/(deficit) of outlays…. 0.3%
final fiscal year total outlays (1963)………. $111,316 total surplus/(deficit)… ($4,756) percent surplus/(deficit) of outlays…. (4.3%)
Johnson
previous fiscal year total outlays (1963)… $111,316 total surplus/(deficit)… ($4,756) percent surplus/(deficit) of outlays……. (4.3%)
final fiscal year total outlays (1968)………. $178,134 total surplus/(deficit)… ($25,161) percent surplus/(deficit) of outlays…. (14.1%)
Nixon
previous fiscal year total outlays (1968)… $178,134 total surplus/(deficit)… ($25,161) percent surplus/(deficit) of outlays…. (14.1%)
final fiscal year total outlays (1974)………. $269,359 total surplus/(deficit)… ($6,135) percent surplus/(deficit) of outlays……. (2.3%)
Ford
previous fiscal year total outlays (1974)… $269,359 total surplus/(deficit)… ($6,135) percent surplus/(deficit) of outlays……. (2.3%)
final fiscal year total outlays (1976)………. $371,792 total surplus/(deficit)… ($73,732) percent surplus/(deficit) of outlays……(19.8%)
Carter
previous fiscal year total outlays (1976)… $371,792 total surplus/(deficit)… ($73,732) percent surplus/(deficit) of outlays……(19.8%)
final fiscal year total outlays (1980)………. $590,941 total surplus/(deficit)… ($73,830) percent surplus/(deficit) of outlays……(12.5%)
Reagan
previous fiscal year total outlays (1980)… $590,941 total surplus/(deficit)… ($73,830) percent surplus/(deficit) of outlays……(12.5%)
final fiscal year total outlays (1988)………. $1,064,416 total surplus/(deficit)… ($155,178) percent surplus/(deficit) of outlays……(14.6%)
Bush I
previous fiscal year total outlays (1988)… $1,064,416 total surplus/(deficit)… ($155,178) percent surplus/(deficit) of outlays……(14.6%)
final fiscal year total outlays (1992)……….. $1,381,529 total surplus/(deficit)… ($290,321) percent surplus/(deficit) of outlays……(21.0%)
Clinton
previous fiscal year total outlays (1992)… $1,381,529 total surplus/(deficit)… ($290,321) percent surplus/(deficit) of outlays……(21.0%)
final fiscal year total outlays (2000)……….. $1,788,950 total surplus/(deficit)… $236,241 percent surplus/(deficit) of outlays……..13.2%
Bush II
previous fiscal year total outlays (2000)… $1,788,950 total surplus/(deficit)… $236,241 percent surplus/(deficit) of outlays……13.2%
final fiscal year total outlays (2008)……….. $2,982,544 total surplus/(deficit)…($458,553) percent surplus/(deficit) of outlays……(15.4%)
So.
Democrat Truman’s post WWII ended with a higher deficit. (very, very, large change)
Republican Eisenhower ended with a less deficit (actually a surplus). (Large change)
Democrat Kennedy ended with a higher deficit. (moderate change)
Democrat Johnson ended with a higher deficit. (large change)
Republican Nixon ended with a lesser deficit. (large change)
Republican Ford ended with a higher deficit. (very large change)
Democrat Carter ended with a lesser deficit. (moderate change)
Republican Reagan ended with a higher deficit. (moderate change)
Bush I ended with a greater deficit. (moderate change)
Clinton ended with a lesser deficit (in fact a surplus) (very, very, large change)
Bush II ended with a greater deficit. (very, very large change)
So the scorecard is, since WWII, there has been 5 Democrat Presidents of which 3 ended with larger deficits. There has been 6 Republican Presidents of which 4 ended with larger deficits. 3 of 5, 4 of 6, turns out not much difference and deficit control is alone nothing to hang your hat on.
The statistics in this post were found in the “Historical tables Budget of the U.S. government”. If you click on it be aware this is a huge PDF file, but seems well behaved, it did not crash my ancient computer.
Ed
Menzie:
“One question that occurs to me: Why are economic actors more confident during Democratic administrations?”
Another question (if I’m correctly reading the work by Blinder & Watson) is why don’t economic actors maintain confidence during Democratic administrations? I’m wondering if this is due to the assumption that Democratic administrations are more likely to be based of off ‘change’ or ‘progressive’ ideologies whereas much of the public view Republicans as status quo (this of course is my perception.) In the case of the Democrats, after a few years in office, maybe it is at this point the public’s confidence wains a bit as reality sets in. Could this be due to the public’s realization that the promise of ‘change’ was merely a platform to garner votes, or even a false assumption on the part of the electorate? In the case of the Republicans, there never seems to be much confidence in the sense of ‘change’ – it’s just follow the (possibly dead) leader.
Obviously this is anecdotal. However, I would love to hear insights from others (with a bit more age) with regards to the perception of change, etc… from some of the earlier administrations.
Wouldn’t the oil-price shocks, or the direction and magnitude of oil price changes generally, have a large effect on economic-actor expectations?
About Presidents: I think presidential elections are mostly “beauty contests” so if one party’s sociopath is better looking, you define better looking, than the other they win. Then again I remember the Nixon Years. MMMMMM?
Scott Sumner does a good job of describing Keynesian forecasts about the sequester “austerity” and the forecasts after the 2009 stimulus spending.
Here is the MANHATTAN CONTRARIAN’s take on Keynesian forecasts.
Scott Summer actually did a miserable job of analyzing Keynesian predictions.
He found one outlier forecast and claim it was every Keynesian forecast.
The actual forecast of the overwhelming majority of Keynesian and financial market forecasts for five years has consistently been that we are on the verge of an acceleration of growth. Moreover they took the stronger growth in second and third quarter 2014 as the start of a trend of stronger growth. But fourth quarter to fourth
quarter growth in 2014 turned out to be only about 2.5%and the year over year was 2.4%.
TdK,
In another thread you asked, <b<“If history cannot be used to prove or disprove an economic theory then how does one know that it is a properly thought out theory?” My answer is making forecasts on current data will give you the answer. The Keynesian forecasts and results of the 2009 stimulus versus the Keynesian forecasts of the 2012 Sequester are a great example.
I posted a link to Scott Sumner’s article above. I should have also posted a link to the MANHATTAN CONTRARIAN. < ahref="http://manhattancontrarian.com/blog/2015/2/3/how-stupid-are-our-economic-forecasters"Here it is.
SPENCER,
Sumner’s “outlier forecast,” as you call it, was from the CBO, and it was two forecasts not one, the “stimulus” and the “sequester.”
Ricardo you would like to return to a Johnson-Carter presidency,
Well, yes. Especially LBJ. Full disclosure: I am part of the LBJ clan.
Where does Stalin fit into this analysis? He worked an economic miracle in the Soviet Union, didn’t he?
Not that I’m aware of, but maybe you read different history books than I do. In any event, comparing LBJ to Stalin is a little over the top. Somehow I have a hard time picturing Uncle Joe signing a civil rights bill, or a voting rights act, or fighting a war on poverty. And I really can’t imagine Stalin visibly agonizing over the deaths he caused in a far off war. Maybe you meant to compare Nixon to Stalin. BTW, I’ll bet you voted for Tricky Dick both times. Am I right?
And your quoting the Manhattan Contrarian: In Keynesian world, the size of a government’s fiscal budget surplus or deficit is thought to determine the degree to which the government is giving “stimulus” to its economy
Maybe you and the Contrarian should first read a Keynesian textbook. I’ve read quite a few and I don’t recall that the fiscal multiplier was a function of the size of a budget surplus or deficit. Every book I’ve ever read always has this little triangle representing the change in government spending or taxes. Understand the difference?
I don’t think you’re one to talk about forecasts. You completely blew it on your inflation forecasts. Or did you forget about all those “Zimbabwe Ben” remarks and appeals to shadowstats? But perhaps you would like to explain how those of us who argued that the 2009 stimulus was better than nothing, but not nearly large enough to do the job. Just how were we wrong?
Slug,
I believe you when you say you liked Johnson and Carter. If you liked them you just love, love, love Obama.
You apparently have not read man of my posts here. Richard Nixon was one of the top five worst presidents our country has had. He expanded almost every one of Johnson’s Great Society programs. He is responsible for the HMO fiasco and a whole host of three letter bureaucracies. He took the country off of gold and ushered in the worst inflation extended inflation our country has ever experienced. Remember “I am a Keynesian now?” As a matter of fact I do not know of any policy of Nixon that I would support.
But the funny thing is that with you singing the praises of Johnson and Carter, I do not know of one Nixon policy that you would not embrace. Could you mention one (other than Watergate, which was not a policy).
I was not aware that the taunt common among grade-schoolers – “you LOVE him!” – was also a valid form of analysis. “If you liked them you just love, love, love Obama.” What, exactly, does that have to do with actual economic performance under various presidential administrations? I understand that goading one’s opponent into defending a position not his own is a useful debating trick, but what does Slugger’s view of Obama have to do with the topic at hand? Seems to me you’re trying to get us off topic – no surprise, given that the facts do seem to line up fairly strongly against your position.