The Bureau of Economic Analysis announced yesterday that U.S. real GDP grew at a 2.6% annual rate in the third quarter. Even factoring in the dismal start to the year, that leaves full-year GDP growth during 2014 at 2.4% (the best annual performance since 2010) and growth at an annual rate of 4% over the last 9 months.
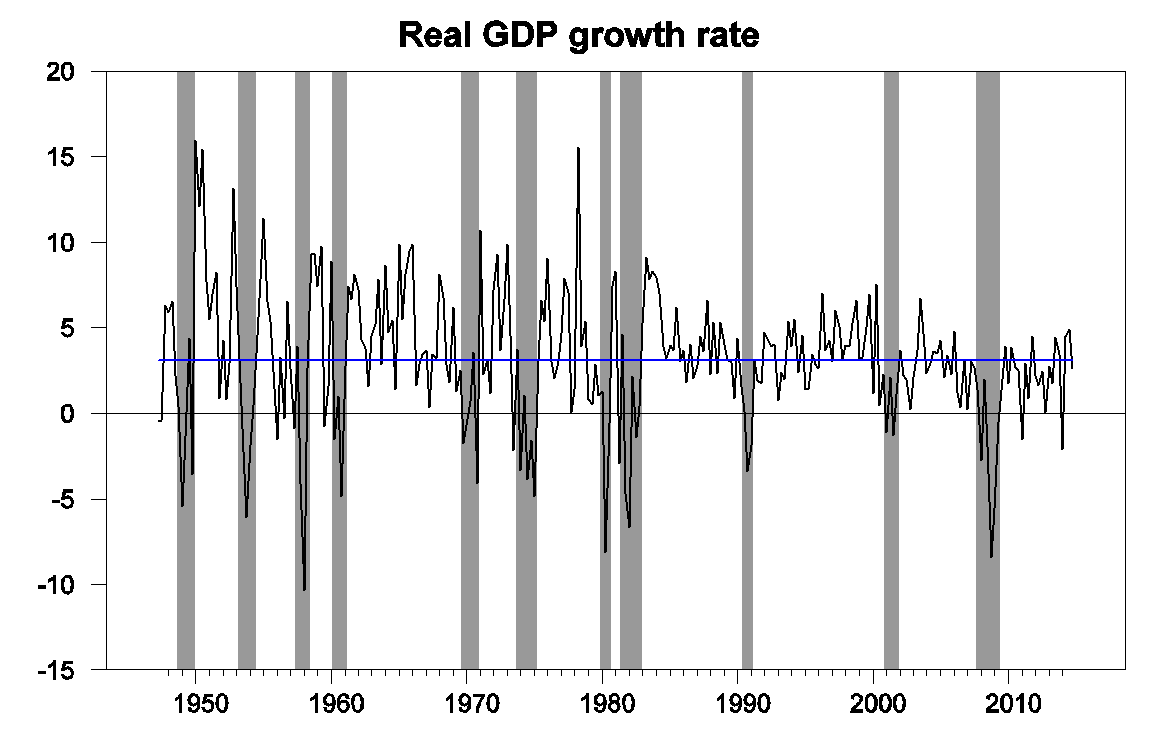
U.S. real GDP growth at an annual rate, 1947:Q2-2014:Q4. Blue horizontal line is drawn at the historical average (3.1%).
Government spending had contributed 0.8 percentage points to the Q3 growth but subtracted 0.4 percentage points from Q4. Most of that swing can be attributed to a one-time bulge in defense spending in Q3. But the biggest reason for slower GDP growth in Q4 than in Q3 was the fact that real imports grew by 8.5% (at a continuously compounded rate) in the fourth quarter. Since imports are subtracted from GDP, more imports mean less GDP.
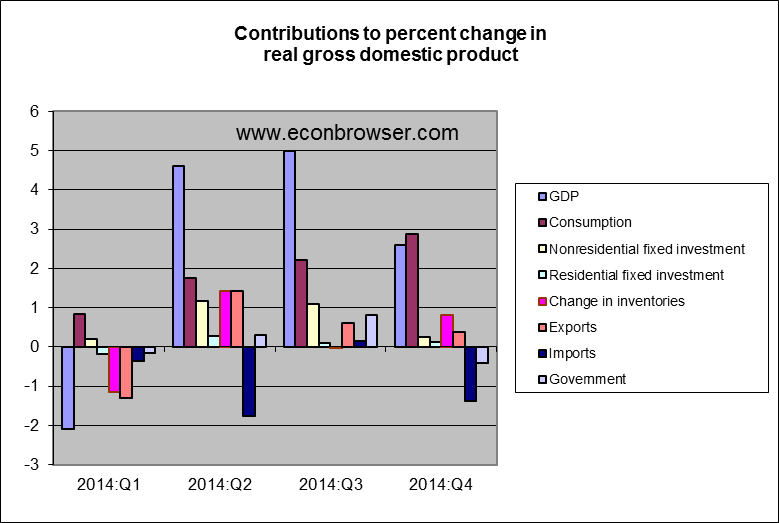
It’s worth noting that although real imports increased by 8.5% at an annual rate, the nominal value (that is, the actual number of dollars spent on imports) was only up 0.9% at an annual rate. The big story was not simply that we’re importing more barrels of oil than expected for this time of year, but that each barrel of imported oil cost us fewer dollars. That means that the apparent surge in real imports is less of a long-run burden for the U.S. than might appear at first glance from the data, and the underlying situation is reasonably healthy.
Fixed investment remains disappointing. But as Bill McBride notes, there’s still lots of room for growth there and reasonable basis for expecting it’s still to come. Residential fixed investment is still way below normal when expressed as a percentage of GDP– added confirmation of Reinhart and Rogoff’s observation that recovery from an event like the U.S. has gone through takes a long time. Once housing makes a decent recovery, we might expect business plant and equipment and structures to follow.
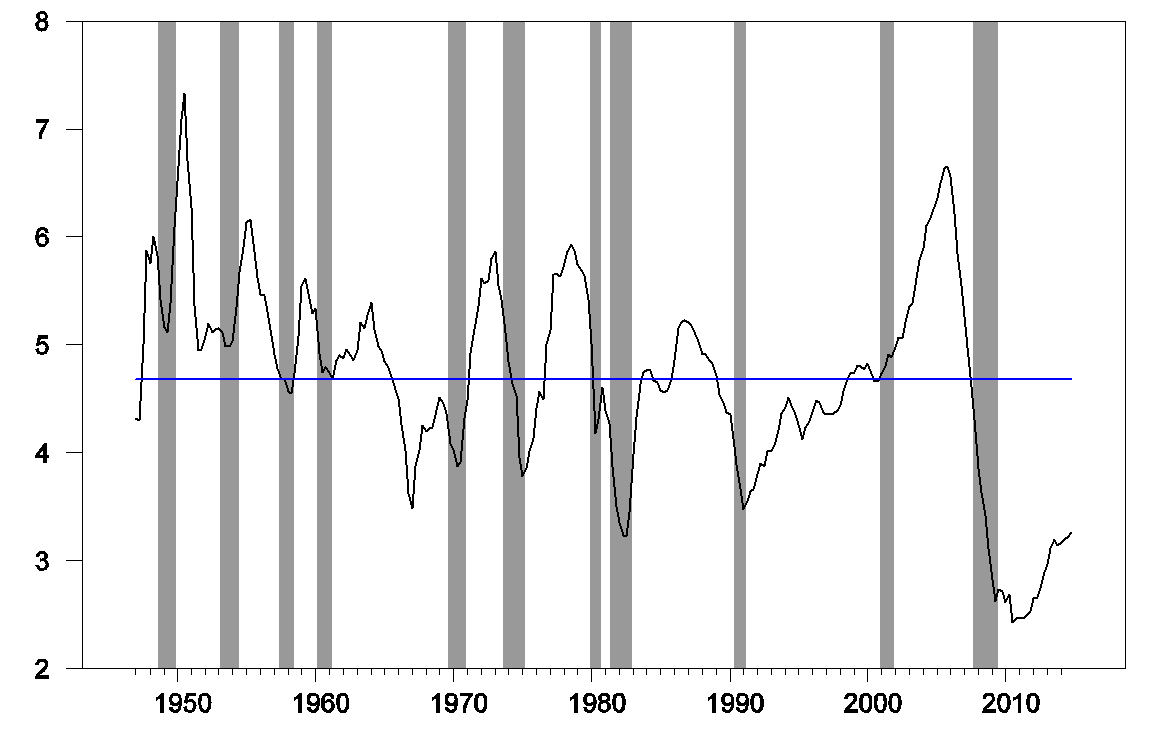
Residential fixed investment as a percentage of GDP. Blue horizontal line is drawn at the historical average (4.68%).
Our Econbrowser Recession Indicator Index, which uses ysterday’s data release to form a picture of where the economy stood as of the end of 2014:Q3, is now all the way down to 1.6%, an unambiguous signal of an ongoing recovery.
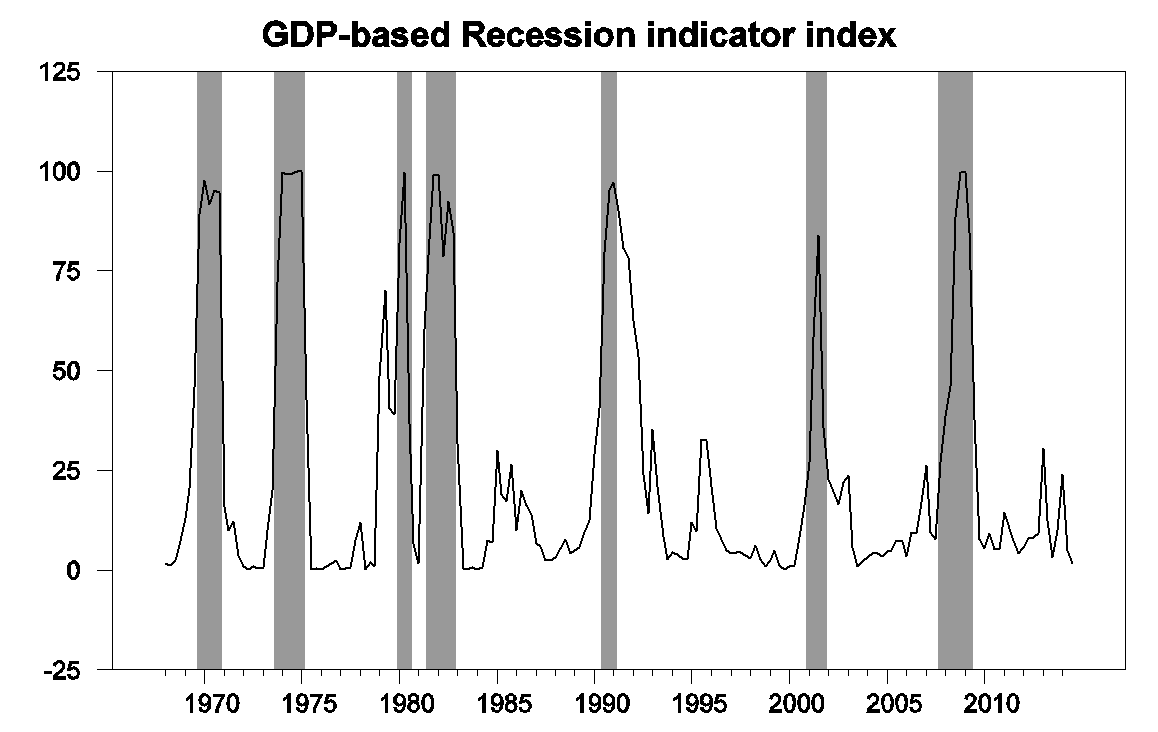
GDP-based recession indicator index. The plotted value for each date is based solely on information as it would have been publicly available and reported as of one quarter after the indicated date, with 2014:Q3 the last date shown on the graph. Shaded regions represent the NBER’s dates for recessions, which dates were not used in any way in constructing the index, and which were sometimes not reported until two years after the date.
All of which is keeping our Little Econ Watcher happy.
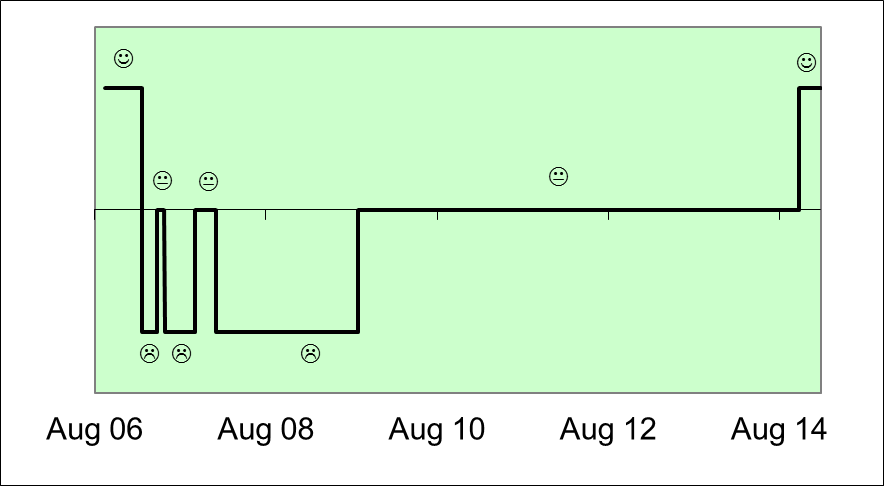
I don’t see either a strong or weak report here. I still think the blasé face would be more appropriate.
This is only a demand-side report. It shows overall growth slightly accelerated in 2014, but net exports deteriorated sharply, which was compensated for less reduction of public final spending. Net exports contributed 0.22 pps to 2013 growth but took away 0.22 pps from 2014 growth. Public final spending took away 0.39 pps from 2013 growth but only 0.03 pps from 2014 growth.
The data don’t at all support a thesis that housing investment is poised to revert to the pre-crisis mean, or that residential investment will drive non-residential. They moved in opposite directions in 2014, with residential investment growth plummeting from 11.9% to 1.6% while nonresidential rebounded from 3% to 6%. I don’t see residential re-accelerating this year, and nonresidential is likely to slow in the first half from weaker resources-related investment.
The Krugman story that we stopped whacking ourselves in the head with austerity and so we feel better may be true to some extent for living standards, but not in terms of growth, as we reallocated to imports (in real terms). Likewise, to get that promised growth impulse from cheaper oil, we need to see marginal spending power allocated to something other than imports.
It’s also worth remembering that part of the reason for the weak federal final spending line is not austerity per se, but a shift from final spending to transfers, driven mainly by aging. That part continues.
😀
“Our Econbrowser Recession Indicator Index, which uses yesterday’s data release to form a picture of where the economy stood as of the end of 2014:Q3, is now all the way down to 1.6%, an unambiguous signal of an ongoing recovery.”
If you had been using this indicator in 2000 , might you have said something like : “Stock prices have reached what looks like a permanently high plateau.” ? The transition from unambiguous to ambiguous was pretty abrupt after 2006 as well , just prior to an unambiguous catastrophe.
I’d like to see someone come up with an indicator that can measure the sustainability of a recovery over the medium-to-long term. For stock traders , your indicator telling us the economy is not likely to tank in the next quarter might have some limited value , but for people who are trying to decide whether it’s safe to start living normally again vs. continuing to hunker down , it’s pretty much worthless.
That Obamacare is really killing the economy.
Consumption increased over those four quarters, e.g. because of faster job growth and falling oil prices.
Of course, lower oil prices benefit lower income consumers the most, who also have the highest marginal propensities to consume.
Precisely.
I’d be surprised if this isn’t a worldwide phenomenon , at least in countries with severe levels of income inequality , like the US.
This should serve as an indicator for the increased consumption one could expect from more progressive income and wealth tax regimes – much higher rates on the very top , lower on the middle and below. Also , minimum wage increases , etc.
In a ZLB , deflationary , debt-saturated , demand-constrained global economy , this should be obvious to policymakers everywhere. Instead , we get QE-to-infinity , further enriching the already rich. Don’t worry , say the economists , consumers don’t need income to consume. When interest rates are negative enough ( -1% ? , -10% ? , – 100% ? ) , they’ll simply borrow and consume.
Brilliant , economists. Just brilliant.
Actually no. Household consumption grew 2.5% in 2014, 2.4% in 2013. That’s a smaller difference than the standard noise range even for annual data.
In a nutshell, as relief from austerity boosted the pace of real income growth in 2014, the marginal extra real income was allocated to faster import growth. Overall real GDP growth held roughly stable.
That’s it. Not much else really changed for the economy in 2014 from 2013. The pace of private consumption growth did not significantly change. The pace of private investment growth did not significantly change, though the composition changed from homes to businesses.
It’s a good bet that household consumption growth will accelerate this year thanks to the oil price collapse, but nothing we’ve seen so far points to the extra real income being spent on domestic products.
Tom, at this point in the expansion, even more government life support (than the economy is already getting) won’t benefit U.S. households more than higher job growth and lower oil prices.
U.S. consumer spending in December weakest since 2009
Feb 2, 2015
“The Commerce Department said consumer spending, which accounts for more than two-thirds of U.S. economic activity, fell 0.3 percent after gaining 0.5 percent in November and 0.3 percent in October.
The drop, the largest since September 2009, reflected a decline in spending at service stations as gasoline prices fell, as well as weak auto receipts and weather-related softness in demand for utilities.
The spending data was included in Friday’s fourth-quarter gross domestic product report, which showed the economy growing at a 2.6 percent annual pace, with consumer spending rising at a brisk 4.3 percent rate – the fastest since 2006.
In another good omen for consumer spending, income at the disposal of households after inflation recorded its largest gain since last March, while the saving rate hit a five-month high.”
http://www.reuters.com/article/2015/02/02/usa-economy-idUSL1N0VC0OK20150202
if it’s worth noting that although real imports increased by 8.5% at an annual rate, the nominal value (that is, the actual number of dollars spent on imports) was only up 0.9% at an annual rate, then it’s worth noting that even though exports fell from $2,366.5 billion to $2,341 in dollars, real exports are recorded growing at a 2.8% rate, because the deflator for goods exports was at a negative 9.4%…
Right, I didn’t spell that out but it’s why I mentioned that the re-allocation to imports is in real terms. Which is what a strengthening dollar does.
The relevant perspective for businesses and investors who need to make real world decisions in a world of uncertainty extends far beyond last quarter. US debt-to-GDP is not far off its historic peak. That puts it far beyond optimal. Globally, the burden of debt has never been higher. The US is running budget and trade deficits. Net national saving since the crisis is lowest since the Great Depression. The housing market is in a modest bubble. The stock market is in a gigantic bubble. The 10-year trailing S&P PE ratio has been higher only a few times in history. Each culminated in a devastating bear market. Asset markets around the world are in bubbles. Yields are artificially depressed in a way never before experienced. The interest-sensitive arm of the market has been twisted out of joint. The Fed did not allow the recession to fully cleanse the economy of the malinvestment that accrued in the heady days of the Greenspan-Bernanke put prior to the crisis. Over the past 5 years, ZIRP and QE laid down a fresh new layer. Global investors, fed one QE after another like a Christmas goose, are on a quest for yield that has flatten risk premiums to nonsensical levels. In the current environment, this is an unmistakable sign that systemic risk is on the rise. NIPA is silent on the balance sheet consequences.
The US locomotive of the past 5 years – fracking production – is slowing and only months away from going into reverse. China, the locomotive of the global recovery, will slow much further. From 10% on its way to 4. As credit decelerates, China will surely experience a hard landing that will shake foundations. The eurozone is on the verge of a triple-dip recession. Syriza in Greece is the first-ever eurozone government with the common sense, courage, drive, and support of its citizens to take the anti-austerity battle to Brussels. The troika is staring at the beginning of its end. Euro-skepticism is on an exponential rise. Spain is next to change governments with general elections this year. This spells bank runs. Nearly 8 years later, the Stoxx bank index of the largest economy in the world is barely a third of its 2007 peak. And it’s been slowly rolling over the past year. Physical gold is flowing to Asia. Much of the rest of the world outside the US and Europe is fed up with US hegemony and the dollar as reserve currency. Amidst all its other troubles, having just become a trade deficit nation Japan is flailing about setting off destabilizing currency wars. Labor force participation in the US is on a downward trajectory. The implication is fewer workers to support the ever-expanding welfare class whose hands are out for a dole. Global elites are about to level another blow to the US middle class with the secretive (why?) Trans-Pacific partnership that will be every bit as pernicious to middle class workers as was NAFTA. The unintended consequences of ZIRP and QE have only begun to reveal themselves with the first signs in the oil patch.
These factors – most of which lie in the unexplored region of the Solow growth model which is deafeningly silent on the matter of prudent finance and sound balance sheet – are chiseling away at potential. The rope is being further frayed by the less perceptible, though still quite corrosive, acid-etching-away of potential by declining work ethic, falling test scores, stranglehold student debt incurred for increasingly worthless degrees, shrinking entrepreneurship, rising obesity, rising health care costs, increasing claims for disability, baby boom demographics, lopsided cost-over-benefit government regulation, diminishing faith in the political class, and so on and on. It speaks volumes that not one indictment was handed down for corrupt activity in the revolving door nexus of big banks, government regulators, politicians and officials. No longer an iota of difference between the two parties. The same vested interests rule both. This is not the America of the pre-Fed, pre-fiat era. We are in an epochal Era of Debt. With it will come sequentially greater financial crises. That’s a hard and fast prediction. It will be decades before the good times roll. In fact, they may never.
Well said, JBH.
I suspect that most economists will be quite surprised by how quickly the US economy decelerates hereafter as a result of the energy sector bust, which, along with the energy-related transport sector, was overwhelmingly disproportionately skewing higher to an unsustainable rate the growth of industrial production and truck and rail transport since 2011-12.
Because of the nature of the faster rate of decline in the rate of shale extraction than conventional crude oil, the decline in US oil production by 3Mbd+ over the next 2-3 years and proportional decline in oil consumption of 2Mbd or more will catch most economists by surprise (at least publicly).
Real non-residential investment to real private GDP is decelerating to the rate the Fed went “all in” with QEternity and at the rate of the onset of the recessions in 2008 and 2001.
Moreover, China’s industrial sector is contracting, and the labor force and FDI are barely growing, if at all. The implicit FDI multipliers to investment, production, and exports with the industrial sector contracting suggest that China’s economy is growing no faster than 3-3.5% and 3% or slower real per capita. Moreover, China’s M3 is growing at such a rapid rate to GDP to imply velocity is in in collapse, increasing the probability of debt/asset, price, and wage deflation and a deflationary contraction hereafter. China is now at the point of experiencing peak demographic drag effects into the mid-2020s as Japan has experienced since 1998 and the US since 2006-07.
The global structural constraints per capita resulting from population overshoot, Peak Oil, peak demographics, “Limits to Growth”, debt and asset bubbles to wages and GDP, and wealth and income inequality are now fully and cumulatively entrained and will exert increasing drag effects on oil and food production, real GDP per capita, gov’t receipts and spending, and the 10-year rate of world population growth (which will achieve a first-order exponential decay by the early 2020s from the peak in the 1970s, implying population peak in the 2020s and decline by the 2030s), precluding growth of real GDP per capita, and certainly no acceleration, i.e., “escape velocity”.
The post-WW II and peak Oil Age epoch’s real growth of global GDP per capita is over. Unfortunately, there is yet no emerging alternative model to the oil-, auto-, debt-, and suburban housing-based model to permit us collectively to easily transition to the post-Oil Age epoch.
jonathan,
Obamacare has been postponed. The business implementation is the largest and potentially the most devastating and President Obama’s people know that.
The CBO told us that each person who got health care under Obamacare cost $50,000. This was not reported in the US press by you can read about it in the Daily Mail report out of the UK. This was reported in some online services you probably did not read them.
But something that was not in the Daily Mail headline did not get publication in the US is that the CBO forecasts that by 2025 there will be 24 million to 27 million fewer Americans insured. If the law is implemented as the law states – a very doubtful event given past administration actions – CBO estimates 29 million to 31 million non-elderly, don’t miss that “NON-ELDERLY,” without medical insurance. This is horrible when you recall that the whole Obamacare mess was started because about 3 million were uninsured.
So, Obamacare is not currently killing the economy because Obamacare is not being implemented. Of course that won’t make all those people who will get a higher income tax bill because of their Obamacare penalties a lot happier.
Ricardo: “The CBO told us that each person who got health care under Obamacare cost $50,000. “
Ha, that article is hilarious click bait for innumerates like Ricardo. According to the numbers in the article cited (which I don’t vouch for), that cost is over 10 years, so $5000 per person per year, which is about right for individual insurance.
As for 27 million fewer insured, that is not what the CBO projects at all. The CBO projects a reduction of 27 million uninsured. If you look at the CBO report there is a minus sign in front of the number of uninsured, indicating a reduction.
The rank stupidity and innumeracy of conservatives is simply astounding.
Joseph, note that total “dis-ease care” spending per capita in the US is now $10,000 (same per household for student loans outstanding, BTW).
Spending for “dis-ease care” is $26,000 per household, which is about half the median household income, the average wage and salary income of the bottom 80% of employed Americans, and more than the average Social Security transfers for the typical couple age 65 and older!!!
Forget about Obummercares, the “dis-ease care” system is utterly prohibitively costly to the bottom 90-99% and will eventually collapse, as will “higher education”, which no longer provides a value-added service to firms, students/prospective employees, and society in general. The “dis-ease care” and “higher education” systems now primarily exist for their own continuation, irrespective of the cost to society, which mathematically precludes the system’s survival in its current form.
Joseph,
Here is the quote from the CBO report so that others can judge for themselves.
<b<"…the annual number of uninsured is
expected to decrease to between 29 million and 31 mil-
lion—that is, between 24 million and 27 million fewer
than would have been uninsured in the law’s absence…
Ricardo, perhaps your grasp of the English language is shaky. I’ll try to help you out.
Here is what you said: “there will be 24 million to 27 million fewer insured.”
Here is what the CBO said: “there will be 24 million to 27 million fewer uninsured.”
See if you can find the difference. Don’t strain yourself.
Ricardo, good points about Obummercares.
US “health care” should be described as “obscenely costly dis-ease care for the sickest 5-10% to 20%” (those with chronic cardiovascular, metabolic, and cancer conditions who age into late life, and those who have unhealthy diets, smoke, abuse alcohol, and who get little or no exercise) on whom the US spends 50-65% to 80% of all “dis-ease care” spending, which the bottom 80-95% pay prohibitive costs to sustain for the benefit of the top 0.001-1%.
Obummercares was written by the insurance, hospital, and pharma companies, and the AMA, resulting in the program being a gov’t-sponsored and -protected $3-trillion cartel that the bottom 90-99% of Americans cannot afford.
It is estimated that at least one-third of “dis-ease care” spending in the US is unnecessary, overprescribed and overbilled for profit, and outright fraud.
Then combine private “dis-ease care” spending with private “education”, total gov’t (including public “education”), household and business debt service, and oil consumption, and the cumulative spending is an equivalent of 56% of GDP.
Financial “services”, “dis-ease care”, “education”, gov’t, and primary energy consumption are now a cumulative net cost to US (un)economic activity and a permanent structural drag hereafter from which a tiny minority, or at most a small plurality, benefit at the increasing cost to everyone else.
bc, i assume you feel the same way about medicare? you are welcome to find an affordable private health insurance policy for that stage of your life as well.
baffling, you missed the point. Why does “health care” cost Americans $10,000 per capita and $26,000 per household? What is the cost/benefit? Who benefits at whose expense? How? Why?
Why is so little spent on education and prevention and most spent on profiting from treating largely self-inflicted conditions encouraged by federal policies for agriculture, mass-media advertising of “food”, etc.?
We do not have a “health care” system but rather a “for-profit, dis-ease-creating” system that perceives individuals as targets for exploitation and profit maximization from encouraging unhealthy behavior and costly “health care” consumption.
The system is terminally ill.
“Rational expectations”:
http://www.frbsf.org/economic-research/publications/economic-letter/2015/february/economic-growth-projections-optimism-federal-reserve/
Real labor productivity has decelerated from 2%+ to 1.3% to 0.6% since 2000 and 2007, whereas the labor force is growing very little, if at all. Therefore, by definition, the secular trend rate (and “potential”) for real GDP is no faster than 0.6-1.3% and below 1% to 0% per capita.
That’s as good as it gets for the post-Oil Age epoch (“secular/permanent stagnation”) as a result of Peak Oil, Boomer demographic drag effects, and “Limits to Growth”.
Once the effects of the deflating of the shale bubble passes through to orders, investment, production, housing, autos, employment, and spending, stall speed to no growth or recession is likely in 2015, and the fiscal deficit will begin rising again as a share of GDP.
BTW, another imperial war cycle is due in order to attempt to goose industrial production via supplying the war machine, but the debt to wages and GDP, fiscal constraints, and food stamps, Obummercares, etc., will result in any gov’t spending multiplier being small to non-existent.
The Hegemonic Cycle implies that US-China trade and diplomatic relations will become increasingly strained and eventually collapse in the years ahead, leading to regional or global conflict, if not blockades, embargoes, and war (including cyberwar), in the years ahead.