Today, we’re fortunate to have David Papell and Ruxandra Prodan, Professor of Economics and Clinical Assistant Professor of Economics, respectively, at the University of Houston, as Guest Contributors.
While the Great Recession of December 2007 to June 2009 ended over five years ago, the recovery has been characterized by very slow growth. The Congressional Budget Office has recently released projections of real (inflation adjusted) GDP growth through 2025. If these projections turn out to be correct, real GDP for the U.S. will never return to its pre-Great Recession growth path. This projected decrease in potential GDP is unprecedented, as almost all postwar U.S. recessions, postwar European recessions, slumps associated with European financial crises, and even the Great Depression of the 1930s were characterized by an eventual return to potential GDP.
Suppose you were an econometrician in 2025 and wanted to analyze the long-run effects of the Great Recession. Figure 1 depicts real GDP from 2003:Q3, when potential GDP was re-attained after real GDP returned to its growth path prior to the 2001 recession, through 2025, with actual data through 2014 and projected data thereafter. Figure 1 also depicts the results from estimating a structural change model that allows for one break in the intercept and constrains the growth rate before the break to equal the growth rate after the break. The break, chosen endogenously, occurs in 2008:Q2. This model cannot be rejected in favor of a model where the growth rises after the break until potential GDP is restored and then returns to its pre-break trend.
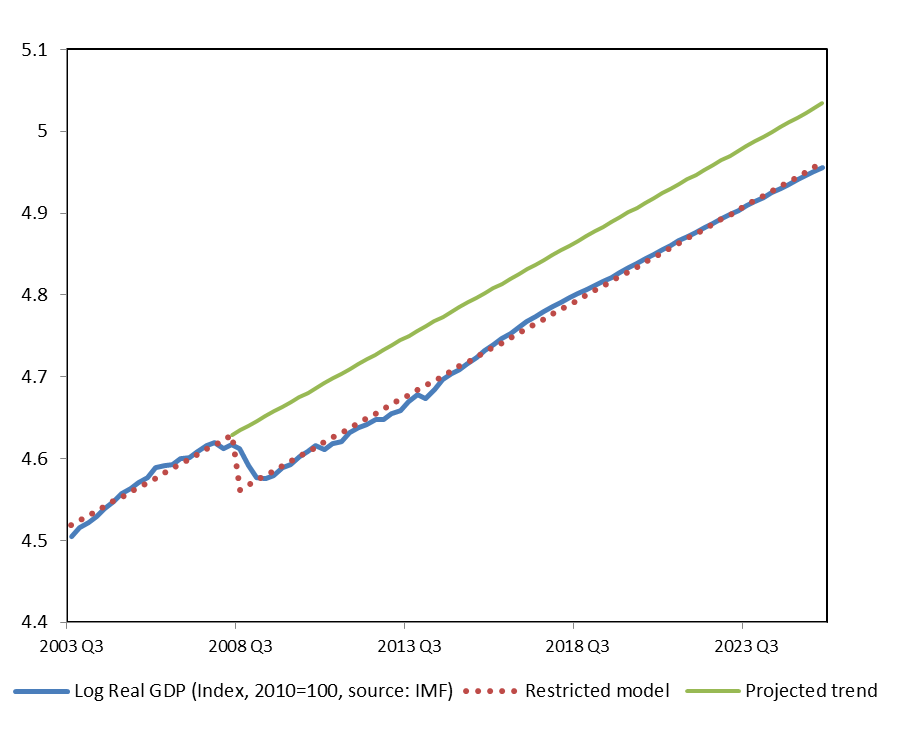
Figure 1: Log real US GDP (2010=100).
In 2011, we presented a paper, “The Statistical Behavior of GDP after Financial Crises and Severe Recessions,” at the Federal Reserve Bank of Boston Conference on the “Long-Term Effects of the Great Recession,” and summarized the results in an Econbrowser post. The focus of the paper was to show that, while severe recessions associated with financial crises generally did not cause permanent reductions in potential GDP, the return takes much longer than the return following recessions not associated with financial crises. We focused on five slumps, extended periods of slow growth and high unemployment, following financial crises identified by Carmen Reinhart and Ken Rogoff in their book, “This Time is Different,” that were of sufficient magnitude and duration to have qualified as comparable to the current Great Slump for the U.S. If the path of real GDP for the U.S. following the Great Recession had been typical of these historical experiences, the Great Slump would have been expected to last about 9 years but would not affect potential GDP. Assuming that the Great Slump started in 2007:4, we predicted that it would not end until 2016:4.
This prediction now appears to be much too optimistic. According to the CBO projections, real GDP will grow by 2.9 percent in 2015 and 2016, 2.5 percent in 2017, and 2.1 percent thereafter. If these projections are correct, potential GDP will never be restored. As shown in Figure 1, while real GDP fell by 4.3 percent from its 2007:Q4 peak to its 2009:Q2 trough, real GDP will permanently be 7.2 percent below the pre-Great Recession growth path because trend real GDP continued to rise during the recession.
In his discussion of our paper at the Boston Fed conference, Jeremy Piger proposed a model of “purely permanent recessions” with a negative intercept break, but no subsequent changes in growth rates. While we were able to reject this model in favor of our chosen models for all five advanced countries that experienced slumps flowing financial crises, future econometricians will not be able to reject his model if the CBO projections turn out to be correct.
Using the same actual and projected data, the CBO expects that the gap between actual and potential GDP to be essentially eliminated by the second half of 2017. Their calculations, however, assume that the growth rate of potential GDP was 1.4 percent per year between 2008 and 2014. In other words, the gap between actual and potential GDP is eliminated, not by faster growth of actual GDP, but by slower growth of potential GDP.
The questions of why growth has been so low since 2009 and what, if anything, can be done to increase growth in the future are both matters of great controversy and beyond the scope of our research. What we can say, however, is that if growth evolves according to the CBO projections, pre-Great Recession potential GDP will never be restored in any meaningful sense.
This post written by David Papell and Ruxandra Prodan.
This is this kind of paper that gives econometrics a bad name – or should I say a worse name. As most econometrics, it takes aggregate data and combines them in a hypothetical formula and spits out an answer that totally ignores political and other behavioral factors (usually explained away as unknown exogenous factors)
I am going to go out on a limb and say we will have a supply theory Republican sworn in January 2017 along with a Republican House and Senate. That being the case we should see the “magic formula” of low taxes and stable money become policy releasing our economy to levels of the 1980s. That will mean growth somewhere around 7% with a huge increase in start-up businesses reducing unemployment to around 4.0% even with the non-participation rate declining significantly. With Paul Ryan as chairman of Ways and Means, we should see real tax reform reducing compliance costs on taxpayers significantly. Wedges to bank lending will be reduced as Dodd-Frank is reeled in and capital will begin to recover its collateral value. Hopefully, we will also see compliance costs of Sarbanes-Oxley reduced significantly removing a huge anchor from the necks of existing businesses. Then investors all over the world will see that the US has recovered its prime investment environment and dollars will flood in financing new projects. 2018 could be the most prosperous year our nation has ever seen with growth rates that challenge those of China.
Of course there is always the remote possibility that Hillary Clinton or Elizabeth Warren could be elected. If that happens then the forecasts of Papell and Prodan will be highly optimistic, as were their earlier forecasts, when did not factor in the reelection of President Obama in 2012 and the impact of the huge cost of Obamacare with its Chinese water torture roll-out.
I am going to go out on a limb and say . . .
Ricardo, beware of economists with chainsaws on the other end of the limb. 🙂
You could also consider a lower limb. 🙂
Ricardo aka Dick aka DickF aka RicardoZ: I think this statement applies to your repeated characterizations of econometrics: “You Keep Using That Word, I Do Not Think It Means What You Think It Means”. Most applied econometrics I would say involves examining micro data, and particularly as more and more micro data sets and “big data” become more pervasive, analysis of aggregate macro data becomes a smaller and smaller proportion of the applied econometrics literature.
Menzie aka champion of universal food stanps aka ignorance of WMDs aka Democrat apologist
Thanks for the shout out. I didn’t expect you to address the post.
the huge cost of Obamacare with its
ChineseCheney water torture roll-out.Fixed
Your wit and irony are so dry that the quotes around the phrase magic formula are the only way I can tell you’re joking. Your post is a truly masterful expression of every piece of neoliberal economic propaganda distilled to its essence. I especially like the subtle categorization of tax evasion and avoidance expenditures as taxpayer compliance costs. And before I can even catch my breath you’re classifying unlimited access to the Fed Discount Window at 0% as a wedge to lending, and in the same sentence an implication that Dodd-Frank and Sarbanes-Oxley are crushing anything more than the hope of meaningful regulation of an industry whose criminal acts are truly breathtaking. Stunning.
And for desert – the trumpeting of the US recovering its prime investment environment reputation so that peoples the world over can sleep soundly once again, knowing that the best and brightest will once again be free to steal billions without fear that anyone will suffer so much as a hangnail.
Wow. Who believes this s***? [edit by MDC]
Old news 7-14 years after the onset of “secular stagnation”, owing to:
Peak Oil.
Population overshoot (RIP William Catton).
Peak demographic drag effects.
“Limits to Growth” (from resource depletion per capita).
Hyper-financialization leading to excessive private (and now public) debt to wages and GDP resulting in net flows to the financial sector precluding growth.
Extreme wealth and income inequality and hoarding of overvalued financial assets by the top 0.1-1% to 10% at no velocity, further exacerbated by ZIRP and QEternity inflating financial bubbles to larger valuations to wages and GDP.
Structural deceleration of labor productivity from labor returns to GDP at a record low, regressive taxation of earned income in exchange for favorable tax treatment of unearned income from non-productive rentier speculation, interest, dividends, capital gains, pass-through income, etc., labor and trade policies that favor deindustrialization and its effects on the bottom 90%, and outsized growth of employment in increasingly financialized sectors of gov’t, health care, education, and financial services that are now a cumulative net cost to productivity and GDP growth.
Scandalous “health care” costs at $10,000 per capita, $26,000 per household, and 18% of GDP.
Total public debt at or more than 100% of GDP.
At least $80 trillion (and perhaps $200 trillion) in unfunded gov’t obligations to citizens that cannot be paid from the implied growth of wages and GDP over the next 20-30 years.
High replacement costs of existing deteriorating public infrastructure that will require higher taxes/fees when real, after-tax incomes of the bottom 80-90% are no higher than 40-50 years ago.
Capital formation to GDP at the levels of 20-25 years ago.
Real GDP per capita decelerating to half the long-term average and near 0% since 2007.
That’s the short list.
News flash — May 1, 2025
Today the president of the USA announced that Americans are no longer shallow, material growth junkies. Finished, done. Time to move on to other priorities.
“As most econometrics, it takes aggregate data and combines them in a hypothetical formula and spits out an answer that totally ignores political and other behavioral factors (usually explained away as unknown exogenous factors)”
Whereas your comment is the kind that gives blogs a bad name, as it’s all political ideology and no substance. I think you’re talking about macroeconomic models. Econometrics is less about being hypothetical and more about analyzing empirical data, looking for patterns so that other theorists can use this to look for political and other behavioral factors to focus upon more.
I will say that the graph could be greatly improved if it made it clearer what portions of the data are actual and what portions are projected. The state of macroeconomic forecasting in general is notoriously bad, so it seems a bit premature to assume the CBO projections will be accurate.
However, it wouldn’t be surprising if the effect of sustained long-term unemployment from the Great Recession to significantly depreciate human capital, perhaps permanently.
perfectly,
I was talking about the formula being hypothetical not the data. You can take data and put it into a meat grinder and still not get anything useful. Also do you not believe that projections are hypothetical? Your last sentence is essentially Jimmy Carter’s “malaise” speech and Barak Obama’s “new normal.” I like Reagan’s “morning in America” better and especially the economic results.
My point is that econometrics is the key to making models and theories grounded in reality exactly because it takes real-world data. There is nothing hypothetical about the formulas they find. The only question is whether the formulas mean anything.
Regarding the effects of long-term unemployment on growth, see here (Google the title to get past the gate)
http://www.wsj.com/articles/economys-supply-side-sputters-1424298482
“Yet as demand heals, there are growing signs that the economy has a problem with supply, or the ability of the economy to produce goods and services using all available labor, capital and know-how. Supply determines how fast the economy grows over the long term, and it largely depends on two things: the number of workers, and how productive they are.
The evidence is mounting that those two key drivers of the economy’s supply side, the labor force and productivity, are seriously impaired. This isn’t holding the economy back at present, but before long it will.
…
Consider these two factors—the labor force, and productivity—in turn. The share of the population that is either working or looking for work, the labor-force participation rate, has fallen sharply. Between 2007 and 2014, the participation rate shrank to 62.9% from 66%. Initially, the drop in participation was blamed on the severity of the recession and feebleness of the recovery.
…
That explanation looks less convincing with each passing year. Participation has stabilized over the past year but hasn’t risen.”
WSJ not exactly a liberal outlet, thus the casting of this as “a supply-side problem” instead of an unemployment problem, and the piece focusing only on labor-participation and ignoring long-term unemployment also still remaining unusually high.
I have said this for years now: the “typical” post ww2 recovery everyone including the Fed is looking for will not appear until perhaps 2025-2030. Combined with the massive substitution effect technology is having on the global economy and displacing human capital, the reality is aggregate demand has taken a big shift to the left along with aggregate supply and hence the continued and ongoing risk, the greatest macro risk at present, of deflation. I first wrote about deflation risk in The summer of 2013 when no one was talking about it and now it is the front and centre macro risk. Wise central bankers should be adjusting their core inflation targets upward to say a 3-3.75 percent band and accept some potentially higher inflation risk, not saying the current policy mix out of government that is not motivating heavy investment spending, would get it but at least financial market participants and consumers would begin to feel better about letting prices rise without undue worry about when the Fed will hike and destroy the economy like Bernankes 18-19 consecutive 25 basis point rate hikes that picked the U.S. housing bubble in 2008 and no one talks about that…
Accordingly, the authors are correct in that it will be some time before we have to worry about a typical recovery and those worrying about inflation growth are stuck in the 1970s with their thinking. Sadly, some of the Fed members think this way are are in my view out of touch with what is going on in the U.S. and global economy….
I thought this was a pretty good post. Well written, coherent.
I would not, however, put too much stock into CBO forecasts. They have been consistently wrong in the last few years. You’ll know the Great Recession is over when the CBO misses by being too low in their forecast–and that will be this year, I think.
Steven Kopits: If you don’t put too much stock in CBO forecasts, you probably shouldn’t put too much in Blue Chip consensus either (which in my experience is not too far off SPF). Which forecasts do you put stock in?
Steven Kopits: If you don’t put too much in CBO forecasts, you probably shouldn’t put too much in Blue Chip consensus either (and in my experience SPF and WSJ consensus are not too far from Blue Chip). See CBO’s recent assessment.
I am curious who you think does a good job forecasting, and along what dimensions you make that judgment (Mean error, RMSE, MAE, direction of change?).
Menzie,
I didn’t think I was being controversial. Here’s the CBO’s track record on the potential GDP forecasts, courtesy of Larry Summers. I believe you are as aware of this article as I am. http://www.voxeu.org/article/larry-summers-secular-stagnation It shows a steady parade of downward revisions.
Forecasting since the end of the Great Recession has been pretty bad across the board, the IMF and CBO included. Indeed, the IMF had an analysis of the situation, mentioned in the Wall Street Journal (http://blogs.wsj.com/economics/2014/10/07/the-imf-fesses-up-to-big-growth-prediction-misses-biggest-of-all-brazil-india/) of which you are also no doubt aware.
The question is rather why</I< these forecasts have been off. Searching for an explanation has become something of a cottage industry, with the reason coming down to some variant of 'secular stagnation'. By contrast, I have argued that oil is to blame. If that is the case, then the collapse of oil prices should remove oil as a constraint, and growth rates should recover more normal behavior with a tendency to close the GDP gap over time. I am on the record on multiple occasions with all of this. If the oil explanation is correct, we would expect the CBO, IMF and World Bank–which have now reduced their growth expectations–to under-forecast GDP for a change. Hence my admonition to the authors to treat CBO forecasts with caution.
Growth since Q2 has exceeded expectations in the US, with the exception of Q4. We'll see whether one million new jobs were enough to lift Q4 GDP above 3% when the revisions come in. In the meanwhile, Germany has unexpectedly grown faster than forecast, something which I suggested might happen. Here's the related article: "German Economic Growth Smashes Expectations", http://seekingalpha.com/article/2919406-german-economic-growth-smashes-expectations.
Steven Kopits: My mistake — I thought you meant forecasts of GDP; I didn’t realize you meant forecasts of potential GDP. Since potential GDP is an unobservable, it would be hard to make an assessment at this point. And I don’t know how you make a comparative assessment, since potential GDP is not reported by many other forecasters (but might be implicit in some internal documents).
Both were bad, as I recall. But feel free to disabuse me.
Here’s what I found: CBO forecast from January 2011, versus FRED data, and difference
2011: CBO 3.1%; FRED 1.6%, Diff -1.5% (Actual to Forecast)
2012: CBO, 2.8%; FRED, 2.3%, Diff -0.5%
2013: CBO, 3.4%; FRED 2.2%, Diff -1.2%
2014: CBO, 3.4%; FRED 2.4%, Diff -1.0%
Big misses all, it would seem.
http://research.stlouisfed.org/fred2/graph/?g=UMJ#
https://www.cbo.gov/sites/default/files/01-26_fy2011outlook.pdf
Steven Kopits: My point is that these errors are comparable to those of Blue Chip consensus, WSJ mean, SPF mean, at the two year horizon (discussed in the CBO document). I am curious whose forecasts you deem superior; we can then apply the standard forecasting performance metrics (me, rmse, mae, direction of change) to their forecasts and formally assess.
I don’t know that I have a favorite macro forecaster right now. I thought Sadowski was often pretty good short term, but I’ve not seen hide nor hair of him in many months.
Instead, I was responding to the concluding sentence of the post: “What we can say, however, is that if growth evolves according to the CBO projections, pre-Great Recession potential GDP will never be restored in any meaningful sense.”
The truth is that growth has not evolved according to the CBO’s projections, which have proved materially inaccurate. Of course, the CBO is not unique in this respect. Nevertheless, the conditionality imposed by the authors leans on the accuracy of an institution, the CBO, which has been well wide of the mark recently.
Now, if you know forecasters and institutions, then you’ll also know that change in forecasting methods and model coefficients tends to be gradual. There are both institutional and principal-agent reasons for this, but the result is that coefficients tend to be modified over time to reflect actual data, and this can be done both manually and by some sort of rule (moving average, for example). If the incumbent models are correct and the regime persists, then sooner or later the coefficients will more or less line up with the data. This is what the CBO has been doing to potential GDP over time. As actual GDP data has come in low, the CBO has reduced out-year potential GDP. You can see the progression very clearly in Fig. 1b of the Larry Summers article. (http://www.voxeu.org/article/larry-summers-secular-stagnation) This progression implies a gradual change in coefficients without any regime change or change in model. Next year’s forecast is the same thing as last year, just a bit less. These changes are not driven by a new vision of the economy or any belief that a new model is appropriate to understand economic performance. Rather, they are piecemeal concessions to incoming data.
For purposes of comparison, let me show you what a regime change model looks like. You can see my analysis of supply and demand in the oil sector here (http://www.prienga.com/blog/2015/1/20/supply-minus-demand-explained), and how it compares to the IEA, EIA, and OPEC. You can see that the major agencies continue existing trends, plus or minus. The collapse of oil prices moves neither supply nor demand in any dramatic fashion. By contrast, if one imposes a regime change approach (ie, applying the 1986 template), then both supply and demand sees radical shifts over the course of the year. Applying last year’s coefficients won’t tell you what will happen this year.
Making such a forecast requires courage. If I’m right, I’m a star; if I’m wrong, I am well separated from the herd and easy pickings for the wolves of the media. (Indeed, my views have been written up in the FT and Bloomberg; I am on the record. Fortunately, the data is breaking my way, but it’s too early to claim vindication.) A CBO or IMF can’t really put such a forecast on paper. Indeed, neither can IHS / CERA or Wood MacKenzie. It’s just too radical. On the other hand, the downside of the gradualist approach (the “Gradualist Approach”) is that it will tend to miss turning points.
I have argued that oil matters to GDP growth and that the shale surge and the collapse of oil prices implies that oil is no longer a binding constraint on GDP growth. Therefore, growth should return to trend for as long as oil prices remain low. If this is true, then the CBO–which has been gradually reducing coefficients in the face of incoming data–will likely under-forecast GDP. This is also true for the IMF or World Bank. In other words, during periods of transition, forecasts are a lagging, not leading, indicator.
Consequently, I am admonishing David and Ruxandra to bear in mind two things.:
First, the CBO’s forecasting track record has been poor in recent years, and therefore relying upon the accuracy of their current forecasts is a chancy business.
Second, I believe that the collapse of oil prices signals a regime change (possibly a temporary change, but still a regime change) for the global economy. The forecasting tools which the CBO, the IMF and the World Bank used in 2005, with the coefficients as they were set at that time, should prove more or less useable now while oil prices stay low. We are leaving an alien country and returning to analytical frameworks with which the IMF and CBO, for example, were comfortable prior to the Great Recession. There is, as long as oil prices stay low, probably no need to take as grim a view of the future as that proposed by David and Ruxandra.
Menzie: Forecasting is what it’s all about. Humans care only about the day and the morrow. Forecasting well consistently is mighty tough. It is more art than science, and probably always will be. Though eventually AI will help asymptotically narrow the error. Forecasting accuracy ought to be judged in a bifurcated manner. There are times when forecasts are more valuable than others. Specifically, at the turning points of the business cycle. Nothing is more important than calling these right, and not calling a turn falsely when the expansion is ongoing.
In normal times which is most of the time, that is during expansions, my chosen method is to put most weight on recent forecasts. Then a set of dampened weights going back. All forecasters are subject to getting caught by past beliefs which no longer represent the changing times and then have their forecasts go awry. Consistency is important. Consistency arises out of being able to live with ambiguity, and having the psychological temperament to adapt along with the changing structure of the economy.
Pay attention to: Paul Ashworth, Beth Ann Bovino, Michael Carey, Julia Coronado, Mike Cosgrove, Robert Dye, Mike Fratantoni, Doug Handler, Jack Kleinhenz, Don Leavens & Tim Gill, Robert Mellman, and John Silvia. This list will change over time. Jointly their current year growth forecasts are a quarter point or so below the consensus. You can bet that actual will be even lower on the time-honored principal of getting the barrel of the shotgun out ahead of the duck’s flight path before you pull the trigger. No guarantees. This is art.
The variable of interest is real GDP growth. Nothing else is as important. Having said that, the biggest market in the world is the bond market. So of course, interest rates may be more important to some. But GDP is one of the bases for rates. As is inflation.
What is not so important is the measure used to calculate forecast error. Mean absolute error weighted as above will do just fine. But remember what I said about bifurcated. When those who correctly forecast the last downturn start saying it again, look out. There are two horizons other than that of trying to call next month’s employment report or CPI in advance. Year ahead and standing further back and deciphering large coming events. Steve Keen, Nouriel Roubini, and a small handful of others were right for the right reasons well ahead of the Great Recession. One would be remiss in not paying attention to their broad views. Another batch is great hedge fund managers. Kyle Bass comes to mind. Pay attention to Mr. Bass. And by all means Van Hoisington and Lacy Hunt. Boy have they been right about rates for a long time.
Anyone who teaches macro who cannot forecast at roughly the level of the consensus ought to be reassigned to other courses. What a vacuum that would leave! As Khalil Gibran said in The Prophet (1923): “And if you cannot work with love but only with distaste, it is better that you should leave your work and sit at the gate of the temple and take alms of those who work with joy.” Because once you can forecast, you cannot in all integrity teach out of today’s textbooks. Assign one of your students to survey the above individuals and see if they do not agree.
This analysis suggests that the economy’s growth rate has little to do with fiscal policy, which is exactly what conservatives have said since the recession began and policy makers have spent billions of dollars unsuccessfully attempting to get GDP back to potential GDP. The stimulus package by definition increased GDP, but has clearly not stimulated the economy enough to reach potential GDP. Further, GDP does not appear to be lower due to the austerity measures adopted over the last few years.
Anonymous: I don’t know how you can say this on the basis of this graph. If you look at other economies (euro area, UK), you’ll see that those areas with less fiscal stimulus grew slower, and haven’t recovered pre-recession levels — unlike the US.
I also don’t know what you mean by “the stimulus package by definition increased GDP”. We have theories, and empirical evidence, that this is the case in the US; but it’s not true by definition. You are babbling.
Menzie wrote:
I also don’t know what you mean by “the stimulus package by definition increased GDP”.
Are you serious? You really don’t understand this? You grasp less of real economics than I thought.
What this means is that government spending changes the GDP numbers by definition but does not actually stimulate the economy because the spending has to be taken from somewhere. You can’t increase the level of water in a pot by taking a cup of water from one side and pouring it into the other side. I hope that helps.
Menzie, maybe I am confused. You often show how good/bad certain policies are (e.g. Walker in Wisconsin) by showing the difference between output and potential output. Given that we have had two very different policy regimes since 2008 (one of stimulus and one of austerity) and we are still not expected to reach potential output, it is safe to assume that neither policy was successful in closing the output gap. And since neither was successful, why not go with the cheaper of the two?
I have no doubt that other countries realized gains from fiscal stimulus. But given that I am a taxpayer in America, I try to look at policies that are best for America, not other countries. In this case, I do not think that going heavily in debt has been the end-all that liberals pitched it as when we dropped $700B for stimulus a few years ago. I am a little sensitive to this right now given that it is tax season and I just learned how much I had to pay to the federal government!
As far as the GPD statement goes – you are probably right that I was babbling. I thought that in Keynesian economics one variable of GDP is G, so if G increased than GDP would also increase. Not exactly sure though as it has been a while since my intermediate macro courses.
Anonymous: 1. The US has embarked upon less austerity than other advanced economies, and has experienced substantially faster growth. As social scientists, we should try to interpret phenomena in the context of cause and effect, and use what data we can, sometimes cross-sectional.
2. Not sure what GPD is.
3. You have a stereotype of what a Keynesian model is. In a Keynesian model (let’s say IS-LM), I can get zero impact of government spending if the interest sensitivity of money demand is zero; in a IS-LM model with portfolio effects, the impact can be negative. In some New Classical/Real Business Cycle models, an increase in government spending could induce an increase in GDP. Depending on when you took intermediate macro, you might or might not have covered these issues. (I always cover them — you can look up my course syllabi and/or textbooks to verify; they have been John Taylor/David Papell’s text and Olivier Blanchard’s, over the past two decades.)
The authors of this post show that we are not going to reach potential output based on CBO forecasts. In your analysis (e.g. Walker in Wisconsin) you use the distance between output and potential output as a yardstick for policy performance. Do you not? Since the distance between the outputs, based on this post, will essentially be constant going forward and not close-in on zero, the same yardstick you deride conservative policy with would also imply that neither stimulus nor austerity was an output-gap-closing policy in the US since 2008. Am I missing something? This does not seem controversial based on this blog post. If either of them worked, wouldn’t the gap be closing to zero?
So the question to me is how much would the US have to spend on stimulus each year (2015-2025) to close the gap and keep it closed, assuming the gap would revert to the same size that is shown in the above chart if stimulus is shut off? To calibrate your assumptions you could use what actually resulted from Obama’s stimulus bill a few years ago. Now that would be cool analysis!!
GPD: Gross Pudding Demand?…
Anonymous: In re, your comments:
Answer: No.
Answer: Yes. See first answer.
It is useless to answer the subsequent questions given your complete confusion on the first two.
To assume this is not a cyclical phenomenon is to assume there was a sudden and sustained downshift in potential output.
The output gap should’ve been closing, at least slowly, since 2009.
The explanation why that didn’t happen seems to be extraordinary factors weighing on growth.
We haven’t really recovered after the trough in 2009. It’s approximately an L-shaped “recovery.”
Some factors why the economy didn’t recover may be the housing bust, terminating “too-big-to-fail,” the student debt boom, ACA, excessive regulations, and more progressive taxes (from “negative taxes” to “middle class” taxes, along with lower-income subsidies).
Also, there may be a slow structural decline in potential output, in part, because of a decline in higher-skilled workers, while the Baby-Boom generation retires.
Education Is the Key to a Healthy Economy
April 30, 2012
“California…once a leader in education, it is now ranked behind 40 other U.S. states in math achievement, placing it at the level of Greece.
But the averages mask the truly sad story in the Latino population, soon to become California’s dominant demographic group.
Hispanics attending school in California perform no better than the average student in Mexico, a level comparable to the typical student in Kazakhstan.
An alarming 43% of Hispanic students in California did not complete high school between 2005 and 2009, and only 10% attained a college degree.”
Peak,
if we look at government employment during the obama years and compare that with reagan and bush, you see the republican administrations were able to use increasing government employment as a stimulus to the growth of the economy. government job growth did not occur under obama-ie see the austerity arguments. i am sure this difference is not insignificant when looking at the performance of the recovery. so the question raised, if obama had seen a similar growth in government jobs as his conservative coutnerparts, would this recovery look better? his production of private sector jobs was significant, as a recent post on calculated risk notes
http://www.calculatedriskblog.com/2014/10/public-and-private-sector-payroll-jobs.html
http://www.calculatedriskblog.com/2015/02/best-private-sector-job-creation-ever.html
Federal employment is too small to make much of a difference:
http://www.opm.gov/policy-data-oversight/data-analysis-documentation/federal-employment-reports/historical-tables/total-government-employment-since-1962/
Non-farm employment, which excludes government workers, is much bigger:
http://research.stlouisfed.org/fred2/series/PAYEMS/
peak, i am talking about all public sector jobs, not just federal. st reagan had 1.4 million increase, while bush had 1.7 million increase. on the other hand, there has been a net 668,000 loss in government sector jobs thus far under obama. you don’t think these are numbers which would affect our recovery? bush had a net private sector LOSS of 461,000 jobs during his tenure. again, i ask the question. if obama had the luxury of adding 1.5 million public sector jobs through this recovery rather than austerity induced half a million job loss, you would be hard pressed to argue the recovery would not be improved.
baffling, how would Obama have “the luxury of adding 1.5 million public sector jobs through this recovery rather than austerity induced half a million job loss.”?
The weak recovery from the severe recession affected government employment and tax revenues.
peak, if your governments do not partake in a policy of austerity, then you do not have cutbacks in the public sector workforce, much less a decline in that workforce. the past eight years have shown the effectiveness of government austerity on growth around the world. if you want lackluster growth, practice austerity.
“The weak recovery from the severe recession affected government employment and tax revenues.”
and we have learned if a government reacts like a private enterprise, then the economy falters enormously. economic crisis are a demand issue rather than supply issue.
baffling, you were talking about Obama didn’t have the “luxury” of public sector jobs, like Reagan and Bush.
Without a recovery, Obama wouldn’t have that luxury.
He certainly tried harder than Reagan or Bush:
Chart of federal surpluses or deficits as a percent of GDP:
http://research.stlouisfed.org/fred2/series/FYFSGDA188S
peak, you are circling the truth but can’t seem to bring yourself to admit it. obama created the condition of a recovery. it has been slow, but nonetheless it has existed. superimposed on this recovery has been a policy of austerity with respect to government workers. this policy did not have to exist-it was imposed by one side. imagine how well the recovery would perform if we did not have this policy imposed. if i were a conspiracy theorist, i would almost think one side was trying to sabotage the recovery for political gain. but i am not a conspiracy theorist. i think we had austerity because one side needed to promote their ideology. and it was not helpful at all.
baffling, you won’t accept the fact that when government, led by a rigid ideologue with little understanding of economics, adds anti-growth policies to pro-growth policies, the result can be expensive and weak growth.
peak, please state what these pro-growth and anti-growth policies are, and who supported them. i agree we have had rigid ideology on display, but it is not who you think it is. you really think slashing budgets in a recession or slow recovery is pro-growth policy? i think you are smarter than that.
baffling, two anti-growth factors, since 2009, I cited recently are:
1. Piling on more regulations, e.g. in finance, health care, energy, housing, transportation, education, etc. on top of the $2 trillion a year in federal regulations, which the economy has been unable to absorb.
2. Creating greater disincentives to work through more progressive taxes (from “negative taxes” to “middle class” taxes) and more welfare payments.
seriously peak, you quoted talking points not policies. tell me which policies have been antigrowth? financial regulation? in the relaxed regulation era we ended up with a gigantic financial crisis. you think the cost of that crisis was less than new regulations which help to limit the excess leverage and risk going forward?
“creating greater disincentives to work…” so we have demand destruction, and your response is to get people off of unemployment so that they can take jobs that do not exist?
slashing government employment was really a brilliant pro-growth policy in the wake of the financial crisis. nothing like growing the economy while increasing unemployment.
you have solutions to problems that do not exist.
I stated in Feb ’09 [the tax cut should’ve been $5,000 per worker for the 140 million workers at the time or $700 billion]:
1. Obama should change his stimulus plan to a $2,000 tax cut per worker, along with increasing unemployment benefits by a similar amount. This will help households strengthen their balance sheets [i.e. catch-up on bills, pay-down debt, increase saving, spur consumption of assets and goods, etc.]. This plan will have an immediate and powerful effect to stimulate the economy and strengthen the banking system. When excess assets and goods clear the market, production will increase.
2. Shift “toxic” assets into a “bad bank.” The government should pay premiums for toxic assets to recapitalize the banking industry and eliminate the systemic problem caused by global imbalances. The Fed has the power to create money out of thin air, to generate nominal growth, boost “animal spirits,” and inflate toxic assets.
3. Government expenditures should play a small role in the economic recovery. For example, instead of loans for the auto industry, the government should buy autos and give them away to government employees (e.g. a fringe benefit). So, automakers can continue to produce, instead of shutting down their plants for a month. Auto producers should take advantage of lower costs for raw materials and energy, and generate a multiplier effect in related industries.
peak, i asked you for policies that were anti- growth, something you stated, not policies you would enact. i would imagine if obama did not have to fight with republican’s in congress, he would have done things differently, as you noted. but he did have to deal with them. but you stated clearly
“baffling, you won’t accept the fact that when government, led by a rigid ideologue with little understanding of economics, adds anti-growth policies to pro-growth policies, the result can be expensive and weak growth.”
what are these anti-growth policies obama has put into place? you may not agree with some of his policies, but it would be disingenuous and partisan to claim he has anti-growth policies. simply not true.
baffling, Obama placed his anti-growth policies, along with his pro-growth policies, when he had a Democrat House and a 60 vote Senate. He also sustained and added more anti-growth policies, along with adding more pro-growth policies, after he lost support of the House.
If the main focus was promoting growth, the output gap should’ve been closed in 2010, similar to other recessions. However, the main focus was a government restructuring of the economy, e.g. through Dodd-Frank, which included overcompensating for the lax lending standards created by Congress, the ACA, which made health care insurance (which is not the same as health care) more expensive for the “middle class,” reducing the coal industry, while squandering money on solar, raising CAFE standards, raising taxes on the people who actually create and grow small businesses (e.g. the alternative minimum tax), giving incentives to people not to work or not to work too much, etc..
There’s been one foot on the accelerator and the other foot on the brake resulting in an expensive (and ongoing) depression. An L-shaped recovery from a deep recession is ridiculous, particularly with QEs and advancements in economics.
peak,
you want to go back to the era before dodd-frank, when the financial institutions of this country nearly blew up the worlds financial system. talk about anti-growth! you want the same policy that created the problems to begin with? foolish.
the ACA has not been a drag, you are simply repeating conservative talking points. the ACA affected a small number of the “middle class” in a negative way. most of the “middle class” was unaffected or benefitted, period. insurance premiums were rising well before the ACA came into existence.
the alternative minimum was not anti growth. you should pay your allotted share of taxes, period. why should a select group of people be given special tax treatment? and if they want to stop working because their taxes are too high, fine. there is a line of folks standing behind them who would love the opportunity to open a new business and continue the growth.
you and i both know unemployment insurance is not a disincentive to work. thank your lucky stars you are not on the other side of the line-you would think differently.
“An L-shaped recovery from a deep recession is ridiculous”
an L-shaped recovery from a leveraged balance sheet recession is the norm. this was not a recession caused by a business cycle and tight fed monetary policy. ignoring this aspect indicates you either don’t understand the economic realities of the past seven years or you have an ideological agenda to pursue. you choose.
however, we have had significant cuts in public employment during this recovery-a policy of austerity embraced by conservative economists. as i stated to begin this discussion, you really think that was smart policy? you really think we would have had a protracted L shaped recovery if we had government job growth on the level of reagan and bush years? now this austerity approach was anti-growth, but it was not a policy embraced by the obama administration.
baffling, basically, you’re in denial.
It’s ignorant to assume this deep, and now long, depression is somehow necessary.
peak, it was not necessary to have such a prolonged recovery-although it was expected due to the nature of the financial crisis. however, we had an element of congress who wanted to use supply side solutions to a demand side problem. hence stupid things like austerity-lack of public sector job growth, the sequester, government shutdown. all of these were anti-growth policies supported by conservative economists. do you deny these are anti-growth?
and even with these significant headwinds, you see growth occurring. obama is creating large numbers of private sector jobs. just imagine the performance had we not faced these austerity policies. or are you one of the fools who believes that austerity provides growth? ask the europeans and the greeks about that policy.
What we see in this post is slippage. A statistical model presented Oct 2011, using data going back to the 1800s and other-country data from the postwar period, predicted growth would get back on track with pre-Great Recession growth by 2016. Now a little over 3 years later, the authors claim potential has been permanently lost and the economy will never regain that track. Another slippage is their begging the question of why potential growth has fallen since 2009. If the authors had devoted time to understanding how the economy really works instead of coming at future growth from a purely statistical perspective, perhaps that erroneous paper would not have been presented.
In an arithmetic sense, from 1965 to 2000 potential growth displayed by the log of real GDP lay on a straight line. For 35 years, growth unerringly returned to that “line of potential” after each recession. But more as a matter of arithmetic and less as a matter of economics, a point I shall return to momentarily. From 2000 to 2007, however, that line had already bent down. To start from 2003 as this chart does is misleading in two ways. The line of potential growth was already on a lower slope after 2000. And, this chosen starting point is somewhere in the middle of a cycle rather than at the usual starting point like across peak to peak. Hence the trend rate of potential growth shown – the line from 2003 to 2007 that’s then extended – is biased right from the outset.
Now to the economics. The Papell Proden paper does not once mention debt. The authors purport to refute Reinhart Rogoff with the metric they create. But this “refutation” is made in abstract space. Might instead the real world truly be different today as RR claim, precisely because the burden of debt is greater than ever in history?
At this point, a subtlety which is really a profundity enters. Credit grew faster than nominal GDP from the mid-80s on. In fact, an exponential fits the curve of credit relative to nominal GDP rather well. Whereas the curve of “sustainable” potential GDP was already bending down even before 2000. Some portion of measured output growth in those years was artificial in the sense that it was not sustainable. Credit was enabling consumption, that could not be sustained in the long-run, at the expense of savings. Thus, a cumulative dearth of capital was building all along. Into this growing breach, the country threw resources the command over which was borrowed from abroad. Effectively masking the non-sustainability for quite a number of years. From 1985 on, net national saving as a percent of national income averaged 3%, down hugely from the 10% of the 30 years before! Not only that, the credit-driven booms of 2000 and 2007 caused malinvestment of some portion of the resources that during those booms had been incorporated into the capital stock. That malinvestment, also, was not apparent. Malinvestment only shows itself in the wake of the bust, that is during the following slump to use the authors’ term.
The destructive nature of the debt burden, shortfall of savings, trade deficits incurred, debt owed to other countries, capital lost to malinvestment, and society’s obsession with consumption today at the expense of investing and growing tomorrow mean that, short of a miracle, there is no way the US will ever get back on the potential growth path that obtained before debt had gotten so far beyond optimal. Even to get on a path with a similar slope will not happen until debt is paid down! Few understand this, so it’s rarely even talked about yet. This is leveraged further by now unfavorable demographics. And by swelling claims for entitlements, that when fulfilled, blunt work incentives and enable that many more otherwise able-bodied to drop out of the workforce. BC’s comment above captures what future to expect all too well.
JBH I think you misunderstood their reference to R&R’s “This Time Is Different.” They were not referring to R&R’s work on the 90% debt threshold; they were referring to the R&R book on the history of financial recessions. A book by the way, that was much praised by Paul Krugman, who could hardly be described as a supporter of the 90% threshold thesis. In “This Time Is Different” R&R made the point that financial recessions were not like ordinary recessions in that financial recessions could be quite long (sometimes measured in decades). But even though the recovery time could be quite long, this does not mean that economies do not eventually recover to trend growth. The authors are suggesting that contrary to their earlier paper, if CBO is right, then this time might indeed be different in that we never return to trend growth.
You also might be misunderstanding one of the larger purposes of their 2011 paper. The paper is not just about making a forecast of trend growth. At its heart the paper is a contribution in econometrics time series analysis. The authors are presenting a procedure for determining two structural breaks. So in that regard you might want to think of it as part of a longer extended discussion in time series methods going back to Nelson-Plosser, Perron, Andrews, et al. If you’ll recall, the Great Depression provided the empirical backdrop for developing new analytical techniques for identifying structural breaks. On possibility that the authors did not consider is that a positive unit root shock (i.e., a stochastic trend) could restore GDP to what it would have been absent the Great Recession. Of course, this would be sheer luck. They ignore this possibility because their paper assumes a regime trend stationary time series. I think that’s a reasonable assumption, but it might not be right.
As to your comments about debt and malinvestment…pretty much warmed over Austrian voodoo. For one thing, I’ll refer you back to Rick Stryker’s reference to the Solow growth model in the Jones textbook. One of the key lessons from that model is that capital deepening only increases the output level, not the growth rate. The deep mystery of economic growth is in the residual; i.e., in the technology component. And that’s the component that has suffered the most under the “Austrian-Austerian” (“A-A”) policies so often favored by conservatives and business leaders on the right. BTW, I like the A-A abbreviation because it reminds folks that there is a 12-step recovery program available at most community colleges. And just to be clear, like you I am no optimist about our future prospects for long run growth. But I come to that conclusion from a very different route. I don’t think our political leaders are smart enough to understand how to manage aggregate demand. I don’t think our electorate understands the risks to future economic growth by ignoring climate change. I don’t think politicians understand that most growth comes from knowledge, which requires a huge investment in human capital. And I don’t think any of all this matters if we don’t come to grips with the problem of increasing income & wealth inequality.
2slugbaits A chimp invents a stick to beat bananas down out of a tree. It is all about the bananas. The tribe is fixated on them. The stick doesn’t work. The overarching message of Reinhart and Rogoff (2009) is that the “this time is different” syndrome leads people to mistakenly believe that the current financial crisis will be different from past financial crises.” RR were not mistaken. The stick creators were. Their stick misled the tribe. It is all about the bananas. You compound the error. You make it about the stick.
JBH Again, you are misunderstanding what the authors are saying. In their 2011 paper and in their earlier Econbrowser post they were NOT…repeat NOT disagreeing with R&R. They used R&R’s phrase ironic phrase “This Time Is Different” (ironic because R&R really meant “this time is not different) to bolster their point about returning to potential GDP. The authors point was that they did not have any reason to believe that we would not return to potential GDP. People just had to be patient and realize that recoveries from financial recessions take a long time, as R&R’s book makes clear. Their latest post above kind of hedges a bit and leaves the door open for the possibility that things might actually be different this time and we don’t return to potential GDP. According to CBO we will close the output gap, but largely because of lowered estimates for potential GDP.
As to whether or not the authors are right in their assessment, I haven’t a clue. But I do know how to figure out whether or not potential GDP has in fact fallen. Just crank up the old stimulus machine. If we start to see inflation biting, then we’ll know the answer. No need to wait until 2025 for econometricians to examine the corpse.
2slugbaits: I reread and reflected on the relevant section of PP’s paper and conclude you are quite right about them not bashing RR. I had not attended carefully enough to the final lines of the preface of RR’s book: ‘“We hope that the weight of evidence in this book will give future policy makers and investors a bit more pause before next they declare, “This time is different.” It almost never is.’ Thank you for pointing this out.
Earlier in their preface RR say: “… the main message of this book: we have been here before.” Human nature has not changed. Humans take on too much debt. Systemic crises arise. We are in such a crisis now (as of 2009). And then their germane point: “The aftermath of systemic banking crises involves a protracted and pronounced contraction in economic activity … .” From many papers by RR and others since, my view solidified around the theme that US growth was going to be subpar for a decade or more. So I’m with RR up to this point.
But I’ve since gone beyond to a place where – this time it really is different. No irony. Though the locus of my reasoning has shifted well beyond RR’s conclusion to a wider more encompassing sphere, it still puts considerable weight on the deleterious effect of debt. This is neither time nor place to flesh out in detail why. I’ve already laid out preliminary thoughts in comments on other posts. Suffice it to say that the overall US debt burden is still close to its historic high. There is little or no understanding of the harm this is doing. But what persuades me even more is a socio-political variable. There is in this country no longer the political will. On this score, the earth has revolved nearly 180-degrees since the time of, say, JFK. Twelve-year olds had piggy banks in those days, not credit cards. This manifestly makes the likelihood of paying down the debt this time almost nil. The empire will fall first. Empires rise and fall as you well know. Empires fall because of internal decay. This is vintage Carroll Quigley. There is no hard and fast rule on the length of span. But 250 years comes to mind. Say 1776 to 2026. This too is different. The crux is that the era of economic expansion winds down. Never before in the history of the human race has it been one globe. This is another reason why this time is different. Smaller countries like Greece, Norway, Argentina could default and come back. They had other bootstraps to lift them. But there is no country large enough to save the US. China is upcoming; the US is wending down. Loss of reserve currency status will be a defining moment. Since around 1450, reserve currency status was held by 5 different nations before the US took on that status around 1930. That’s 100 years per. The year 2030 will be here before RR’s “protracted” aftermath of the last financial crisis reaches its natural end. Worse, another crisis is already in the wind. Though it will emanate from the catastrophe that is the eurozone, the US will not escape it as it will be globally systemic. The path of potential growth is in for another wrenching permanent shock down.
“….…pretty much warmed over Austrian voodoo. For one thing, I’ll refer you back to Rick Stryker’s reference to the Solow growth model in the Jones textbook. One of the key lessons from that model is that capital deepening only increases the output level, not the growth rate. ”
When “capital deepening” , proxied as debt/gdp , increases sequentially over a several-year period – as occurred in the ’80s and 2000s – it will look just like a “growth rate” increase. The level of output at the end of a long period of capital deepening will be higher that it would have been absent that leverage increase , and straight-line projections of log growth rate made across this period will be misleading if leverage cannot continue increasing in the future. Unless you believe debt/gdp ratios can grow to the sky , that’s the situation we face today , and Japan faced in 1990.
It’s reasonable to dismiss many of the claims made by the A-As , but don’t throw out the baby with the bathwater.
Marko: You absolutely nail it. To do so you’ve had to think carefully about this stuff. Thinking carefully leads one to the next level down where few others have tread. To think like this you had to set aside what you were formally taught, meaning breaking away from old beliefs. Once in this mode, mental light bulbs come on and you see the economy in different light. The BEA’s GDP prints are one, but only one, representation of a very complex phenomenon. In general, there may well be equally important representations yet to be discovered. I need not bore you with more than the names of Darwin, Copernicus, Newton and other such luminaries to make the point about discovery. They thought differently and used their observational powers to take them a level beneath the surface of their times.
Let us collect a small batch of three. The natural rate of interest, the output gap, and this notion of sustainable GDP as distinct from actual GDP. I call the latter natural growth. We see market rates, but not the natural rate. We see actual GDP, but not potential. And we see actual GDP, but not the sustainable natural rate that exists coincident with optimal debt. The latter is what you put your finger on, and it is every bit as important as Wicksell’s natural rate or the output gap.
Once you know it’s there, a marvelous reflexivity takes hold, takes you by the hand so to speak and shows you other wonders. The world is never again the same. One of these being that the 3½% growth of the 3 decades prior to 1985 is not coming back. Not unless society’s debt is brought back down to the level that obtained during those halcyon times. The growth since then – 2.5% over the 3 decades since 1985 – is actually a chimera! That is, some part of it was not “real.” For that part was obtained on the basis of “artificial” credit growth in excess of nominal growth. All the while taking the debt ratio that much higher and beyond optimal.
Which once understood, leads directly to another conclusion. That there will have to be an extended period of time (on the order of a couple decades) while actual growth is held below sustainable (that unobservable construct I call natural) so that credit can grow at a lesser rate than nominal growth, which is the only way the debt ratio can ever get back to optimal.
I would be remiss if I did not mention a final important thing. Observe how BEA actual growth ran from 1985 to 2007 at the rate of 3.1%. All this time there was some underlying natural rate and an artificial layer on top of that, that together summed up to actual. All this time the debt ratio rose, in the final leg at an exponential rate. Twenty-two years went by with the profession asleep at the switch. But finally the piper had to be paid. Ordinary Americans paid the piper in the coin of the Great Recession. But the fear is that another crisis is coming. The debt may be more manageable this next time. Some of the debt has shifted to government which is better able to bear it than households. The debt ratio today at 3.32, slightly less than the 3.46 in 2007 going into the crisis. And policymakers have probably learned some lessons. Nonetheless, the globe is worse off as global debt now stands at a record. And the US will not be immune to a systemic crisis if things go badly in Japan, Europe, or China.
By the way, it is not reasonable to dismiss the Austrians. They were not the ones asleep at the switch!
Sluggish growth after a housing bust is normal. Housing starts is a leading indicator for GDP, and it looks bright like the sun [housing starts 01/2015 is 18.7 percent above 01/2014]. I am much more optimistic for the future than Papell/Prodan, but I like graphs and estimations for 2023Q3. These are always funny.
What if GDP gets revised up post-10 years and the gap never existed?
The two leading candidates for the Republican nomination strongly support the supply theory of Reagan’s Seven Fat Years. This is much more critical to accurate forecasts of real recovery than any CBO econometrics.
Scott Walker
Jeb Bush
PLEASE SEE http://www.understandingmoney101.com
This in reply to an Anonymous post above for which there was no reply handle:
There is a lot of floundering about in a swamp here. So let’s move first to some solid ground. Your comment deals with 3 variables: potential GDP, actual GDP, and the efficacy of fiscal policy to close the gap between them. Potential GDP is like the shadow in Plato’s cave. We can never see true potential, only the shadow it casts. But we can observe the shadow’s movement. As this recovery aged, the CBO sequentially lowered its estimate-of-potential (the shadow). This leads us to the revelation that the output gap can narrow from the top down! Note that the gap is a shadow too, as one-half of its construct is shadow.
Actual GDP we take as given, that is, as solid ground. This brings us to the difficult part, the efficacy of fiscal policy. This is shadow too. So we best parse it to find out if policy has worked (or not) during this recovery to narrow (or not) the output gap (from bottom or top).
Fiscal stimulus has two branches – taxes and spending. As so-called austerity is mostly about the latter, the spending branch must be our main focus. Let us call this branch fiscal-stimulus-by-deficit-spending. We are not going to tax and spend the proceeds. We are going to borrow and spend the proceeds. Here we also have two branches – borrow funds that already exist in the marketplace. Or borrow monies created out of thin air by the central bank. If the Treasury borrows funds already in the marketplace, there is crowding out. However, crowding out has not been an important part of the recent train of events. Instead, a fairer representation of this recovery is to say the US central bank created money out of thin air to buy up the bonds that enabled the Treasury to proactively fiscal-deficit-spend. (That money creation also helped enable reactive automatic stabilizer stimulus.) Unambiguously, if money drops into your bank account like manna from heaven, you will spend more. This is what has been going on. But note carefully that this fiscal stimulus for all intents and purposes would be impotent without the money creation.
A crucial overlooked aspect here, that must be taken account of, is that everything unfolds over time; and that cause can be distant from effect. The shadows on the wall of the cave are not snapshots, but a moving diorama. Getting back to your bank account, the causal chain goes like this: manna from the Federal Reserve captured by bond issuance by the Treasury is used by the Treasury to immediately purchase something from you (at this point in the discussion it makes no difference what, it may simply have been an entitlement gift to you) thereby crediting funds to your account. Which funds you proceed to spend, thereby stimulating other spending and raising actual GDP. So the output gap narrows. Here the textbook story ends. But not the real world story!
In fact texts tell only half the story. Each time period that goes by, potential is affected by the ongoing causal flow from all prior policy. There is a cost to fiscal and monetary policy. NOTHING IS FREE! In the long-run, these costs sequentially impact potential and eventually shave it down. They impact actual as well. Costs impact from a decade ago. From 9 years ago. From a year ago. From a quarter ago. They cumulate. Their cumulative weight bends the growth path of potential down. So you get your result. The output gap narrows all right. But at some point (long past) it starts narrowing more from top down! This is precisely where we are today. We could always juice actual GDP a bit more in 2015, 2016, etc. But if we did it would only cave the top (the curve of potential) down that much faster in the out years.
This is not in the textbooks. It’s no wonder laymen do not understand. Your professors didn’t understand. It’s not even in the economic literature yet. What are these costs? I myself do not purport to have anywhere close to the full answer . Nobody does. But that does not mean the costs are not every bit as real as the more visible and mesmerizing benefits. Observe the sequential year-to-year lowering of estimated potential by the CBO. The cumulative weight of these costs is really what you are seeing. But observers don’t interpret it this way since the CBO’s markdowns are not labeled as such. The spectacular slow actual growth of the past 6 years is also due precisely to the sequential random hammer blows emanating from past policy. The costs cumulate and fall on both actual and potential. Everyone sees the high-flying stock market. Few see that stocks are in a massive bubble, let alone that a downturn of the ̃7-year cycle is overdue.
That said, here are 3 silos into which policy costs fall: unintended consequences of QE and ZIRP, the burden of the debt, and malinvestment. Surely there are others. Bad monetary policy has completely distorted pricing in the entire free market system. How could it be otherwise as the most important price in the economy has been artificially pegged to zero for 6 years? Over many earlier years, especially since the surge of deficit spending since 2008, debt in all sectors of the economy including federal has been driven far beyond optimal. And, nothing could be clearer than that the 2000-07 housing boom created malinvestment, notably in construction and finance sectors, but dispersed far and wide as well.
How can you test the veracity of this? Here are a couple projections stemming from this reasoning to set aside and come back to. One: the CBO will downgrade potential again next year. Two: Q4-to-Q4 real GDP growth will come in below consensus (2.9%), most likely in the bottom quartile (2.4% and below).
“Bad monetary policy has completely distorted pricing in the entire free market system. How could it be otherwise as the most important price in the economy has been artificially pegged to zero for 6 years? ”
and you know what the “undistorted” prices should be? it takes a lot of hubris to say somebody is significantly distorting market prices but cannot say what the correct price is, no?
A plan for Greece using an FAA:
http://www.prienga.com/blog/2015/2/19/a-program-for-greece
JBH First, I’m glad that we agree the authors were not slamming R&R’s book. Misreadings happen all the time. I’ve been known to misread a few things myself.
I don’t think anyone believes that carrying lots of debt is a good thing for nations or individuals. Other things equal, I’d be much happier if the debt/GDP ratio was half of what it is. That’s one reason I opposed the Bush tax cuts. That’s why Bush should have increased taxes in 2003 rather than come out with another bowl of plutocrat party punch. But when the Great Recession hit we did not have much choice but to run large deficits. With interest rates at the ZLB the only proven and reliable policy tool available was fiscal policy. I never thought the ARRA was anywhere near big enough or backloaded enough. It was good enough to stop the bleeding but not powerful enough to heal the wound. Still, we did better than other countries that went the austerity route.
If you want private households and businesses to save and deleverage in the wake of a large financial recession, then some entity has to be willing to accept that saving. Some entity has to be willing to offer the necessary financial assets that make saving possible. Some entity has to be willing to borrow in order to enable private individuals and businesses to deleverage. Only the US government was in a position to offer a safe haven for private savings, and to do that the government had to issue debt. That means running a deficit and increasing the debt/GDP ratio. There’s just no escaping the logic here unless you want to all private savings to leak out of the income flow, which would only make the recession worse. Don’t confuse saving with putting coins in a piggy bank. Coins in a piggy bank are unproductive and represent income leakages.
Now, to be fair I take your reference to kids today not putting coins in a piggy bank to really mean that people today lack patience and are unwilling to defer gratification. As Keynes once quipped, successful capitalists embody the “perpetual postponement of pleasure” principle. Maybe you should blame Dr. Benjamin Spock, or perhaps MTV back when it actually showed music videos. I dunno. That kind of social theorizing is above my pay grade. I’m also not a big fan of endogenous historical cycles which is basically the language of Hegel and Marx. I don’t see a lot of difference between Austrian inspired stories about endogenous historical business cycles and a far left-wing dialectical imagination. I suspect you might be an unknowing conservative version of Herbert Marcuse fresh out of the Frankfurt School. Hey if you want to be a Herbert Marcuse theorizing about libido gratification and repression, then you might want to read his “Eros and Civilization.” It’s a classic.
JBH, you’re a gift to this blog and to the larger inquiry and understanding of our time, affirming and inspiring my own research, inferences, and expectations, if I may be so immodest.
Slugs, likewise, you present a well-informed, well-intentioned, I wager, juxtaposition to, and deepening of, the ongoing discussion/debate that frames well the issues and inspires me to revisit and test my own point of view and its support.
Thanks, gentlemen.
P.S. I’m not purposefully omitting the contribution of other worthy participants, only highlighting JBH and Slugs for their particularly noteworthy exchange above.
P.S.S. Thanks to Profs Hamilton and Chinn for the opportunity, forbearance, and good faith to permit us to share and engage with one another on this forum: good karma, and let’s hope equally good mutual understanding. Peace.