This is in excess of the consensus of 230K [0] From BLS:
Total nonfarm payroll employment rose by 257,000 in January, and the unemployment rate was little changed at 5.7 percent, the U.S. Bureau of Labor Statistics reported today. Job gains occurred in retail trade, construction, health care, financial activities, and manufacturing.
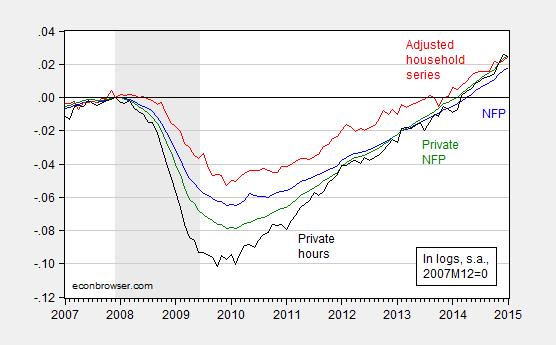
Figure 1: Log nonfarm payroll employment (blue), household employment series adjusted to NFP concept (red), private nonfarm payroll employment (green), average weekly hours index (black), normalized to 2007M12=0. NBER defined recession dates shaded gray. Source: BLS, NBER, and author’s calculations.
Additional discussion from Furman/CEA. For those concerned about the impact of the decline in the labor force participation rate, the post includes an assessment of the demographic and cyclical components of the decline.
http://apnews.myway.com/article/20150206/us–economy-5c2022abd1.html
QED
BTW, US Treasury withholding receipts do not comply with the reported accelerating employment data. Receipts imply a peak in June-Oct 2014 and deceleration of growth since. The latest data YTD suggest no faster than ~2% SAAR for real GDP for Q1 2015.
???
It’s uncertain when’s the best time to raise the minimum wage.
Perhaps, now is the best time, since strong job growth has taken hold.
Largely because of weakness in mining and construction the work week weakened and the index of aggregate hours worked only rose 0.2% — the trend monthly increase since the bottom of the recession. Moreover, the year over year change and three month growth rate of average hourly earnings showed no signs of strength.
I would not get too sure that this employment report signaled an acceleration in real growth. Note that in 2014 real GDP growth was 2.4% as compared to 2.3 % and 2.2% in 2012 and 2013. respectively. But everyone is convinced that growth accelerated in 2014.
2014’s GDP growth is not yet final, Spencer, and after yesterday’s trade data we could see Q4’s rate revised down a half a percent…that would make 2014’s growth rate indistinguishable from that of 2012 and 2013..
Spencer and rjs, yes, the cyclical trend rates of ~2.3% real GDP, ~2% real final sales, and ~1.3% per capita real final sales (vs. 2-2.25% before 2008) are against the post-2000 and post-2007 trend rates of 1.6%, 1-1.3%, and near 0% respectively, which is likely as good as it gets as part of the post-2007 “secular stagnation” from the permanent structural constraints from Peak Oil; Boomer demographic drag effects; excessive debt to wages and GDP; labor returns to GDP at a record low; decelerating real productivity; fiscal constraints per capita; net cost to private economic activity from dis-ease care, education, and debt service; and obscene wealth and income inequality constraining money velocity and thus the effects of reflationary central bank policy.
I would also like to point out another important analytical point that everyone seems to be ignoring.
That point is the quite sharp slowdown in productivity growth. As of the 4th Q the year over year growth in productivity is zero.
This means that unit labor cost is now rising faster than price increases. The spread between these two variables is a major, major, major determinate of profits growth and it suggest that it will be extremely difficult to achieve profits growth in 2015. In turn, profits growth is also a major determinate of business fixed investment, something many are counting on to pull the economy along in 2015.
Moreover, I would like to open for discussion a very different way to look at the recent stronger employment growth and suggest that it is being driven more by the weak productivity rather than accelerating real GDP growth.
Spencer, there is some evidence of labor hoarding, as well, which is typically a late-cycle phenomenon. Labor costs are being affected by rising “health care” insurance costs (revenue flows to insurers, primarily).
Also, the historical cyclical precedent for reported earnings during debt-deflationary secular bear markets implies that earnings will contract in 2015-16, which tends to coincide with bear markets and recessions, which are due.
BTW, if one examines the sum of real profits after tax, depreciation, and inventories, real gov’t receipts, and real personal income less transfers and debt service, the US economy decelerated to stall speed in 2014. The 4-qtr. average is not accelerating and is well below the rate at which recessions occurred historically.
However, the uneconomic, unsustainable shale oil boom/bubble has had an overwhelmingly disproportionate effect on skewing higher industrial production via orders and goods production for the shale oil and gas and energy-related transport sectors, a situation that is now poised to weaken significantly and contract in H1 2015, dragging on overall orders and production hereafter at SAAR and YoY rates that will likely surprise, if not shock, most economists.
Moreover, too many are placing too much confidence in the LEI to signal a recession, therefore, there is no indication to be concerned about a recession. However, there are several indicators within the LEI that are no longer leading indicators as was the case prior to 2007-08, including stock prices (lagging indicator since the late 1990s as a result of the hyper-financialization of the economy); real M2 (does not take into account the surge in bank cash assets/reserves that make money supply appear that it is growing faster than it is); and the yield curve, which does not invert during debt-deflationary regimes, as in the case of Japan since 1992 and the US during 1931-54.
I’m not sure that labor cost are rising because of higher health insurance cost. In the compensation data wages appear to be accelerating some, but benefits growth remains flat.
In the compensation series there is an unpublished cost of health care benefits. It is unpublished because the data may not be good enough to be reliable.
But anyway, it shows that the growth in health benefits has slowed from 3.0% in 2013 to 2,4% in 2014. The 2014 percent increase is the lowest on record.
What data do you have that health insurance cost growth is accelerating?