The stock market continued to decline today, despite vigorous efforts by the authorities. That being said, perspective is required.
The NYT has some good coverage on ongoing stock market developments [1] [2], and why they have occurred.[3] Figure 1 places the current bust in context:
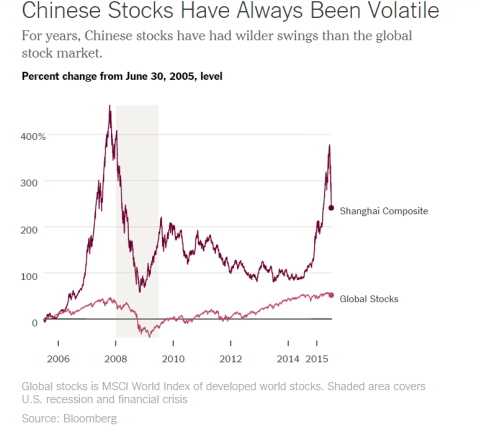
Source: The Upshot/NYT.
Briefly put, there are few alternatives for saving in China. The formal banking system provides negative returns (low deposit yields, lower than inflation typically). Housing is no longer returning positive capital gains — partly as a consequence of deliberate policy actions to moderate a perceived housing bubble. So, what’s left (given you can’t easily save in overseas assets)? Equities. We have a typical boom-bust phenomenon, amplified by underdeveloped financial markets, opacity in valuations, and uncertainty regarding the government’s intentions (and will-power).
But (as befits a macroeconomist), I still think the big picture is the trajectory of the real economy. And here, I think it’s just a matter of how “cool” it becomes. For those who want to see a whole plethora of indicators, go to World Economics’ China Growth Tracker page for July. Quick plots of other data is here at TradingEconomics. People can do their own version of the Rorschak test…
For links to more in-depth analyses of the economic outlook (from the World Bank), and the need for further financial reform, see this post. For discussion of longer term reform needs, see here.
Menzie,
Thanks for a post of reason in the midst of “chicken littles.”
Yes, thanks for this.
I looked at the China Growth Tracker. If you can make sense of it, do post on it. I cannot establish a clear narrative out of the graphs. Maybe China’s recovering from recession, may growth continues to ease off, maybe nothing much is changing, maybe the collapse of the stock market is presaging a global recession, as it did last time. For the life of me, I can’t tell.
Steven, US and Japanese FDI to China peaked and turned negative in 2013-14, and US firms and expats have been voting with their feet before and since.
By definition, that means a negative multiplier to Chinese production and exports.
Net of China’s exports, fixed investment, production (see private Markit Survey showing no growth, although China reports 6% YoY growth), and gov’t spending (including continuing to direct lending for unproductive fixed investment, which the CCP technocrats make up to hit their fictitious target) is a wash at present. The only thing contributing to net growth are wages and consumer spending at ~3.5% nominal.
If one believes the deflator (I don’t), real YoY growth is thus ~4.7% with deflator deflation.
Using CPI instead, real growth is ~3.5% YoY and ~3% real per capita.
Using core CPI, real growth is ~3.1% YoY and ~2.6% real per capita.
But note that China’s labor force has been contracting for three years running with a reported real productivity rate of no more than ~1%, which implies a potential real GDP of less than 1% and near 0% real per capita, which is the trend rate for the US, EZ, and Japan per capita since 2007-08.
This is precisely what one would expect as a result of China having reached the “middle-income trap, real trade per capita for 65-70% of the world economy decelerating to ~0%, and peak Chinese boomer demographic drag effects beginning to take hold in recent years as began in Japan after 1997-98 and the US in 2005-08.
From 2008-09, China’s alleged 7-10% real growth contributed to 50-75% of net global real GDP per capita over the period. China’s growth per capita is done. The CCP elites and their surrogate technocrats are making it up now.
With production and exports no longer growing, real estate and stock bubbles bursting, the CCP officials are desperate to inflate bubbles (“financialize” the economy as has occurred in Japan and the English-speaking world since the 1980s-90s) in order to create a dubious “wealth effect” (really a “rentier claim effect” on wages and GDP) to encourage more consumer spending as a share of wages and GDP just as global growth per capita is flatlining, US and Japanese FDI is fleeing, and demographics are dragging on the economy.
Therefore, this is principally why commodities prices have crashed, US, Japanese, and Asian production is decelerating or not growing, and the global economy is closer to “stall speed” or recession than most realize or (publicly) admit.
Technically, WTI could be setting up to retest the earlier low with a potential stop in the low to upper $30s, i.e., indicative of a recessionary trend for growth of demand.
But this outcome was implied as long ago as Q3-Q4 2014 when the 4-qtr. average of the sum of real profits, real income less transfers, and real gov’t receipts decelerated below “stall speed” to date.
Finally, the 12-month average of US Treasury withholding receipts to wages and salaries implies that US employment peaked in Q2-Q3 2014 (before the price of oil began to crash) and is barely growing YoY, if at all. Employment could be overstated by as much as 1% or more. In fact, the cyclical change rate of receipts is decelerating to the same rate as occurred in spring 2008 and summer-fall 2001, i.e., when recessions had already begun.
Textbook business cycle stuff.
The Shanghai Index exhibited the classic textbook, log-periodic, super-exponential blowoff as occurred in 2007. The typical outcome for the so-called “anti-bubble” (crash) regime that follows is to “correct” (wipeout) all of the gains that occurred from the onset of the super-exponential acceleration. This implies that the Shanghai Index is eventually headed back to 2000 or below. Overshoot below is not uncommon historically.
Similarly, there are numerous individual US equities and equity indices that have traced out their own blowoffs, including AAPL, biotechs, NFLX, TSLA, semis, and even the S&P 500 (SPX) since 2012-13. That is to say, the typical outcome is a ~50-65% decline.
In fact, AAPL and biotechs have completed a commonly recurring longer-term technical pattern suggesting that the next bear market will “correct” 50-65% of gains going back to 1998-2002.
Moreover, the SPX since late 2013 and early 2014 has now exhibited a long list of exceedingly rare, simultaneously occurring conditions that have coincided only twice going back to the 1920s: 1929 and 2007.
The Fed and TBTE banks have yet again contributed to the largest debt/asset bubbles in history. All bubbles burst. The biggest bubbles burst spectacularly. China’s fixed investment and credit bubbles are the largest in world history. The bubbles are bursting, first with real estate, now equities, and eventually corporate and bank debt that will spread to the rest of Asia and emerging markets.
Greek and Puerto Rican defaults are inescapable, as is the bursting of China’s debt/asset bubbles.
The implication is for a financial meltdown that equals or exceeds 2008-10, including the Fed being required to resume QEternity and federal bailouts and $1 trillion deficits.
Of course, the central banks will run political cover for the TBTE banks as is their (unspoken) mandate, accepting the blame for the bursting bubbles without consequences, while all ignore the Fed’s complicity in blowing the bubbles in the first place on behalf of their TBTE bank owners and Wall Street.
Same as it ever was . . .
recent government crackdown on government corruption is having an impact on the chinese economy. officials are having a hard time “investing” their bribery money due to the possibility of prosecution. look at the recent downturn in casinos in macau. the chinese collectibles industry (art, antiques, etc) has also slowed significantly. i would imagine many officials also had money in the market, but have been pulling it in light of recent corruption investigations. obviously not the whole story, but certainly a component of the problem.
as for the stock market behavior, my understanding is stocks are rather easy to purchase, but the selling process is not consumer friendly. it apparently is difficult for retail investors to sell at the time and price they would like. apparently we are rather spoiled by the online internet brokerages available in the us markets to everyday folks. this sell side problem apparently makes people more skittish when a downturn appears.
baffling: The so-called anti-corruption program has been in effect for several years now; however, the slowdown is of a more recent vintage. So, it might be true that the campaign is part of the slowdown story, but I suspect not the largest.
recent discussions with some people who were involved in the collectibles trade in china felt the lack of buyers recently was related to the crackdown. one thought was collectibles are bought by private folks and given to government officials. those officials are becoming more hesitant to accept the gifts, and it is only recently that the private sector has acknowledged this and cut back on the purchases. they also could be cutting back on purchases because they fear future economic conditions-hard to say. this was merely anecdotal, but direct from the chinese mainland. obviously its not a major contributor to the stock market behavior-but perhaps an indicator of some concerns in china itself. just thought i would share the info.
Thank you for yesterday’s reply, but I repeat my question: why did stocks fall for 4 years between 2010 and 2014, while the economy was growing approximately 10%/year? And then suddenly spike?
“Briefly put, there are few alternatives for saving in China.”
The trillions of dollars of destroyed wealth, in the stock market, likely represents China’s safety net going up in smoke.
Chinese are big savers. The “middle class,” may be 300 or 400 million urban Chinese earning $6,000 to $25,000 a year, according to a link below.
Many likely send money to their dirt poor families – perhaps 1 billion people living in villages – which they depend on.
Perhaps, even the “lower middle class” was captured in the massive speculative bubble before it burst.
Now, a lot of savings is actually gone.
http://www.chinabusinessreview.com/understanding-chinas-middle-class/
“…uncertainty regarding the government’s intentions (and will-power).”
From a Reuters article today:
“Beijing’s increasingly frantic attempts…finally rewarded as Chinese shares bounced around 6 percent on Thursday, but the costs of heavy-handed state intervention are likely to weigh on the market for a long time.
Beijing…”decisive” role…responded with a battery of support measures, including an interest rate cut, suspension of initial public offerings and enlisting brokerages to buy stocks, backed by cash from the central bank.
The China Securities Regulatory Commission said…on Wednesday… that holders of more than 5 percent of a company’s stock would be barred from selling for the next six months.
In the latest salvo against short sellers…police were investigating suspected “malicious” selling of shares…authorities would “punch back” with a “big fist” against illegal activities.
China’s malfunctioning stock markets remained semi-frozen, with the shares of around 1,500 listed companies worth around $2.8 trillion suspended, and many of those still trading propped up by state-directed buying.
Such intervention locks up ownership of shares, reduces liquidity and creates an overhang that could plague the market for years.”
http://www.debtdeflation.com/blogs/2015/07/09/will-we-crash-again-ftalphaville-presentation/
Good job, BC. Shortly after my 1:09 PM post here, I followed your link through to Steve Keen’s Powerpoint presentation. Final slide: Crisis in part a product of bad economic theory. Realistic “Minskian” economics warned of dangers of rising private debt. Unrealistic “Neoclassical” economics ignored it. Business needs realism in economics—leave ideology to political scientists. Most Universities only teach mainstream Neoclassical theory. New “CORE” curriculum just as bad on this front.
Amen … with but one important correction. The crisis was not just in part but closer to wholly a product of bad economic theory. The chain of causality starts with what the profession teaches our political and business leaders, including Congress, the Fed, Regulators, etc. It cannot but be any other way. If the first link were impeccably correct, the following links would all look far different. No other science can get away with the kind of malinformation that comes out of economics. Suppose chemistry taught its students that water is H3O. Imagine the predictive results. Society would not stand for such nonsense. Alas, economics is too complex with many moving parts. So society cannot clearly see the grotesque errors of economic theory that have degraded the average man’s standard of living.
Federal Reserve causes housing bubble. In wake of crisis, China becomes global locomotive. Does so by pushing credit. Credit grows far in excess of GDP. All good things must come to an end. Beginning of end comes in late-2013. Credit impulse (second derivative) goes negative. Always with credit there is a lag. Six months later crude oil bubble bursts. Market manipulation in China perpetuates stock bubble. Now that bubble has burst. Not all bear markets signal recession. Context is important. Current context, however, does imply “recession” getting underway in China. Japan on stretcher. Eurozone on operating table. In this environment the US cannot grow faster than 2%. No sign of US recession yet. First necessary condition is bear market. Also housing permits, consumer sentiment, and unemployment claims (inverted) must go down. The present context dictates US growth falling to 1½% in 2016. More importantly, day of grand reckoning draws closer. Can’t know exactly when much in advance. When it does come, next crisis will be crushing due to unintended consequences of ZIRP and QE. And the historic level of debt in all four big economies. Debt, leverage, potential for global financial contagion, monetary policy far beyond the pale, resource malinvestment that will burst forth, and more. You will not find this comprehensiveness in textbooks. Since predicatively this is what will happen, the inescapable conclusion for the perspicacious reader is the textbook is wrong.
Orthodox theory says sustainable growth is optimal growth.
It has been shown, monetary and fiscal policies help smooth-out business cycles.
For example, when the economy slows too much, taxes should be cut, and when the economy speeds-up too much, taxes should be raised.
Debt, or liabilities, while ignoring assets doesn’t mean much. Chart:
http://www.advisorperspectives.com/dshort/charts/index.html?Z1/Real-TNWBSHNO-with-regression.gif
You can praise the Fed later.
And, the amount of debt is unimportant.
What’s important is can you afford the debt.
(And, most people live month-to-month). Chart:
https://research.stlouisfed.org/fred2/series/TDSP
http://ineteconomics.org/ideas-papers/blog/the-rise-of-financialization-has-led-to-lower-living-standards-and-reduced-growth-in-the-u-s
http://papers.ssrn.com/sol3/papers.cfm?abstract_id=2571897
http://www.neweconomics.org/publications/entry/inequality-and-financialisation
Peak, rarely acknowledged and thus virtually never discussed is that total net annual flows to the financial sector now equal total annual GDP output, i.e., hyper-financialization of the economy. Financialization is not limited to the financial sector but also prohibitively costly health care, which is significantly financialized by the insurance industry, as well as what is now similarly prohibitively costly higher education, which has been increasingly financialized via gov’t-guaranteed student loans.
The sum of total gov’t spending, private health care and education, and debt service is now an equivalent of 54% of GDP. These sectors have grown together with increasing financialization of the economy since the 1980s. These sectors have cumulatively grown as a share of GDP along with the feminization of the labor force and economy, with these sectors’ employees being 65% to 80-85% female. It is not a coincidence, therefore, that productivity has peaked and begun to decelerate (even contract) coincident with the peak in feminization of the labor force, hyper-financialization, and gov’t, health care, education, and debt service exceeding 50% equivalent of GDP.
There can be no net growth of real output per capita hereafter less rentier claims/flows to the top 0.001-1% to 10% owners of financial assets and primary recipients of the flows. Financialization, central bank-induced massive debt/asset bubbles, wealth and income inequality, and decelerating growth of productivity, wages to GDP, and real final sales per capita are inextricably linked.
Thanks Fed/TBTE banks, but no praise for that.
http://www.voxeu.org/article/effects-income-inequality-economic-growth
http://www.voxeu.org/article/wage-inequality-and-firm-growth
Besides, extreme wealth and income inequality has the top 1-10% to 20% holding 40-85% to 93% of total US financial assets. The bottom ~80-90% effectively have no financial assets.
Household debt service as a share of income has declined because the bottom 80-90% of households are poorer than in 2000-07.
Consumer credit: https://research.stlouisfed.org/fred2/graph/fredgraph.png?g=1qih
Less auto loans: https://research.stlouisfed.org/fred2/graph/fredgraph.png?g=1qil
Student loans: https://research.stlouisfed.org/fred2/graph/fredgraph.png?g=1qim
Consumer credit less auto and student loans: https://research.stlouisfed.org/fred2/graph/fredgraph.png?g=1qip
https://research.stlouisfed.org/fred2/graph/fredgraph.png?g=1qiE
Student loans held/guaranteed by the US gov’t have quintupled since 2008-09 with little or no multiplier to final sales.
https://research.stlouisfed.org/fred2/graph/fredgraph.png?g=1qiJ
Consumer credit less student loans as a share of final sales is still higher than in the average of the 1970s-80s.
https://research.stlouisfed.org/fred2/graph/fredgraph.png?g=1qiN
https://research.stlouisfed.org/fred2/graph/fredgraph.png?g=1qiU
But that is attributable to auto loans, which are growing incrementally because of subprime auto loans.
https://research.stlouisfed.org/fred2/graph/fredgraph.png?g=1qiZ
https://research.stlouisfed.org/fred2/graph/fredgraph.png?g=1qj7
Credit less student loans Q1 began to increase YoY as a share of final sales and PCE but still at a modest rate and obviously as a consequence of the deceleration of final sales. The previous two times this occurred was at or near the cyclical peaks and “stall speed” in 2000 and 2007.
https://research.stlouisfed.org/fred2/graph/fredgraph.png?g=1qjb
Credit less student loans is still at an historically recession-like rate YoY.
https://research.stlouisfed.org/fred2/graph/fredgraph.png?g=1qjH
https://research.stlouisfed.org/fred2/graph/fredgraph.png?g=1qjJ
https://research.stlouisfed.org/fred2/graph/fredgraph.png?g=1qjN
And it’s not inconceivable that auto sales and loans have peaked for the cycle with those employed age 25 to 54.
One more point is that US non-financial corporate debt to GDP is now at the same levels as in 2007, 1929-30, and 1887-93, as well as in Japan in 1987-95. A growing share of this debt in the US has gone to buy back shares to reduce float and artificially goose earnings per share with revenues averaging 2-3% since 2007-08; again, another manifestation of financialization.
Thus, Peak, WRT to debt, I suggest that you are missing the dynamics associated with excessive debt and asset bubbles to wages, profits, and GDP, which in turn coincides with the pernicious effects of financialization and inequality, resulting in a once-in-a-lifetime drag effect on growth and the increasing risk of a debt-deflationary collapse, economic dislocation and hardship for the bottom 90%, fiscal austerity, and factors that encourage class envy and resentment, social instability, political polarization, and eventually reactionary gov’t policies.
PeakTrader,
The level of debt would indeed not mean much in a world where the following hold. (1) Each and every debtor has sufficient assets at all times to cover interest and principal payments coming due so as to never be in arrears when for one reason or another normal income or revenue flows fail, even temporarily. (2) This implies leverage ratios that never go beyond a certain threshold into a zone of unmanageable risk. (3) In an inherently uncertain world, it also implies that the degree of uncertainty never rise beyond some minimum threshold so that fat tail (black swan) events never occur. (4) At all times asset markets are highly liquid and not subject to freezing up and spiraling downward in fire-sale fashion. (4) Leverage and asset prices must not get too high in normal good times. And in bad times when the outlook is bleak and uncertainty greater, asset prices and leverage must not get too low. (5) This is a world where market crashes never happen. (6) In this world, financial innovation never runs beyond the means of the economic, financial, and regulatory system to contain it. (7) Political values never run beyond or subvert prudent finance and sensible economic valuation (e.g. as is what’s happening in the Euro project). (8) Newly-issued credit will finance only projects that directly or indirectly can reasonably be expected to generate a future revenue flow out which interest and principal and other maintenance costs can be dependably repaid. (9) It is a world where complexity is bounded so it cannot grow exponentially. (10) And for good measure, political and financial corruption would be bounded as well.
The chart you link to is an aggregate. As such it is silent on these things. Who knows what hides behind the veil of an aggregate. Without boring deeper, real understanding is not possible. You’ll be right in good times, but catastrophically wrong in bad. Certainly prices alone do not suffice! A way to think about this is moments – mean, variance, skewness, and kurtosis. Another way is by functions – level, first, second, and third derivatives. Your wealth aggregate is level only, imparting far too little information. Knowing these and other elements that underlay debt and asset values, puts aggregate wealth in an entirely different light. It is only loosely tethered to physical reality. How can air castles possibly not form as the base money itself that enables nominal wealth is created out of thin air!
JBH, again, we agree (and you more often than not put it much more succinctly and eloquently than I do).
BC:
Two thoughts. Consider the Art of Plain Talk by Rudolph Flesch. Copyright 1946! Cheap copies on Amazon. One reviewer said: “Once upon a time, long ago and far away, my Uncle Ian gave me a copy of The Art of Plain Talk by Rudolf Flesch. I was 19-years-old. It had a great impact on me and my writing. I have always been a lover of words and writing; I have earned my living as a writer, journalist and editor all my life. This is the best book on writing I have ever read.” I absolutely concur. I took pages of notes and carry them with me to this day. Second thought. Each minute you spend polishing your thoughts translates into many minutes saved by others when many read them.
Further. Over the years I’ve developed a theory. The geniuses in a field write with the greatest clarity. Read Crick and Watson on the Double Helix, anything by Richard Feynman, Euclid on geometry, and so on and on. These rare individuals know their subject matter to such incredible depth that it was second nature for them to surface and distill the essence of what was down there for others. The two bookends in economics are Menger and Keynes. The one started at bedrock and worked his way up one brick at a time so that by the end the reader had no doubt. The other dashed admittedly brilliant thoughts onto paper willy-nilly, evidence he’d only scratched the surface of his subject , so to speak. The profession pays for that today. I’d also recommend Buckminster Fuller’s Critical Path. And anything by Kenneth Boulding. The latter two wrote with crystal clarity.
Thanks, JBH. Good stuff. We agree.
Core orders are contracting and IP mfg. decelerating since Q4 2014. US Treasury withholding receipts against reported wage and salary disbursements imply that US employment peaked last summer-fall and is barely growing YoY. We won’t know this until revisions long after the fact.
Recessions tend to begin on the production side.
Historically “stall speed” has been ~2%, which is around the ~9-year change for real final sales/GDP. However, since 2000 and 2007, the 9-year rate has decelerated from an average of 2-2.25% to 1.6% and 0.5%; therefore, “stall speed” for the “new normal” trend for “secular stagnation” is likely to be a lot slower, perhaps below 1% to near 0%.
Also note that this secular deceleration is at a rate that is within the margin of error of the estimates for the deflator, inventories, and import prices, so this provides latitude for the BLS, BEA, and Commerce to “manage” the estimates for political purposes to avoid a recessionary print along the way. I fully expect that politics will be part of “forward guidance”, which is to say that “managing” of the data for political purposes and for public consumption will be an imperative, irrespective of party and ideology.
I don’t say this disparagingly but rather in the context of realpolitik and the Establishment institutions, politicos, and technocrats’ desire to maintain credibility (?), legitimacy (?), and personal, professional, and institutional authority, which in turn serves to secure and maintain the wealth, status, privilege, influence, and power of the top 0.001-1%, who are the principal owners of our system, for better, worse, or indifferent.
The Fed’s primary mandate is to provide the necessary reserves and liquidity needs of the Fed’s owners, the TBTE banks, as well as to run political cover for the TBTE banks’ owners’ objectives and actions. “Full employment” and “price stability” serve as palatable political objectives that serve little practical use.
In fact, one can demonstrate repeatedly that there has been anything but “price stability” for real estate, equities, and commodities since the 1970s-80s, a period to date during which the largest bubbles and subsequent busts in history have occurred.
And “full employment” is now perceived despite wages to GDP at a record low going back to the Great Depression, full-time, private-sector employment per capita at the level of 25-30 years ago, and labor force participation declining by an equivalent of ~8 million since 2000 to the level of the late 1970s.
Finally, the 4-qtr. avg. SAAR for real final sales through Q2 is 2.3% , with the 3-qtr. and YTD SAARs at ~1% or slightly less. For the 4-qtr. SAAR to maintain the current trend rate of 2.3%, the Q3 SAAR needs to accelerate to ~5% and the avg. for H2 be ~3%. I don’t see it. Rather, it appears that the economy is merely “normalizing” to the secular trend rates per capita since 2000 and 2007, including what appears to be industrial, labor, and demand capacity constraints occurring since 2014.
BC and JBH,
If money is lent to people who can’t afford to pay it back, then it’s a problem.
And, even people who borrow money and can afford to pay it back can lose their job or income.
That’s why appropriate monetary and fiscal policies, along with other appropriate government policies, are needed to smooth-out business cycles.
Otherwise, the economic booms and busts (not to be confused with asset booms and busts) would be bigger, like in the pre-Fed economy.
I stated before, if Congress tightened housing lending standards in 2004, when the Fed began the tightening cycle, the financial crisis may have been averted, and a mild recession may have been achieved.
Peak, too simplistic. You’re leaving out too many larger secular factors coalescing since 2000.
Moreover, you seem to assume that the Fed officials in their received wisdom from the policy gods unilaterally decide monetary policy. The Fed follows “the market”, i.e., the actions of the Fed’s owners, the TBTE banks.
If so, and it is demonstrably true, then it is the TBTE banks doing the work of The Almighty, therefore, it is not “the Fed” that should be congratulated and thanked but the TBTE banks and by extension The Almighty himself/herself/itself for the divine work of the central and TBTE banks.
This clearly explains why the TBTE banks have a license to steal and the Fed provides the institutional political cover for the legalized theft.
But that also indicates that the TBTE banks’ god is a rather mischievous sort who confers earthly power on a select chosen few at the prohibitive cost to everyone else. Curious.
BC,
It’s “too simplistic,” because you aren’t aware of the implications, and interrelationships, of my statements, which are based on “mainstream,” i.e. neoclassical, economics.
The Fed works in the future economy, because of lags in the adjustment process.
When you say “the market,” you should note there are many markets in a large and diversified economy.
Commercial banks provides valuable services. Their input costs are low. There are other industries with much greater input or production costs that earn higher profit margins.
Although, the number of U.S. commercial banks has declined over the past few decades, the U.S. still has many more banks than most other countries. So, it’s a very competitive industry.
On a personal note, I went to one bank (Wells Fargo) and got a deal for a loan. Then, I went to another bank (Bank of America) and showed them the deal. They immediately gave me a better deal.
And, it should be noted, the 2001-07 expansion was on top of strong growth from 1982-00, a mild recession in 2001, and increasingly larger trade deficits (which subtracted from domestic growth). Moreover, oil prices had a steep gradual rise from $10 a barrel in 1999, to $30 in 2003, $70 in 2006, and $140 in 2008.
My most recent article. Currently No. 2 read article on the UAE’s National website.
http://www.thenational.ae/business/energy/the-shale-recession-is-over-so-whats-next#full
http://www.bloomberg.com/news/articles/2015-05-03/the-shale-boom-has-already-gone-bust-at-least-for-now
http://www.bloomberg.com/news/articles/2015-03-20/shale-producers-have-found-another-lifeline-shareholders
http://www.bloomberg.com/news/articles/2015-07-01/shale-driller-losing-their-insurance-against-price-drops
http://www.wsj.com/articles/back-to-the-future-oil-replays-1980s-bust-1421196361
The shale oil and energy-related transport bubbles have burst and the bust has barely begun.
http://schrts.co/QrytSg
http://schrts.co/XXM9of
http://schrts.co/fWVBxE
http://schrts.co/xINyZC
A confirmed Dow Theory sell signal for equities occurred and was confirmed earlier this year, aligning with similar conditions as in 2011, 2007, and 2000.
http://schrts.co/uFkrxt
http://schrts.co/0a5OIU
http://schrts.co/50VTqn
http://schrts.co/QkQQJa
The bubbles in the financialized sectors (financials, biotechs, and health care) and AAPL have prevented the overall equity market from rolling over with orders, materials, commodities, and IP mfg.
http://schrts.co/COerBm
https://research.stlouisfed.org/fred2/graph/fredgraph.png?g=1qlT
But junk is rolling over again with the Chicago Fed’s ANFCI spiking above zero with the Baa spread expanding again as during the crises with Lehman, Bear Stearns, Asian Crisis, LTCM, and the Russian Default, the S&L Crisis, 1987 Crash, Continental Illinois, and the recessions in 1974-75 and 1979-82.
ZIRP, NIRP, QEternity, “forward guidance/giddiness”, and extreme investor bullishness and complacency are resulting in few paying attention (or saying so publicly).
But the same can be said about sentiment prior to Lehman (economy was in recession for nearly a year at the time); Bear Stearns (recession was beginning that no one claimed to anticipate, Bernanke said real estate CDO junk was a “contained” risk, and the Fed began cutting the funds rate); 9/11 (like before Lehman, the economy had been in recession for nearly a year, but the consensus expectation was a “soft landing”); Hussein’s invasion of Kuwait (the economy had been in recession since late 1989); and the 1987 Crash (we have portfolio insurance).
And now we have the incipient shale and energy-related transport busts with oil junk debt at risk. Puerto Rico and Greece are poised to default (or de facto). China’s real estate and equity market bubbles have burst as growth in China is likely no faster than 2-3% real and ~0-1% real per capita potential. Emerging market economies are flagging and the debt is at risk. Canadian and Australian real estate bubbles are bursting, setting up debt deflation, a recession, and a bloodbath for lenders. US TBTE banks’ offshore shadow banking pass-through entities are levered 50-80:1 for equity index futures, far more than in 2007-08, implying the increasing risk of another levered global derivatives implosion and debt-deflationary wipeout, requiring resumption of QEternity by the Fed, more bailouts, and $1 trillion deficits.
But no worries, mates! Let’s party like it’s 2007-08, 2000-01, 1989-90, 1987, 1973, 1937, and 1929! It’s all good!
Oil demand:
http://www.cbc.ca/news/business/growth-in-oil-demand-slowing-even-as-supplies-still-grow-iea-1.3146420
http://www.iea.org/newsroomandevents/news/2015/july/iea-releases-oil-market-report-for-july.html
http://www.yardeni.com/Pub/globdemsup.pdf
How much of recent growth of “oil” demand is from growth of consumption by the energy and energy-related transport sectors to increase production/supply of “oil”?
http://www.thehillsgroup.org/
http://www.thehillsgroup.org/depletion2_018.htm
An untold aspect of the Peak Oil story.
During the stock market crash one shrewd Chinese broker was able to turn $10,000 into $350,000.When asked by a customer who had lost money with the same broker how he was able to do it, the broker replied, ” a customer broke my legs the insurance paid”.
it will be broken soon