U.S. oil production has begun to drop in response to low oil prices, but not as dramatically as many had anticipated.
Oil companies have cut back spending significantly in response to the fall in the price of oil. The number of rigs that are active in the main U.S. tight oil producing regions– the Permian and Eagle Ford in Texas, Bakken in North Dakota and Montana, and Niobrara in Wyoming and Colorado– is down 58% over the last 12 months.
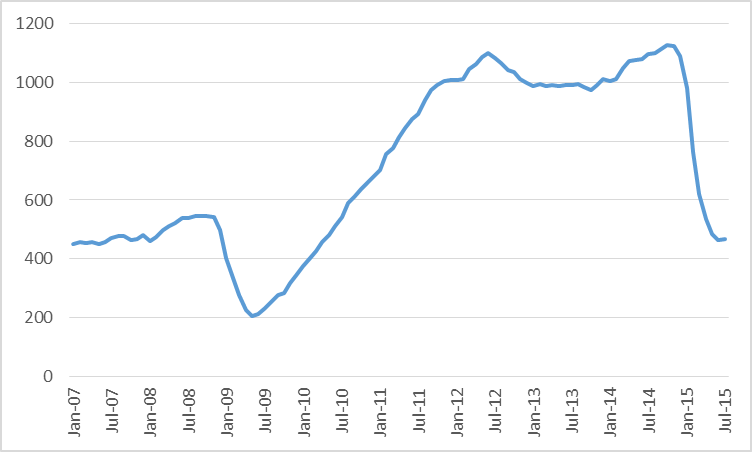
Number of active oil rigs in counties associated with the Permian, Eagle Ford, Bakken, and Niobrara plays, monthly Jan 2007 to July 2015. Data source: EIA Drilling Productivity Report.
Nevertheless, U.S. tight oil production continued to climb through April. It has fallen since, but the EIA estimates that September production will only be down 7%, or about 360,000 barrels/day, from the peak in April.
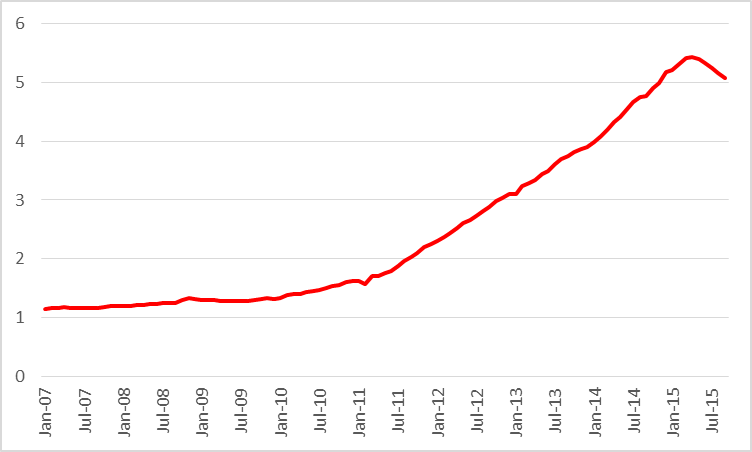
Actual or expected average daily production (in million barrels per day) from counties associated with the Permian, Eagle Ford, Bakken, and Niobrara plays, monthly Jan 2007 to September 2015. Data source: EIA Drilling Productivity Report.
This is despite the fact that typically output from an existing well falls very quickly after it begins production. The EIA estimates that tight oil production from wells that have been in operation for 3 months or more has declined by 1.6 mb/d since April, as calculated by the sum of the EIA estimated monthly declines in legacy production from May to September.
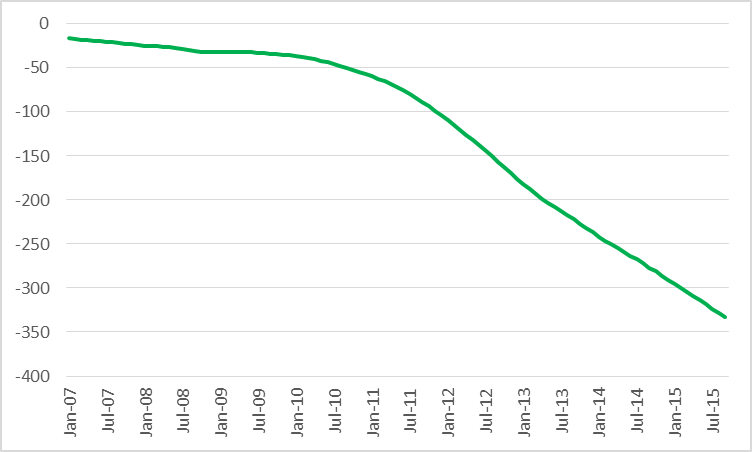
Legacy production change (month-to-month production change, in thousands of barrels per day, coming from wells in operation 3 months or more) in counties associated with the Permian, Eagle Ford, Bakken, and Niobrara plays, Jan 2007 to Sept 2015. Data source: EIA Drilling Productivity Report.
One would think that these decline rates from existing wells and the drop in the number of rigs drilling new wells would mean that production would have fallen much more dramatically. Why didn’t it? The answer is that there has been a phenomenal increase in productivity per rig. For example, the EIA estimates that operating a rig for a month in the Bakken would have led to a gross production increase of 388 barrels/day two years ago but can add 692 barrels today.
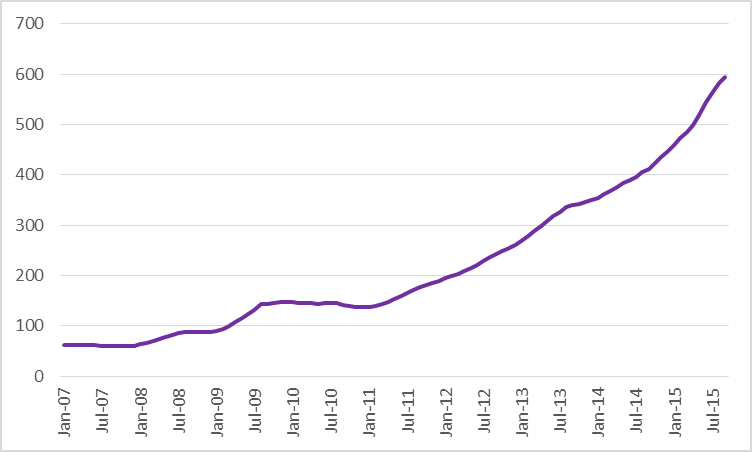
Average productivity (added gross daily barrels per month) per drilling rig from counties associated with the Permian, Eagle Ford, Bakken, and Niobrara plays, monthly Jan 2007 to September 2015. Data source: EIA Drilling Productivity Report.
A key factor in the productivity gains is that companies are finding ways to complete wells faster, so that more wells can be drilled each month from the same number of rigs. For example, The Barrel reports that Occidental Petroleum “has seen a 40% decrease in spud to rig release time in the Wolfcamp area of its Permian holdings from 43 days in 2014 to 26 days in March this year with a target of eventually reaching 16 days.”
The modest drop in U.S. production has been enough to start to bring inventories down. U.S. crude oil stocks last week were down more than 30 million barrels from April. But that still leaves them way above normal.
Source: EIA This Week in Petroleum.
The drillers’ cash flow is assisted not only by the improvements in efficiency just mentioned but also by the fact that the drop in demand for rigs means companies are seeing drops in day rates and other costs. Even so, major shale producers like EOG, Whiting, Pioneer, and Devon reported before-tax losses each of the last two quarters.
West Texas Intermediate averaged $53/barrel the first six months of this year. Last week it went as low as $38 before rebounding back to $45 by the end of the week.
Losing money is obviously not a sustainable business model, yet inventories have to come down further. Meanwhile, elsewhere in the world, Iraq oil production is up half a million barrels a day from a year ago, and Iran hopes to raise oil production by up to a million barrels a day once sanctions are lifted. Economic prospects for China, the world’s second-biggest oil consumer after the United States, are cloudy.
Another part of the adjustment process is also underway, coming from the big cuts in capital expenditures for exploration and production for more conventional oil fields. This will also affect supply, but with significantly longer lead times than is the case of production of tight oil.
Gains in efficiency, lower costs of inputs, and, in the case of production outside the United States, appreciation of the dollar have all helped lower the marginal cost of producing oil. Even so, the current price is well below the marginal cost, meaning one of two things has to happen. Either the price must rise or output from the higher-cost producers must fall further.
Professor Hamilton,
What world GDP growth would reverse the trend of lower oil prices given the new drilling efficiencies that would create new supplies fairly quickly? How likely do you think world GDP growth will increase oil prices in the next three to five years?
Prof. Mark Perry had a slightly different perspective on the dynamics of shale oil in the U.S.
http://www.aei.org/publication/shale-oil-a-tremendous-development-for-u-s-oil-production-shovel-ready-jobs-economic-growth-and-energy-independence/
The drop in U.S. production is reasonable considering the no-return on investment at current prices. The point is that current prices are most likely temporary and U.S. shale production can be geared up rather quickly if prices recover a bit. There seems to be quite a range of where the break-even point for shale oil is: http://www.cnbc.com/2015/08/20/us-crude-oils-break-even-cost-how-low-can-it-go.html
Drilling and completion activity can be geared up, but how quickly is a very interesting question, given the loss of experienced personnel and the loss of equipment, and given the damage to inactive rusting equipment. Also, given the enormous losses that bond investors have sustained in the value of their loans to shale players, one would think that capital will be harder to come by.
Jeffery,
Bingo!!
We are close to seeing a repeat of the late 1990s when WTI went down to $10/bbl, essentially the cost of production. Then as the economy began to recover after the Bush supply theory tax cuts oil demand pushed prices through the roof. With a House, Senate, and Presidency of supply theory Republicans we could see a repeat of the oil conditions of early 2000s.
Hopefully the efficiencies that the Professor notes will help the supply shortages and hopefully the Republicans will resist the restrictionists who will cry “over-heating economy”. They must remove production wedges allowing the markets to produce at prosperity levels.
A large part of this is the current deflationary policies of the FED. Yellen has done well to use restraint, reminiscent of Greenspan in the early 1990s, but she must resist falling prey to Greenspan’s hubris and bringing on a deflationary decline.
I don’t know. Six months? A year? Obviously there’s spare capacity if rigs are sitting “rusting”. And if there are people laid off. Probably a lot quicker to bring back a rig from cold stack than to build it new. And faster to get back laid off workers than to train new ones. (Some will still be sitting around and even those that got other jobs didn’t likely get ones that pay as much.) Net, net: easier with spare capacity than without it. [And, FWIW, you can’t simultaneously bemoan the laid off workers and stacked rigs, as some peakers have, and then say no one/nothing is available for the next boom.]
Capital is a commodity. It seeks returns. At $100/bbl there was a lot of opportunity (peakers really overplayed the whole “cashflow” story, etc.) At $50/bbl, there’s way less opportunity. New opportunities will just be judged based off of price. If we go back to $100 with a strip, then the money comes back. They could care less if someone else lost money before. Just look at it rationally and mathematically as NPV optimization. [Plus with high decline, you can even hedge most of the price risk.]
It’s an article of faith among the Cornucopian Crowd, e.g., Mark Perry, that there is no sign of any kind of peak in sight, but in my opinion this assertion is manifestly false when it comes to actual global crude oil production (generally defined as crude oil with an API gravity of less than 45 API crude oil). Note that what the EIA calls “Crude oil” is actually Crude + Condensate (C+C).
When we ask for the price of oil, we generally get the prices of two grades of crude oils, WTI and Brent, both of which have average API gravities in the high 30’s. But when we ask for the volume of oil, we get some combination of crude oil + condensate + natural gas liquids (NGL) + biofuels. In other words, we get the volume of actual crude oil + partial substitutes. This is analogous to asking a butcher for the price of beef, and he gives you the price of steak, but when you ask him how much beef he has on hand, he gives you total pounds of steak + roast + ground beef.
Shouldn’t the price of an item directly relate to the quantity of that item and not to the quantity of the item being priced + partial substitutes?
But in any event, the fact that partial substitution has so far worked, in response to higher crude oil prices, does not mean that crude oil has not peaked.
Following is an essay, which I sent to some industry acquaintances, that I put together about a week ago:
*In regard to Warren Buffet, we subsequently learned that he spent several billion dollars buying stock in Phillips 66 last week.
Oil prices currently up another 5% or so this morning. Methinks there have been some huge losses for people holding short positions on crude oil in the past three business days.
The EIA monthly C+C production number for June was 9.3 MMBPD, versus 9.6 MMPBD in April. According to CNBC, this report contributed to today’s oil price spike (WTI had been down early).
Current discussion on CNBC, at about 12:30 Eastern Time, is whether investors should follow Warren Buffet’s lead into energy.
There are obviously a lot of variables in an investment and especially the individual situation of the Phillips 66, but, all else equal it implies a view of low prices to continue.
Refiners do better in a low price feedstock environment and worse in a high one. This is because it is hard/slow to add capacity to refineries. (Big capital investment, time to put it in, even downtime to existing plant when making piping modifications for more capacity.) When prices are low, demand for the downstream products is high and thus crack spreads grow. There’s a limit of the available distillation towers or whatever the bottleneck is. (And note refineries have been running at record % capacity levels.) The converse when prices are high. There’s an excess of capacity and you have fixed capital plants trying to sell whenever variable cost is positive. [Basic supply/demand insight.]
Jeffery,
If the Chinese rewarded oil exploration do you believe no oil would be found in unexplored areas in China? With China’s land area, it could easily be the largest oil producer in the world, if they were to remove their political constraints on exploration.
Increased oil production in a net oil importing country would reduce their demand for net oil imports, but I’m not an expert on Chinese oil production, although I do believe that a significant portion of their production is in long term decline.
In any case, once again, following are the mathematical facts of life regarding net exports, which are not statements of opinion, but are instead statements about mathematical certainties:
Re: Global Gas Production
The reason that I have spent so much time on crude versus crude + condensate is that the conventional wisdom is that there is no evidence of any kind of peak in sight, and my contention is that this is manifestly false, in regard to actual crude oil production (45 API gravity and lower crude oil). And if actual global crude oil production has probably peaked, it’s when, not if, that we see similar peaks in global gas and associated liquids, condensate and NGL. In that regard, the global gas data (BP) are pretty interesting. Some rates of change:
2005 to 2010:
Global Gas: +2.8%/year
Global Gas, Excluding North America: +3.2%/year
2010 to 2014:
Global Gas: +1.9%/year
Global Gas, Excluding North America: +1.3%/year
Note that the rate of increase in global gas, excluding North America, fell from 3.2%/year for 2005 to 2010 to 1.3%/year for 2010 to 2014. And of course, “Net Export Math” works for both oil and gas (as well as for domestic food consumption versus production).
The shale advocates would argue that shale plays around the world will keep up us on an indefinite rate of increase in production, but global results have been disappointing in many areas, e.g., Poland, and high costs are a problem, combined with the very high decline rates.
In any case, what causes a peak is the inability to offset declines from existing wells, and therefore the higher the production rate, the closer we are to a peak, because the volumetric decline from existing wells increases in tandem with the increase in production (it’s pretty amazing that so few people are willing to admit this).
Brown:
You are the only one “generally defining” oil as less than 45 API. 47 API Eagle Ford runs through refineries. It’s price is correlated to WTI. And it actually gets a better price than 30 API sour (e.g. “Basra light”). I don’t think any economist would look at lighter oils as anything other than a substitute and significant economically. This is an econ blog. You may pay a little less for an EF cargo. And there are some in the weeds concerns with fluffing the barrel (light ends). But this is really a nuance. From any reasonable economic evaluation, that stuff is OIL.
Even classic lease condensate (like 55-60 API) is pretty much oil. Sure it gets blended with heavy before hitting the distillation tower, but it still makes a lot of gasoline, has a decent price (some delta with WTI) and follows WTI. It’s not like methane or even propane.
And that’s just within the US (where we have export restrictions and a new volume of light). Light oils are even more reasonable on a world basis. And in the US, classically the spreads were much closer or even to the benefit of condensate in the past.
By the way, it’s fascinating that we actually ended up with too much light oil. The peaker trope was that new sources would be heavy and non-WTI-like. And Bakken is very close to classic WTI! Also, current peakers never seem to mention the advantage of low sulfur content (and S and API are broadly speaking inversely correlated.)
Too many people grossly underestimate the benefits of capitalism, free markets, and microeconomics.
And, grossly overestimate the benefits of a high cost/price and low productivity/output economy.
inventories are clearly in a seasonal (driving season) decline, but still way above historical levels because of the contango tradiing…we never saw 400 million barrels before this year….
in reporting on EIA data weekly, i’ve noticed that the weekly fluctuatons in inventories are a function of imports…if two extra VLCCs unload in the same week, your inventories rise…
I think, very relevantly: what is the current cost of production of oil, or even what is the significant distribution range.
I find discussions about oil, or for that matter any finite commodity, without having an agreed upon cost basis factor sort of meaningless.
SecondLook Quite so. Technological progress in fracking is nothing short of astounding. Global economic growth is decelerating with no end in sight. So the only meaningful constraint on price is MC. No curve would be more informative than the historic MC of fracking for say the last two or three years. I do not for a moment believe the current price of $44 is well-below MC. It may be somewhat below, but the all-important technology dynamic is moving the MC curve lower by the day. The solidest, most-well-backed-up projection I’ve seen is that by Mark Mills at the Manhattan Institute: costs are ultimately heading to the $5 to $20 range! Thus far I’ve found very little on what to me has gravitated to the forefront as the next biggest question: What happens when fracking goes global at ever-falling marginal cost?
The Economist Magazine suggested an outlook for an extended period of oil prices in the $5 to $10 range:
http://www.economist.com/node/188181
https://app.box.com/s/npygb8t139jm69yjcz5nhzm8ygibd5pd
https://app.box.com/s/0hroqkg7zym2us8em4k55a36affs4xmc
https://app.box.com/s/6qtqg4w41mrzfn8dhgoq27z3j1n20sg5
https://app.box.com/s/858zgmul9yfhdi1j5fmybhd54jpuexkz
https://app.box.com/s/m4d2o0kl8bqf850e6e2ptu3m3rf2c0tb
https://app.box.com/s/be72m6g0e3pmdss2apjamoswvq7jxe1i
https://app.box.com/s/41k6v2nfqgqs2jcrixrn5bybjdov3hhv
https://app.box.com/s/qml1c2s6fdihreha51dr1x2epxv8bg0u
US oil production per capita is down 40-45% since 1970 and 25% since 1985 (onset of deindustrialization and financialization).
The oil cycle is turning lower (CPI and US$ terms) as in the early to mid-1960s and 1986.
However, this time we have much more debt to wages and GDP; real GDP per capita is growing at half the 1960s and 1980s rates; labor share of GDP is much lower; peak Boomer demographic effects are bearing down in the US, UK, Canada, Oz, EZ, Japan, and now China and the Asian city-states; financial assets are in a MASSIVE bubble and about to burst again as in 1929, 2000, and 2007; wealth and income inequality is obscene and pernicious; health care and debt service costs are precluding any discretionary income for the bottom 90%; and labor productivity is decelerating due to deindustrialization, regressive taxes on earned income, demographics, labor share, debt, and inequality.
http://www.bloombergview.com/articles/2015-02-16/oil-prices-likely-to-fall-as-supplies-rise-demand-falls
I don’t know about Shilling’s speculation about $10 oil, but $25-$32 fits the cycle, technicals, and price-supply-demand for implied global real GDP per capita rate of growth indefinitely hereafter, notwithstanding a possible seasonal technical rally to $55-$60.
Incidentally, the Economist Magazine article I linked to, and that I showed an excerpt from, was published in early 1999.
The Economist Magazine ran their “Drowning in oil” cover story in early 1999, in which they suggested that we would see $5 to $10 oil for the indefinite future. At the time of the story, annual Brent crude oil prices were then in the early stages of three approximate price doublings:
From $13 in 1998 to $25 in 2002;
From $25 in 2002 to $55 in 2005;
From $55 in 2005 to $110 range for 2011 to 2013 inclusive (remaining at about $99 for 2014).
And . . . .
In late 2004, Daniel Yergin predicted that oil prices would be down to a long term index price of $38 by late 2005 (which caused me to suggest that we price oil in “Yergins” with One Yergin = $38).
Also in 2004, the Saudi oil minister reiterated their support for the OPEC price band of $22 to $28.
In August, 2009, Michael C. Lynch predicted that oil prices would soon be back to a long term price in the low 30’s.
In early February of this year, Ed Morse predicted that oil prices could fall as low as the “$20 range for a while.”
My prediction is that global net exporters will continue to deplete their remaining volume of post-2005 CNE (Cumulative Net Exports of oil) at an accelerating rate of depletion.
I estimate that Saudi Arabia shipped about 5% of their post-2005 CNE in 2006, and I estimate that they shipped about 9% of their remaining post-2005 CNE in 2014, AKA an accelerating rate of depletion.
An Interesting Gas Play Case History
The Haynesville Shale Gas Play, which covers part of both Texas and Louisiana, is an interesting case history. Following is a chart showing the monthly production versus the rig count. Note the significant time lag, a little more than a year, between the beginning of the decline in the rig count (late 2010) and the beginning of the decline in production (early 2012). Also, note that that there was about a three year gap between the beginning of the late 2010 decline in the rig count and the end of the steep production decline (late 2013):
http://i1095.photobucket.com/albums/i475/westexas/Haynesville-rig-count-and-natural-gas-production1_zpsb1n95tiz.jpg
In any case, the decline in production from the Haynesville Play contributed to the observed 20%/year exponential rate of decline in marketed gas production from Louisiana from 2012 to 2014 (dry gas production for 2014 not yet available). Note that this was the net rate of decline in gas production, after new wells were put on line (for both conventional and unconventional production). The gross underlying decline rate from existing wells in 2012 and 2013 in Louisiana was even higher than 20%/year.
The Louisiana data provide strong support for the Citi Research estimate that this gross underlying rate of decline in existing US gas production is on the order of about 24%/year (again, gross being the rate of decline, before new wells are added).
With an underlying gross decline rate of about 24%/year, the US needs about 17 BCF/day of new production per year, just to offset the declines from existing production. Note that this volume of gas–that the US needs just to offset declines from existing wells–exceeds the dry gas production levels of every country in the world, except for the US and Russia. In other words, in order to maintain current gas production, we need to put on line–every year–more gas production than Canada, or Norway, or Iran, or Qater, etc.
The gross underlying decline rate from existing US oil production is probably not as high, but a plausible estimate is that it is on the order of 15%/year, which would imply that we need about 1.5 MMBPD (million barrels per day) of new Crude + Condensate (C+ C) production every year, just to offset annual declines from existing wells.
1. The fast decline of shale plays is easily understood and has been conceded readily by industry people and by anyone other than the most neophyte of a cornucopian. Continuing to bang on it smells more of activism than of analysis. And doing it on a relatively sophisticated blog is just tiresome. (In some general public debate, fine, maybe.)
2. The “take another Kuwait every X years” is a pretty old meme. It applies to conventional production also, just not to the same extent. And I have been hearing it, literally since the 1970s. Again making it smacks more of really trite talking point making, not of real analysis.
3. So far, we’ve been able to replace production of gas (and on a worldwide basis of oil) for a long time. Sure it can’t go on forever. but make some argument based off of reserves and/or future extraction capabilities. Not the OMG big number trope.
4. Gas is expensive to store so current prices (low) are not a good indicator of future supply/demand. However, there ARE financial markets to trade natural gas out several years. And those markets show a belief that prices will be reasonable in the future. And that’s even with the “war on coal” and LNG export plants getting built (i.e. more demand).
Other comments:
A. Overall US NG production has increased even as drilling rigs have declined quite a bit in last 5 years. This implies that the high IPs make up for the fast decline of shale plays.
B. Haynesville has dropped because of rigs leaving (as you mention), but if prices go up, rigs will return and so will production. IOW, it’s not really running out of resource but gas on gas competition. (And you can kindly do case studies of Marcellus or Utica or even US overall and see a different story than in Haynesville).
Few considerations:
1. Pareto impact: The rigs laid down (really the projects not drilled) were those that were more marginal. Note: This doesn’t mean there was any improvement in operating practices, just the natural effect of differential project cutting on the survivor population.
2. There is a lag between current drilling and current production based on the time to complete wells. (Current production leverages previous, higher, rig counts.)
3. “Sized for growth”: the previous rig count was enough to grow LTO by another 1+ MM bpd. So you actually have to cut growth first before going into net decline.
Nony: (1) Note productivity was growing just as fast when the number of rigs was increasing, casting doubt on the hypothesis that productivity gains are due to selectively going after the best stuff. (2) Note also that the EIA model relates production in month t to drilling in t – 2; the production figures in Figure 2 for September plotted above are in fact just an inference based on data on actual production and rigs through July. Indeed their model assumes production starts to drop off beginning in month 3 of production from any given well.
I am sorry James but why aren’t economists looking at the 10-Ks and noticing that none of the companies were cash flow positive even when oil prices were very high and the wells drilled were in the more productive areas? Why haven’t they noticed that when the big players came into the shale space they got burned even though they paid less for the properties than what the sellers were saying they were worth on the conference calls.
I think that the evidence shows that the shale story was a big scam driven by easy access to borrowing. Given the massive increase in debt on the balance sheets of most producers and the high depletion rates I just can’t see how the sector can go on selling its narrative for that much longer. Note that in June 2012 the Bakken data showed 4162 wells producing an average of 144 barrels per day. The June 2015 data, which is the last month available, shows 9912 wells producing 116 barrels per day. The number of wells has more than doubled yet the production rate has fallen has fallen by 19.4%. The new wells are high IP wells yet the production rate has fallen has fallen by 19.4%. Sorry for the repetition but most people gloss over the implications. The simple fact is that when you look at the math and the 10-Ks, the narrative being told by the EIA, USGS, and the Wall Street analysts does not work very well.
I think that some time in the next few months the picture will be much clearer and the fingers will start pointing. Given what I have been reading and hearing the problems were created by the Fed and SEC, not the oil company executives who disclosed everything to people who were willing to pay attention.
A company that is growing production at 30% should not be expected to be cash flow positive. Especially when there is a heavy upfront capital investment (the drilling and completion) involved in production.
Lots of people pointed out the companies were not cash flow positive, but they tended to be peak oil advocates who lacked a good understanding of the basics of investment (as simple as NPV). See Copeland’s Valuation or Brealey and Myers Corporate Finance.
Nice point on the slope.
Maybe there are some other confounding factors (e.g. the choking on/off stories we’ve heard), but I find it hard to believe there is no Pareto impact. I’m sure there must be some research papers about lost production when layoffs are done or the like and proof that Pareto implies. Perhaps not at 80-20,but certainly something other than representative populations with no mean difference (cut, remaining). [Anyhow the anti shale types like Hughes and Berman were all making comments about efficiency gains going to run out, last summer. Maybe the organic improvements would have tailed off save the Pareto advance? Or some mix?]
One indicator that seems to imply Pareto impact is the rig map in the Bakken, where rigs have collapsed into the core. (not finding a good link, but it has been well reported with before/after graphics). It shows movement to best rock.
FWIW, segue but related: here is a back of the envelope calculation of breakeven replacement drilling and price needed for a representative shale producer.
http://seekingalpha.com/article/3421446-continental-resources-cash-flow-positive-in-2016-at-60-oil
@Nony
The problem for the industry is the very high decline rate. Most wells lose more than 50% of their production rate in less than a year so the decline after the lag period clears will be much steeper. Think of the Yibal production rate and you won’t be far off for the US shale sector.
The decline rate is irrelevant if the upfront production is sufficient to make the NPV positive. This is a first week of engineering economics concept.
@Nony
The NPV of the revenue from average Bakken/Three Forks well in North Dakota does not cover the cost of the well at present Oil prices. The focus on core areas, might change this, but even a well profile that id 50% higher than the average ND Bakken/Three Forks well would require an oil price over $64/b to break even (NPV= well cost). At some point these higher output well locations will run out. The average Bakken well has an EUR of about 320 kb of oil (not including associated gas), the core area I am assuming would have an average EUR of 450 kb of oil. A nominal discount rate of 8% was used (assuming 3% annual inflation rate), real annual discount rate was 5%.
Agreed. My point is talking about decline like it is some boogie man is silly. NPV is what matters. Heck, total EUR from a well is more valuable, the faster it comes out. 🙂
P.s. Miss me?
It’s too bad, we were unable to make the macroeconomy, in this depression, work more like the tight oil industry. i.e. a steep rise in output, a huge drop in prices, enormous productivity gains, and lower costs.
http://www.thehillsgroup.org/
http://www.thehillsgroup.org/depletion2_018.htm
Peak, shale and tar production is a not-for-profit business, not unlike the US gov’t, the Anglo-American imperial military, the USPS, the Corporation of Communist China, Amazon, Twitter, Tesla, and many biobubbletech companies, some with no REVENUES and a market cap of many billions of dollars. 😀
But, hey, Mr. Musk is using Tesla as a loss leader at thousands of dollars per unit (tens of thousands counting subsidies) to become the techno-optimist exemplar to get us to the Moon, Mars, and ultimately to join our extraterrestrial ancestors inhabiting the Rings of Uranus.
How will be accomplish this? Not by nuclear, wind, or solar. Please! The word is that Musk discovered HUGE deposits of dilithium crystals in Mexico, the Atacama Desert, and not far from where he is building his gigafactory, locations revealed to him by time-traveling Mr. Spock, who himself was informed by the aforementioned extraterrestrials centuries in the future.
Soon we will upload our consciousnesses into virtual humachines, leaving behind our concerns about Peak Oil, population overshoot, resource depletion per capita, and climate change, and go off planet to explore the cosmos as immortal beings for millennia to come.
This is going to be so exciting!
In my view, there world is awash in mis or bad information. Oil prices are anything but linear either positively or negatively. The past 3 days of trading is showing this. Great to read that opec members may begin to discuss a reasonable output level to help restore prices to a fair level. I agree with the bull Boone Pickens as his experience and expertise in energy is par excellence. On his blog, he expects oil to exit this year at 70 per boe. I have a bet with a friend that wit exits this year at at least 60 per boe and I am also long crude, happily long that is…
Anonymous Re your remark on mis or bad information. I could not agree with you more. I interpret this remark as there being far too many gratuitous prognostications that do nothing other than inject noise into the airwaves. Or equally as bad, heavily-hedged puffed-up bets that hold no water when held up to the light of day. Academic papers are major offenders in this regard. Over half are not worth the paper they are printed on. If it doesn’t forecast, it is not science.
Your own prediction re the yearend price of crude is certainly reasonable. I do not put it in the above category. That said, I do disagree with it. What gives my disagreement gravitas is it has teeth, as the following will confirm.
What this site needs is a neutral holder of escrow for legal bets of token amount so commenters can put their money where their mouth is. Claims would be written to pay at a specific date for a specified price, growth rate, or quantity. My reasoning is along the lines of what you were driving at. It is to leaven sense into academics and others who say anything fool thing they want to students, or on sites like Econbrowser, without being called on it. That some people have a belief structure so impervious to the real world that leavening sense into them would not be possible is beside the point. Others would be watching, and that would be value enough for a project like this.
Take the stock market forecast in a comment of mine here on Econbrowser in late-July. I said in no uncertain terms the Dow was in a bear market. That bet would pay off if and when the Dow reached 20% down from its May 19th high; if instead the Dow goes to a new all-time high without first going down 20% I will have lost.
There is no shame in losing. This is an uncertain world. The shame comes otherwise. Most notably in making a highly amorphous statement about the future, and then at some future date crowing about having been right.
Allow me to flesh this out more. Using the WSJ print for the 2015 yearend WTI price of crude as the basis, I’ll take even money crude will end the year below $60 per barrel. Even money that over the next four quarters – Q3 thru Q2 next year – real GDP growth will be below the current WSJ consensus estimate (a known number available to all). That real GDP growth will be below 2% over the next three years (distant payoff date yet noteworthy for what it says). I would, however, require a clause that this latter bet be negated if Donald Trump becomes president. The Iowa winner-take-all presidential market has the Dem candidate priced at (valued at) 59 cents vs. 41 cents for the Rep. My prediction here is this spread will narrow considerably in coming months.
I base this last on the venerable methodology of the 13 Keys to the Presidency (original version). As for my Dow prediction, it is based on a proprietary technical model of mine constructed from market internals. At present, market internals are more negative than at their worst in the 2008 crisis! This brings a further thing to light – technical analysis is a highly valuable tool. Economists would do well to master it, since the market is a fine leading indicator of recessions. Paul Samuelson’s often quoted statement about the market’s ability to predict recessions borders on gibberish. Of course, a bear market does not mean impending recession. No good forecaster ever said it did. Other things have to fall in place. At present they have yet to do so. But in advance of the next recession – whenever that is – stocks will have entered a bear market. The caveat is that stocks go down in both nominal and real terms. Never since the inception of the Dow has the real Dow not led the economy down. Ditto for on the way up.
JBH, agree about the bear market, and it is setting up like 2007, 2000, and 1929 given a list of rarely occurring coincident indicators that occurred only during those periods since the early 20th century:
https://app.box.com/s/vs7kkhuw96x9rksodwbwvnxxek3nis3b
https://app.box.com/s/sqpdwrin8dt40t3ri6n0n5ksx88gtoqz
https://app.box.com/s/5q46eovoo137r3z8xemetj4jipz54jt1
BTW, since the late 1990s and the onset of hyper-financialization of the economy, the stock market has become a “lagging” indicator rather than the widely believed “leading” indicator. If the phenomenon still maintains, the US economy entered recession as long ago as Q4 ’14 to Q1 ’15.
And as is historically characteristic of debt-deflationary regimes of the Long Wave, including Japan since 1992, there will be no persistent capacity constraints, accelerating wages and inflation, a yield curve inversion, and central bank tightening prior to the next recession and bear market. The Fed will much more likely resume QEternity and maintain ZIRP indefinitely.
Peak Trader Word usage is incredibly important. “We” don’t do anything. There is a natural economy driven by the entrepreneurial spirit inherent in humans. It’s part of the survival instinct coded by DNA. The Federal Reserve and big government are world-class obstacles to the economy’s natural rate of growth. Natural growth is the birthright of common man in a civilization as advanced as ours. The Federal Reserve, politicians, and government officials at all levels create impediments to and worsen the drains on natural growth. “They” should get out of the way. There are nuances around this, one notable being reasonable tariff protection like our nation had in its heyday. Another is reasonable-yet-not-onerous regulation of the environment.
Corruption at the highest level — crony capitalism as it is now called, otherwise since time immemorial known as vested interests – is strangling economic growth. It is an open question if Fed officials are corrupt. I do not want to think that of them. But certainly they are imbecilic in the mass devastation they have wrought since the time of Greenspan. We cannot yet look back from the vantage point of ten years out. But unless something changes regarding vested interests, coercive big government, and central banks run amok, the miserable last ten years will look like a walk in the park. This is an easy-to-make prediction in light of the crippling debt burden Keynesian economics has inflicted on this and future generations …
Oil prices will exit, wti, this year at a min of 60 per boe and the extreme pessimists are wrong and I completely disagree with Gary shillings 10-20 call. The past few days should make everyone aware of how quickly prices can change.
https://app.box.com/s/0hroqkg7zym2us8em4k55a36affs4xmc
https://app.box.com/s/npygb8t139jm69yjcz5nhzm8ygibd5pd
Kirby, oil follows the Juglar and Kuznets cycle rhythms, if you will, and the 9-year cycle for real, US$-adjusted WTI is turning down as in the early to mid-1960s and 1986. I suspect this is coinciding with the next deflationary global recession that is likely now underway, including in the oil patch.
https://app.box.com/s/x61sqtg4c3vp1ubo67k8715ulapw35me
https://app.box.com/s/894h3w9iool3d07cnadqa21tmg89xu8n
Historically, the 5- and 10-year rates of US real GDP per capita have not grown much, if at all, with the price of oil above $30-$40. The average annual change of US real GDP per capita since 2007-08 is well below 1% to near 0%. With the current 3-, 5-, and 10-year average prices of WTI at $100 (but rolling over), the prices are well above those of the severe recession of the early 1980s and at, or above, the prices of the Great Recession.
http://www.thehillsgroup.org/
http://www.thehillsgroup.org/depletion2_018.htm
Take a look at The Hills Group’s work on Etp and the energy cost of energy extraction as it relates to the level and rate of growth of available oil energy for the economy. The work implies lower production and lower prices ahead, which will coincide with less demand from the energy sector and energy-related transports, and less demand for the economy overall.
I am shocked at the fact that most people have continued to ignore the elephant in the room; tight oil and gas production was never profitable even when prices were near $100. The simple fact is that the shale bubble was driven by the Fed’s liquidity injections, not sound economics. Primary shale producers have yet to show positive cash flows even though some of them have been in operation for more than a decade. The production increases are driven by debt, not economic profit.
The way the scam works is very simple. A shale producer can point to some wonderful wells that will ultimately produce upwards of 650,000 barrels for a cost of acquisition of the acreage plus $10 million or so for drilling the well. That can be a very profitable venture and offer a great return. The trouble is that such wells are rare and can only be found in the small core areas of the better shale formations. The average well in the formation would produce much less and will not return in sales revenue what the oil costs to produce. The way that the accountants get around this issue is simple. Although the high depletion rates mean that 50% of the oil is produced in less than two years the depreciation schedules used only write off around 15%-30% of the cost. This can work as long as the wells being drilled are in the more productive areas, and there are still a few such areas to be drilled but there is no way to hide the problem once those targets are gone. I suspect that in a few months we will see the cheap financing dry up. Once that happens most of the companies will start do fess up and will write off most of the value off their balance sheets. At that point the shale oil and gas story will be exposed for the capital destroying scam that it was and the financial system will have to write off several hundred billion in loans. Since that should be happening in the alternative energy sector as well we could see some nasty pressure being put on the USD that threatens its status as the primary reserve currency .
Ironically, oil prices should bottom after another possible downturn and given the actual fundamentals should explode to the upside again. And that should expose many projects that had been built in the commodity sector as totally unworkable as low grade open-pit mines are forced to go into receivership and after the closures USD prices move sharply to the upside. This is going to be a very interesting ride. Get the popcorn ready and better pick up a bag or two of junk silver and a few ounces of gold.
Note that Net Cash Flow math is actually quite similar to what I call Net Export Math, to-wit, given an ongoing decline in gross cash flow from production sales, unless total operating costs (lease operating expenses plus G&A overhead) fall at the same rate as, or at a faster rate than, the rate of decline in gross cash flow, the resulting rate of decline in net cash flow will exceed the rate of decline in gross cash flow and the rate of decline in net cash flow will accelerate with time.
This has “Interesting” implications for the remaining cumulative net cash flow from developed producing properties. Of course, the gross cash flow from producing properties can decline when (not if) that production declines and/or if the price declines. This implies a tremendous mismatch between remaining cumulative net cash flow and debt levels for highly leveraged tight/shale players.
What I call the Six Country Case History consists of the major net oil exporters that hit or approached zero net oil exports from 1980 to 2010, excluding China. On the following Six Country Case History chart, the cash flow analogues to Net Export data would be as follows:
Production = Gross Cash Flow From Production Sales
ECI (Export Capacity Index) Ratio = Ratio of Gross Cash Flow to Total Operating Costs
Net Exports = Net Cash Flow (Gross Cash Flow Less Total Operating Costs)
CNE = Cumulative Net Cash Flow
On the Six Country Chart, even as production increased slightly by 2% from 1995 to 1999, they had already depleted 54% of their post-1995 CNE. The cash flow analogue would be that even as gross cash flow increased by 2%, a company would have already depleted 54% of their remaining cumulative net cash flow.
Link to chart:
http://i1095.photobucket.com/albums/i475/westexas/Slide2_zps55d9efa7.jpg
Net Export Math:
https://econbrowser.com/archives/2015/08/u-s-tight-oil-production-decline#comment-192126
Vangel, speaking of the barbarous relic:
https://app.box.com/s/5stj31pxd1t1ze2e6jdc38kz5d1vgqjd
One rarely finds such a compelling technically bullish cyclical setup for a sector as for the miners, a sector that is singularly unloved and virtually left for dead.
While I suspect that the risk is for another global deflationary recession, gold could fall to $1,000 or lower, and miners will probe further for a bottom as the consolidation for the bullish setup resolves, the crash in oil and gas, costs being slashed, and capacity consolidated worldwide, miners should expect to experience steady earnings improvements with easy comparisons hereafter.
FWIW.
Sure, you could’ve said the same thing about the Nasdaq bubble of the ’90s, when lots of tech firms had no profits or big losses.
Yet, today, the U.S. not only leads the world in the Information Revolution (in both revenue and profit), it leads the rest of the world combined.
Peak, yes, and the likes of AAPL and biobubbletechs appear to be setting up another epic crash.
FYI Steven Kopits is doing vacation time (unconfirmed, but very sure about).
+1
Thx. Free beer for you, next time I am near Princeton.
So, yes, I am on vacation, which makes Johnny the best analyst of all.
A few quick comments:
– The cost of oil is not $5-10 and will not be.
– Whatever his other merits might be, Perry is not a great oil analyst (neither is Gary Shilling). For US oil imports, the relevant number is net imports (PAIMPORT in STEO-speak), which accounts for both net crude imports and net product exports. Remember, we’re a net product exporter nowadays. Net oil imports as a share of consumption is 23%, as a share of input to refineries, 27%, not 42% as Perry would have us believe.
– Agree with Vangel about the operator financials. Q2 financials at $55 / barrel were terrible. Will they be better in Q3 at $43? (In excel, take a standard shale decline curve, and model it out by month for, say, 48 months. Then do another one offset by one month forward. And then another one month forward, and so on. This will give you vintages. If you add up the totals, Vangel, you’ll see the decline rate of the wells taken together tends to decline, even though the decline rate for any given well is unchanged.)
– On the other hand, keep in mind that, if you layer a bunch of vintages of high decline wells, the overall decline rate falls over time.
– The reason output per well in the Bakken has fallen is due to over-sized roll of new wells in maintaining a high average overall. If the number of new wells begins to decline relative to existing wells, then average production per well will fall, and pretty fast.
– Bakken productivity (wells / rig / month), as I understand it, has improved largely due to a migration to pad drilling. We spend a lot of time debating Bakken productivity. I can’t tell you that we have a consensus view.
– China’s onshore oil resources are well-known, just as are those of the US. They have not been able to crack the horizontal fracking code there. If they could, that would be a game changer. Big time.
– China’s oil production actually posted a record for July, 4.7 mbpd if I recall the number correctly. We’ve expected China to go into decline for almost a decade. Well, it hasn’t so far.
My working assumption is that China is going to go into some kind of recession. We’ll start modeling that out next week. It is a highly complex forecasting environment right now. By the way, it is interesting that Jim’s commodities model from six months ago suggested a fall in oil consumption, and I commented that such a drop would really have to come from China.
We need two posts, kind professors:
“What would a meltdown in China look like?”
and
“Should China finish devaluing the yuan?”
Both of these are important posts.
Finally, the quality of comments is very good I think. NONY is most improved, a model of how to become a real contributor to the discussion.
Steven,
It occurs to me that Churchill’s quote about Russia could be applied to China, to-wit: China is a riddle wrapped in a mystery inside an enigma.
In any case, an item about China in the WSJ:
Huge Purchases by Chinese Oil Trader Raise Prices, Confusion
Traders say Chinaoil’s dominance in the Dubai spot market is distorting prices
http://www.wsj.com/articles/huge-purchases-by-chinese-oil-trader-raise-prices-confusion-1441103201
China:
The likelihood of recession is high as GDP is on a secular downswing as they rejig out of FAI – real estate development – excess industrial capacity and into services/ consumption at the same time as they are exiting a colossal credit bubble and have declining workforce growth.
China will continue to paper over and smooth any credit collapse including eventually with a bigger ER devaluation as complete control of it will prove impossible. See: David Levy, though he has also said it can be delayed for a bit (12mths) by more stimulus; the book A Great Leap Forward by Mauldin and Wray also favours a hard landing (eg: Raoul Pal says the scale of consumption and services just cannot come close to replacing the falls in FAI-RE and IP from excess capacity); Ray Dalio in late July15 said a China debt deflation crash is looming from multiple bubble bursts, credit is going to cover up bad loans & thus they are Japanese style zombifying their companies, rebalancing to consumption is impossible because households will have to pay all the debts due.
Credit growth however also forecasts a cyclical up turn for the next 6mths as do property prices (many are saying this recently: Capital Economics, BCA,
Variant Perception, Ambrose Evans Pritchard).
So once that upswing completes they have both cyclical and secular cycles aligned to the downside.
ps – Cornerstone Macro in their 2H14 outlook which I was lucky to read, noted that the falling Chinese FAI (and resultant downturn in trading partners) would lead to falling crude prices. They figured it would lower china oil use by 300kbd but also that of its trading partners because they also did an FAI boom with China and this all adds up to 1.8mnbpd taken out of global demand. And that is at 7% china gdp growth and so this will go down exponentially as china slows further to 5 then 3% and 0%…
Excel sentence relates to next comment down.
A reminder that there is a significant technical stop for WTI at $32, having bounced off major support/stop at $42/$39.
There is no significant technical support for WTI below $32 until $24.
https://research.stlouisfed.org/fred2/graph/fredgraph.png?g=1KiO
https://research.stlouisfed.org/fred2/graph/fredgraph.png?g=1HYB
https://research.stlouisfed.org/fred2/graph/fredgraph.png?g=1HUM
https://research.stlouisfed.org/fred2/graph/fredgraph.png?g=1Khe
Orders, wholesale sales and inventories, freight spending and shipments, and the price of gasoline are recessionary.
The price of WTI at $24-$32 during another global deflationary recession is not inconceivable.
https://research.stlouisfed.org/fred2/graph/fredgraph.png?g=1Kjs
https://app.box.com/s/b3ocl3dzohvkiatcffmy6u2gfqkr937e
https://app.box.com/s/c8j4stsqoqlwv6uyjl00a9ndvleys9cm
https://research.stlouisfed.org/fred2/graph/fredgraph.png?g=1KjD
Texas and North Dakota are fixin’ to roll over into recession, y’all, if not already there.
But the rest of the US economy will “decouple” from China, SE Asia, Japan, EZ, Canada, Australia, Brazil, Russia, and the oil patch. No worries. We’re an island of prosperity.
All glory is fleeting
The EIA shows that US Crude + Condensate (C+C) production was 5.0 MMBPD (million barrels per day) in 2008. Let’s assume that the current estimate of 9.6 MMBPD in US C+C production in April, 2015 is correct. And let’s assume that the gross rate of decline in existing US C+C production in 2008 was about 5%/year. So, in order to offset the decline from existing 2008 wells, US operators had to put on line 0.25 MMBPD of new production (which they clearly achieved, given the observed net increase in production).
Here’s the problem.
Even with no increase in the decline rate, as production increases, the volumetric decline from existing wells increased in tandem with the production increase. A peak occurs when the production from new wells (and workovers, secondary, tertiary recovery efforts, etc.) can no longer offset the decline from existing production. Therefore, the higher the production rate, the closer that we are to a production peak, i.e., “All glory is fleeting.”
US operators are, in effect, fighting a two front war–an increase in the decline rate from existing wells and an overall increase in the volumetric decline from existing wells, because of the increase in production. This is of course also largely true of total world production, and my contention is that in all likelihood, virtually all of the new actual crude oil production (45 and lower API gravity crude) that was put on line from 2006 to 2014 inclusive globally only served to approximately offset the declines from existing wells, i.e., it took trillions of dollars in upstream capex to keep us on an “Undulating plateau” in actual crude oil production for the past decade.
In any case, the estimated annualized volumetric declines (rounded off to nearest 0.5 MMBPD) in April, 2015 US C+C production at three rates of decline from existing wells:
5%/year: 0.5 MMBPD
10%/year: 1.0 MMBPD
15%/year: 1.5 MMBPD
At the 15%/year rate, which IMO is the most likely, in order to maintain 9.6 MMBPD, US operators would have had to put on line, from April, 2015 to April, 2016, production that would be approximately equivalent to all of Norway’s 2014 C+C production.
Late August US net crude oil imports (four week running average data, MMBPD):
2008: 10.1
2009: 9.1
2010: 9.6
2011: 9.2
2012: 8.6
2013: 8.1
2014: 7.3
2015: 7.1
Of course, when we look at total production less consumption, overall net imports on a total liquids basis are lower, but it certainly appears that the decline in US net crude oil imports has slowed considerably, and US net imports will in all likelihood be increasing in future months, as US C+C production declines.
It looks like the recent low in net US crude oil imports was in early November, 2014, at 6.6 MMBPD (four week running average), which was down quite a bit from the early November, 2013 number (7.5).
In any event, it seems to me that the bottom line is that for every one bpd of new production that US operators had to put on line in 2008 to offset declines from existing wells, they will need about six bpd of new production now.
I always felt that high price impact was the best fallback position of peakers after US production explosion surprised them as did worldwide gradual up plateau. It was something that cornies needed to concede. At the end of the day, for the US, as a big net importer we gain more from low prices than from the production itself.
Now, I’ll take the low price as a win. Feels like the peak oil skeptics have won twice now over the peak oil advocates (even the more moderate ones). First with the production. Second with prices.
I don’t even like the “no one could have predicted shale”. Peak oil advocates (even the more moderate ones) were slow to look at the warning signs (but quick to look at things like Staniford and Simmons Saudi concerns). They tended to talk it down on the way up. And FWIW, I didn’t predict shale, but I’m not surprised that something came out of the bag. Seems like it has often happened over the history of the industry when back against the wall. And we probably could have done the same impact, by approving ANWR, Keystone, and VACAPES drilling (which were known options). The whole US can’t affect world prices looks pretty wrong in retrospect.
https://www.youtube.com/watch?v=uLK4Z2QEZUI
Very nice 2013 debate between academic peakers and cornucopians.